Technical Analysis Of The Major Markets


SPX: Long-Term Trend - Bull Market
Intermediate trend – SPX has resumed its uptrend in order to complete the last phase of the bull market.
Analysis of the short-term trend is done on a daily basis with the help of hourly charts. It is an important adjunct to the analysis of daily and weekly charts which discuss longer market trends.
A WILD WEEK FOR THE MARKET
Market Overview
The week of Thanksgiving, during which stocks traded in a narrow range, must have been the calm before the storm for the stock market. Shortly after Wednesday’s opening, the SPX started a two-day decline of sixty points which ended abruptly at the close of Thursday and was followed by a forty-four point rally on Friday. Talk about volatility! Several factors contributed to this yoyo action: a speech and testimony by Janet Yellen, Thursday’s ECB decision on interest rates and monetary stimulus, and Friday’s jobs report. By the close on Friday, the rally looked tired, and a short-term reversal would not be surprising on Monday/Tuesday.
Gold looked as it was ready to end its long decline last week. After making a new low and reaching my long-standing projection of 100 on Wednesday, GLD reversed sharply over the next two days. Since this low is being made in conjunction with the bottoming of an intermediate cycle, higher prices look likely in the next couple of weeks. I’ll discuss it in more details later on.
In spite of the sharp reversal on Friday, it is possible that SPX has started a decline of intermediate nature although, until confirmed, a new high is still possible. If so, this should become apparent over the next couple of weeks.
Intermediate Indicators Survey
Both the weekly MACD and SRSI may be starting to roll over.
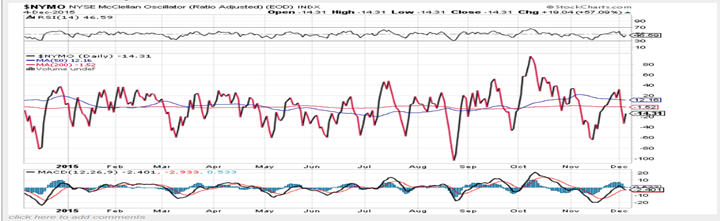
Instead of posting a chart of the NYSI, I am going to show you one of the McClellan oscillator (courtesy of StockCharts.com). I want you see what effect Friday’s 44-point rally in the SPX, had on breadth. At no time during the trading day did the A/Ds exceed 1040+, and this was reached in the second hour of trading. After a short consolidation the rally resumed, but the A/Ds remained in the 800/900s even though it tacked on another 23 points!

The P&F chart had a target about 20 points lower, but prices opted to reverse after only completing a phase projection.
Chart Analysis
Daily SPX Chart
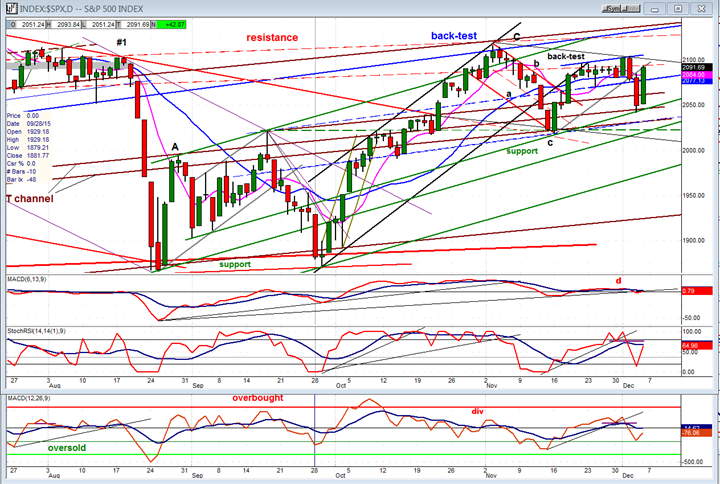
I am posting the index in candlesticks mode, partly in order to give a better visual impression of last week’s action, but mostly to show that Wednesday’s candle was bearish engulfing, which is probably one of the reasons why the selling continued on the next day. Can such a pattern be only good for one day, or does it warn of a longer period of weakness ahead?
Looking at the chart, the decline was contained on the green support line which originally arrested the downtrend from the 11/03 high. That was the third touch on that trend line and if prices go through, it could signal the beginning of a protracted move. Another thing to notice is that Friday’s rally back-tested the trend line that was broken on Thursday. This and other factors should provide some temporary resistance which could bring about a pull-back after Friday’s rally. If the full projection for the short-term distribution pattern at the 2090/95 level is realized, the decline would continue down to the next green support line which originates at 1868. If the index intends to re-test the 2116 high, it will most likely retrace first in order to create some accumulation before pushing higher.
But for that to happen, considerable improvement will have to show in the A/D (bottom) oscillator which performed very poorly on Friday. In fact, all three oscillators failed to make a bullish cross in their MAs. That keeps them in a downtrend in spite of the rally, and some backing and filling will be necessary before we can expect to challenge the 2116 high. On the other hand, if the current support line is broken, it is highly unlikely that we can get back to that level before more weakness tales place. The current cycle configuration calls for a peak by the middle of the month. This period could be used to enlarge the distribution pattern.
Hourly SPX Chart
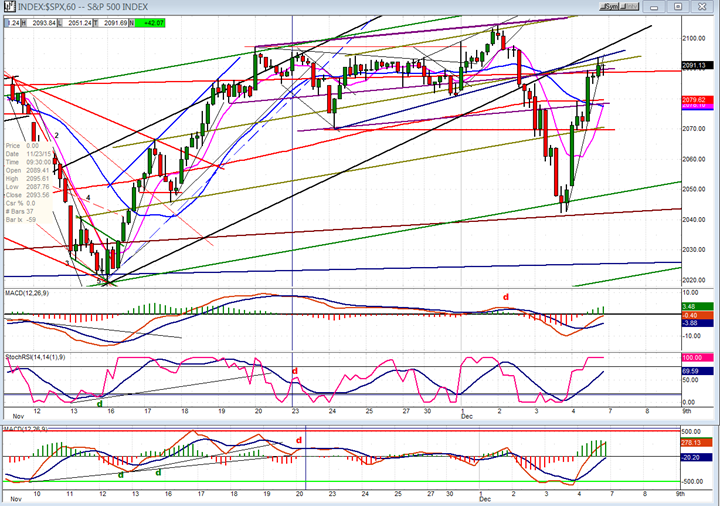
The chart shows a cluster of trend and channel lines which coalesced late Thursday between 2090 and 2095, forming resistance which a spent 44-point rally is in no condition to tackle. It is reinforced by the congestion which formed during Thanksgiving week in the same price range. If, after a short pull-back, SPX were to go on to re-test the 2116 short-term top and attempt to move beyond, it would run into considerably more resistance a few points higher from the bottom line of the intermediate channel and the significant overhead congestion area which was formed over the past few months.
Although the index appears to have met a ceiling at Friday’s close, the indicators do not seem quite ready to signal an immediate reversal, and a short term distribution top could be developed during Monday’s session.
XBD (American Securities Broker/Dealer) and other leaders
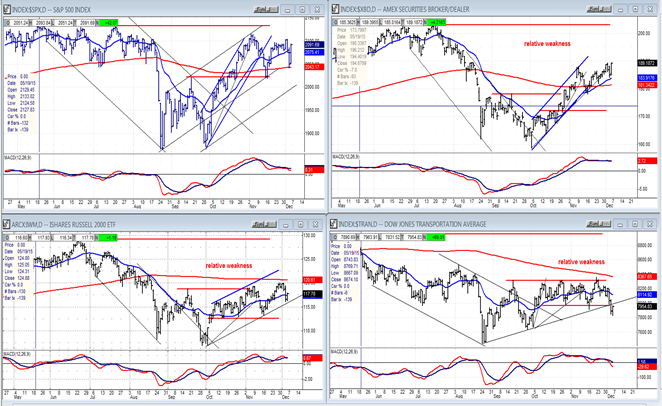
The three leading indices that we follow all reacted differently to last week’s market action. XBD had the most positive one, hardly being affected by the decline and rallying to its recent high on Friday. IWM underperformed during the rally, but TRAN was by far the weakest, making a new short term low. This does not bode well for the market since TRAN has been the market leader on the downside from the very top. Let’s see what transpires next week.
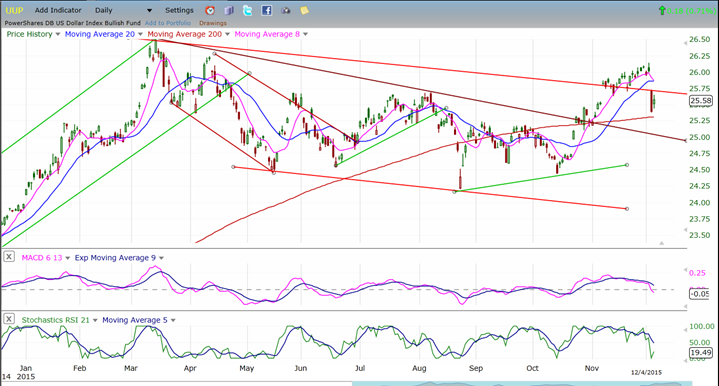
UUP (Dollar ETF)
After a break out of its downtrend line and channel, UUP has had a sharp two day retracement which was not totally unexpected since it has been showing some price deceleration over the last few days. This is likely to be only a short-term correction, after which the index should be able to resume its uptrend and make a new high.
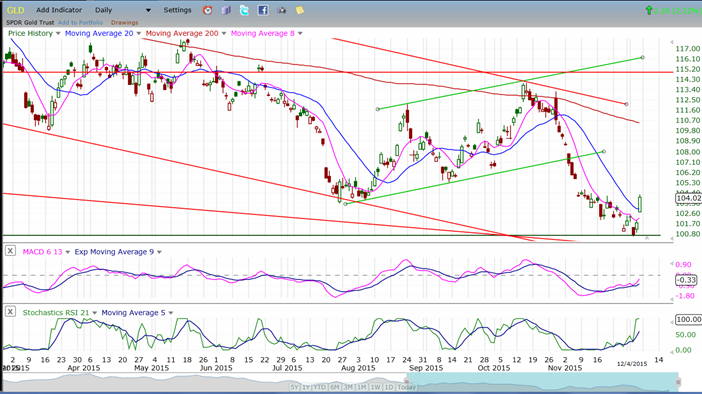
GLD (Gold Trust)
The sharp pull-back in UUP had the opposite effect in GLD, enabling it to reverse its short-term decline after it had completed 5 waves to the downside and reached the 100 target that I have been expecting. While higher prices are likely over the next few weeks, a genuine intermediate uptrend may have to wait until it has formed a larger base as a result of a re-test of the low.
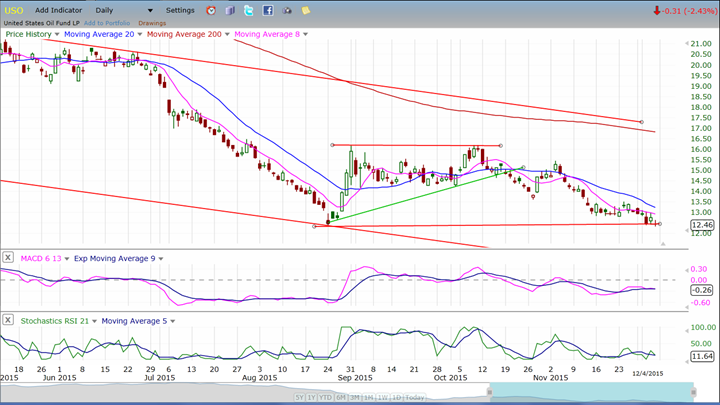
USO (United States Oil Fund)
USO profited from the decline in UUP by only making a fractional new low -- so far! A larger decline down to its 8 target is reserved for later, probably after UUP steadies itself and starts back up after completing its correction.
Summary
Last week’s wild gyration in the index created some ambiguity as to which direction it wants to take over the short-term. A week ago, the indicators suggested that a little more strength could take place, but it was short-lived and was followed by a sizeable decline. In spite of Friday’s powerful price rally, SPX may have been technically damaged beyond the possibility of a short-term repair. This means that after some additional distribution, it could be vulnerable to more severe weakness.
********
FREE TRIAL SUBSCRIPTON
Market Turning Points is an uncommonly dependable, reasonably priced service providing intra-day market updates, a daily Market Summary, and detailed weekend reports. It is ideally suited to traders, but it can also be valuable to investors since highly accurate longer-term price projections are provided using Point & Figure analysis and Fibonacci projections. Best-time reversal estimates are obtained from cycle analysis.
For a FREE 4-week trial, send an email to: [email protected]
For further subscription options, payment plans, weekly newsletters, and for general information, I encourage you to visit my website at www.marketurningpoints.com. By clicking on "Free Newsletter" you can get a preview of the latest newsletter which is normally posted on Sunday afternoon (unless it happens to be a 3-day weekend in which case it could be posted on Monday).
The above comments and those made in the daily updates and the Market Summary about the financial markets are based purely on what I consider to be sound technical analysis principles. They represent my own opinion and are not meant to be construed as trading or investment advice, but are offered as an analytical point f view which might be of interest to those who follow stock market cycles and technical analysis.

When Andre Gratian was a stock broker years ago, a friend introduced him to technical analysis of the market. Consequently, it is not an exaggeration to say that Andre fell in love with this approach! Ever since then, it has become an increasingly important part of his professional life. Gratian has studied the works of Wyckoff, Edwards & Magee, Edward J. Dewey (cycles) and many others. However, one of my most profitable undertaking has probably been to study Point & Figure charting, which he finds invaluable in analyzing stocks and indices. If he were restricted to one methodology, this is the one that he would choose. This well-rounded background has given him what he feels to be a special insight into the stock market, facilitating the recognition of meaningful patterns and the ‘turning points’ in all trends, whether they be short or long term. Andre feels very comfortable discussing the stock market and passing on meaningful information to others. His subscribers include individuals and money managers throughout the world. Moreover, his Newsletters are currently published on several financial sites, here and abroad.
More from Gold-Eagle


