Technical Analysis Of The Major Markets
 share
share
 share
share
 share
share
 share
share
 share
share
SPX: Long-term trend – Still Bull Market?
SPX: Intermediate trend – The index appears to have made a secondary top at the 2104 level and to have started another decline of intermediate duration.
Analysis of the short-term trend is done on a daily basis with the help of hourly charts. It is an important adjunct to the analysis of daily and weekly charts which discuss longer market trends.
A FAILED RALLY
Market Overview
“A bear market rally occurs after an important decline, rapidly retracing a good percentage of it, but it has no staying power and comes back down as quickly as it went up”. That seems to be a good description of what happened last week. Last Monday, SPX ended a decline from 2104 at 1994 and bounced back immediately, rising to 2076 by Wednesday. At Thursday’s opening, it tried to exceed that level, found that it could not, and started back down, continuing to drop steadily into Friday’s close where it finished the week at 2005 having retraced 93% of the early-week advance! That looks like a bear market rally to me!
Whether or not we are in a bear market is something that the future will tell us, but it’s starting to act like one and, based on the degree of distribution that took place on the SPX P&F chart between March and August of this year, if we drop below 1868, we are looking at a potential 600-point decline from the top -- and this is a conservative estimate. We don’t have to put a label on the market’s condition, but we have to admit that it is not acting in a way that should inspire confidence to the bullish camp. If this continues, and especially if this decline goes on to exceed the August lows, it will become clear that we have started an important correction which will continue until the direction of the trend changes.
Why should a bear market start at a time when the economy is recovering well enough to inspire the Fed to start increasing interest rates? It would not be the first time that a similar question has been asked at the beginning of a bear market. The answer lies in a study of cycles. This is what Eric Hadik (www.insiidetrack.com) does very well. Cycles can give us an inkling of what the future will bring. Eric had predicted that a serious decline would start in August followed by a recovery, and that a second phase of that decline would become manifest about now! Kudos to Eric! It looks like he was spot on!
Intermediate Indicators Survey
Both the weekly MACD and SRSI are now in an established downtrend.
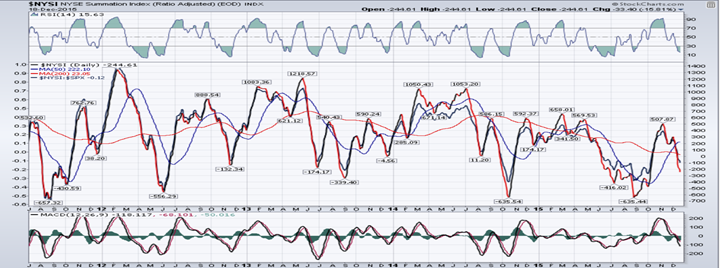
The Summation index (courtesy of StockCharts.com) totally ignored the rally part of last week and has continued to decline, from 0 to -200, so far. So have its RSI and MACD which are nowhere near their oversold level, suggesting that the downtrend of the main index is not likely to be complete.
 “The 3X P&F chart has a short-term projection of a few points lower. However, the degree of distribution which occurred after the 2116 top almost ensures that if the decline does stop here, this is only a phase count, and not the entire count, which is potentially much lower.”
The longer term potential of the 3X chart was briefly addressed above. The odds of it being realized are far better than average
Chart Analysis
Daily SPX chart
It is becoming apparent that the SPX is getting weaker. The trend line from the top of the secondary move has been re-adjusted once again to a steeper angle. This is a sign of accelerating weakness which will probably increase even more if the index falls below the bottom red channel line. Last Monday, the price dropped below the bottom purple channel line but, after a futile effort to re-establish itself within the channel, it broke below again; and on Friday, closed decisively below that channel line, suggesting that the recovery phase from the 1868 low is over. The next challenge should be at the blue and brown trend lines which come to a junction at about the level of the next projection target. Failing to hold in this area, the index’s very last chance will be the heavy red trend line which was discussed a few weeks ago as the potential bottom range of an even wider consolidation pattern. When (if) it breaks below the red line, affirmation will be given that the top distribution level projection is likely to be correct.
When the index broke the bottom line of its blue intermediate channel in August, it also broke below the half-way mark of its broader long-term (brown) channel, stopping within 70 points of the bottom channel line. The rally which took place from that low caused it to restore trading in the upper half of its long term channel. It re-entered the lower half briefly last Monday and once again Friday; this time looking more and more as if it intends to remain in the lower tier. But perhaps not for long, because if it does not hold at the brown/blue lines junction, it will start to trade below the long term trend line from March 2009 which would be one more reason to categorize this downtrend as the beginning of a bear market.
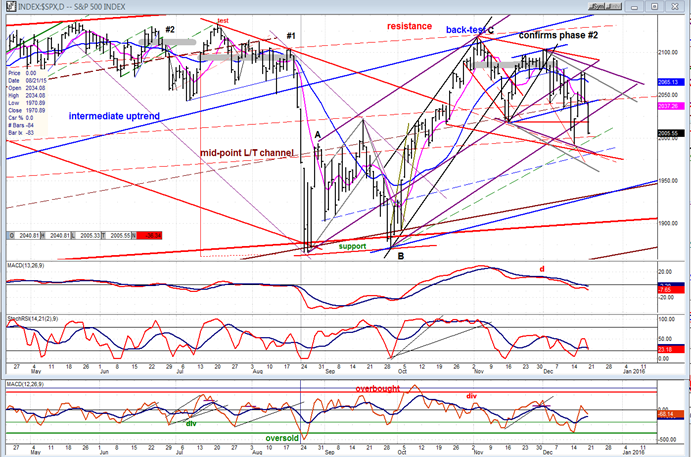
Last week’s rally had more of an effect on the two lower indicators than it did on the MACD which is the least sensitive of the three. They have already begun to retrace a portion of their up-thrust but the A/D oscillator will have to make a bearish cross and continue lower to ensure that there is continued weakness.
Hourly SPX chart
When the rally from 1994 ended as a wedge pattern and started to retrace, it was a sign that the rally had most likely come to an end. The fact that it met its P&F projection to 2076 exactly was another dead give-away. By closing on its low of the day on Friday, the index almost ensures that it will make a new low on Monday, but a couple of things tell us that this follow-through should be limited on the downside. One is that it is coming to the support provided by the former low at 1994 and by the two trend lines coming to a junction just a few points higher. The second is that a wedge pattern, when complete, tends to retrace its uptrend in full, back to the origin of the wedge, i.e. 1994 in this case.
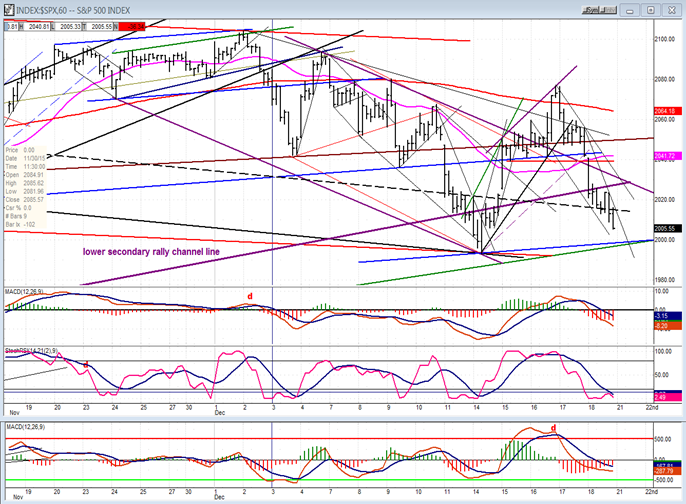
The indicators tend to agree! Granted, on Friday trading was being influenced by options expiration, and as a result perhaps, the A/Ds were proportionately far less weak than the price index. This is reflected in the A/D oscillator which showed deceleration all day long. The SRSI is also showing some minor positive divergence and the index itself appears to be in the process of making a fifth wave from the 2076 top. Nevertheless, the low will be in when the indicators say it is and the minor downtrend line has been broken.
XBD (American Securities Broker/Dealer) and other leaders
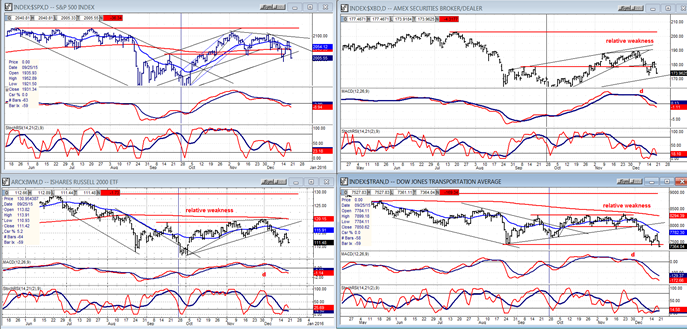
Among our leading indicators “regulars”, XBD tried to distinguish itself from the others by showing a little short term strength, but it was a brief endeavor and it has now rejoined the pack. At no time was its relative weakness to the SPX really jeopardized. IWM remained solidly indicative of the developing weakness. As for the TRAN, it is by far the winner – because it is the biggest loser, having broken below its August low. This is the one index we really need to follow closely. It has more than proven itself by starting to be relatively weak to SPX at both the primary and secondary tops.
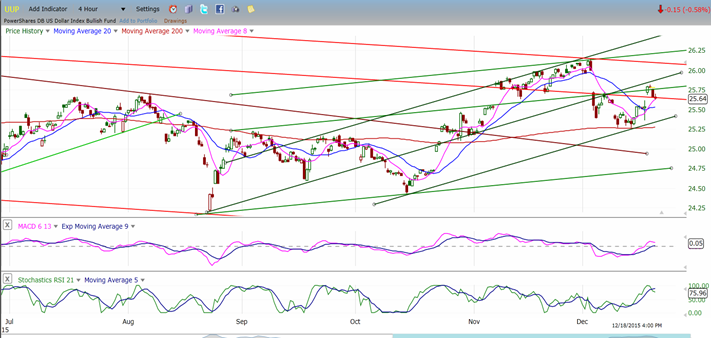
UUP (Dollar ETF)
The dollar has lifted from its correction low and resumed its uptrend in what is considered to be the 5th wave of wave 5 from its 2011 low. If that wave does not truncate, it should make a new high for the move before starting what could be an intermediate correction.
GLD (Gold Trust)
Following the lead of the dollar, gold may be making an important low after a long correction from its 2011 high. The last down-wave (which is shown here) has also partitioned into 5 segments and we are in the final one right now which, according to P&F, has to reach 98-99 before finding an intermediate bottom. Using standard measurements which often apply in price movement, this intermediate low could lead to a 33-pt rise in GLD over the next few months as it retraces .382 of its decline from the 185 high.

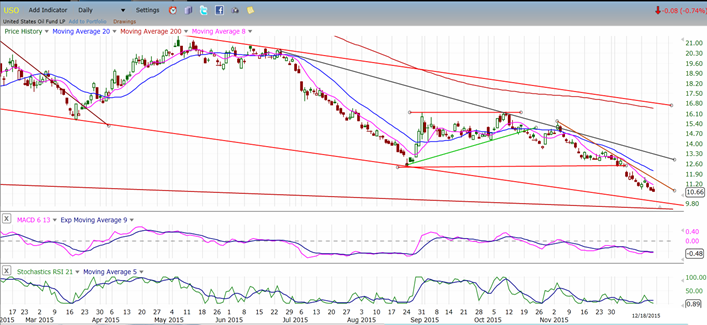
USO (United States Oil Fund)
USO is also coming into its low point which is deemed to be about 8, based on the P&F count. My analysis tells me that it is probably in wave 5 of 3, which could find support a little below 10.00 before starting wave 4. Lately, the prevailing view on CNBC is that the market declines when oil is down, and vice-versa. Currently, there appears to be some positive correlation between the two indices, which means that we could find a short-term market low when oil concludes wave 3 of five in the next few days.
Summary
“At this point, the possibility that the bull market is over is just that: a possibility! But the market should not keep us guessing too long about whether or not this becomes a fact. Many credible economic and geopolitical arguments can be made for it, but we’ll confine ourselves to the technical crystal ball. Let’s give the SPX a few more weeks to reveal its intentions.”
Indeed, with last week’s action, it appears that SPX is starting a new downtrend after having made a secondary top at 2104. Because the amount of distribution which has been made on the P&F chart since that peak is calling for much lower prices, the bias has to be to the downside. Over the short-term, the current decline could find temporarily support around the previous low of 1994, but when it resumes, that low should be decisively penetrated.
It will probably take a little longer to challenge the 1968 low but, if the P&F count is correct (and realized) that low should also fall before too long.
********
FREE TRIAL SUBSCRIPTON
Market Turning Points is an uncommonly dependable, reasonably priced service providing intra-day market updates, a daily Market Summary, and detailed weekend reports. It is ideally suited to traders, but it can also be valuable to investors since highly accurate longer-term price projections are provided using Point & Figure analysis and Fibonacci projections. Best-time reversal estimates are obtained from cycle analysis.
For a FREE 4-week trial, send an email to: [email protected]
For further subscription options, payment plans, weekly newsletters, and for general information, I encourage you to visit my website at www.marketurningpoints.com. By clicking on "Free Newsletter" you can get a preview of the latest newsletter which is normally posted on Sunday afternoon (unless it happens to be a 3-day weekend in which case it could be posted on Monday).
The above comments and those made in the daily updates and the Market Summary about the financial markets are based purely on what I consider to be sound technical analysis principles. They represent my own opinion and are not meant to be construed as trading or investment advice, but are offered as an analytical point f view which might be of interest to those who follow stock market cycles and technical analysis.
share
share
share
share
share

When Andre Gratian was a stock broker years ago, a friend introduced him to technical analysis of the market. Consequently, it is not an exaggeration to say that Andre fell in love with this approach! Ever since then, it has become an increasingly important part of his professional life. Gratian has studied the works of Wyckoff, Edwards & Magee, Edward J. Dewey (cycles) and many others. However, one of my most profitable undertaking has probably been to study Point & Figure charting, which he finds invaluable in analyzing stocks and indices. If he were restricted to one methodology, this is the one that he would choose. This well-rounded background has given him what he feels to be a special insight into the stock market, facilitating the recognition of meaningful patterns and the ‘turning points’ in all trends, whether they be short or long term. Andre feels very comfortable discussing the stock market and passing on meaningful information to others. His subscribers include individuals and money managers throughout the world. Moreover, his Newsletters are currently published on several financial sites, here and abroad.
More from Gold-Eagle