Technical Analysis Of The Market


Current Position of the Market
SPX Long-term trend: An “official” bear market has now been declared.
SPX Intermediate trend: Intermediate low mid-year.
Analysis of the short-term trend is done on a daily-basis with the help of hourly charts. It is an important adjunct to the analysis of daily and weekly charts which discuss longer market trends.
Approaching Short-term Low
Point & Figure overview of SPX
Long term trend: Only intermediate targets reliable at this time.
Intermediate trend: Estimated top of countertrend rally ~2930!
Important cycles followed
I follow only a few cycles that I consider reliable in my analysis. This is complemented by the analysis of Erik Hadik (www.insiidetrack.com).
The 80-d cycle was due on 4/8(actual 4/3); next on 6/8; 40-wk ~7/15; 4.5-yr or 9-yr ~7/15.
Market Analysis (Charts courtesy of QCharts)
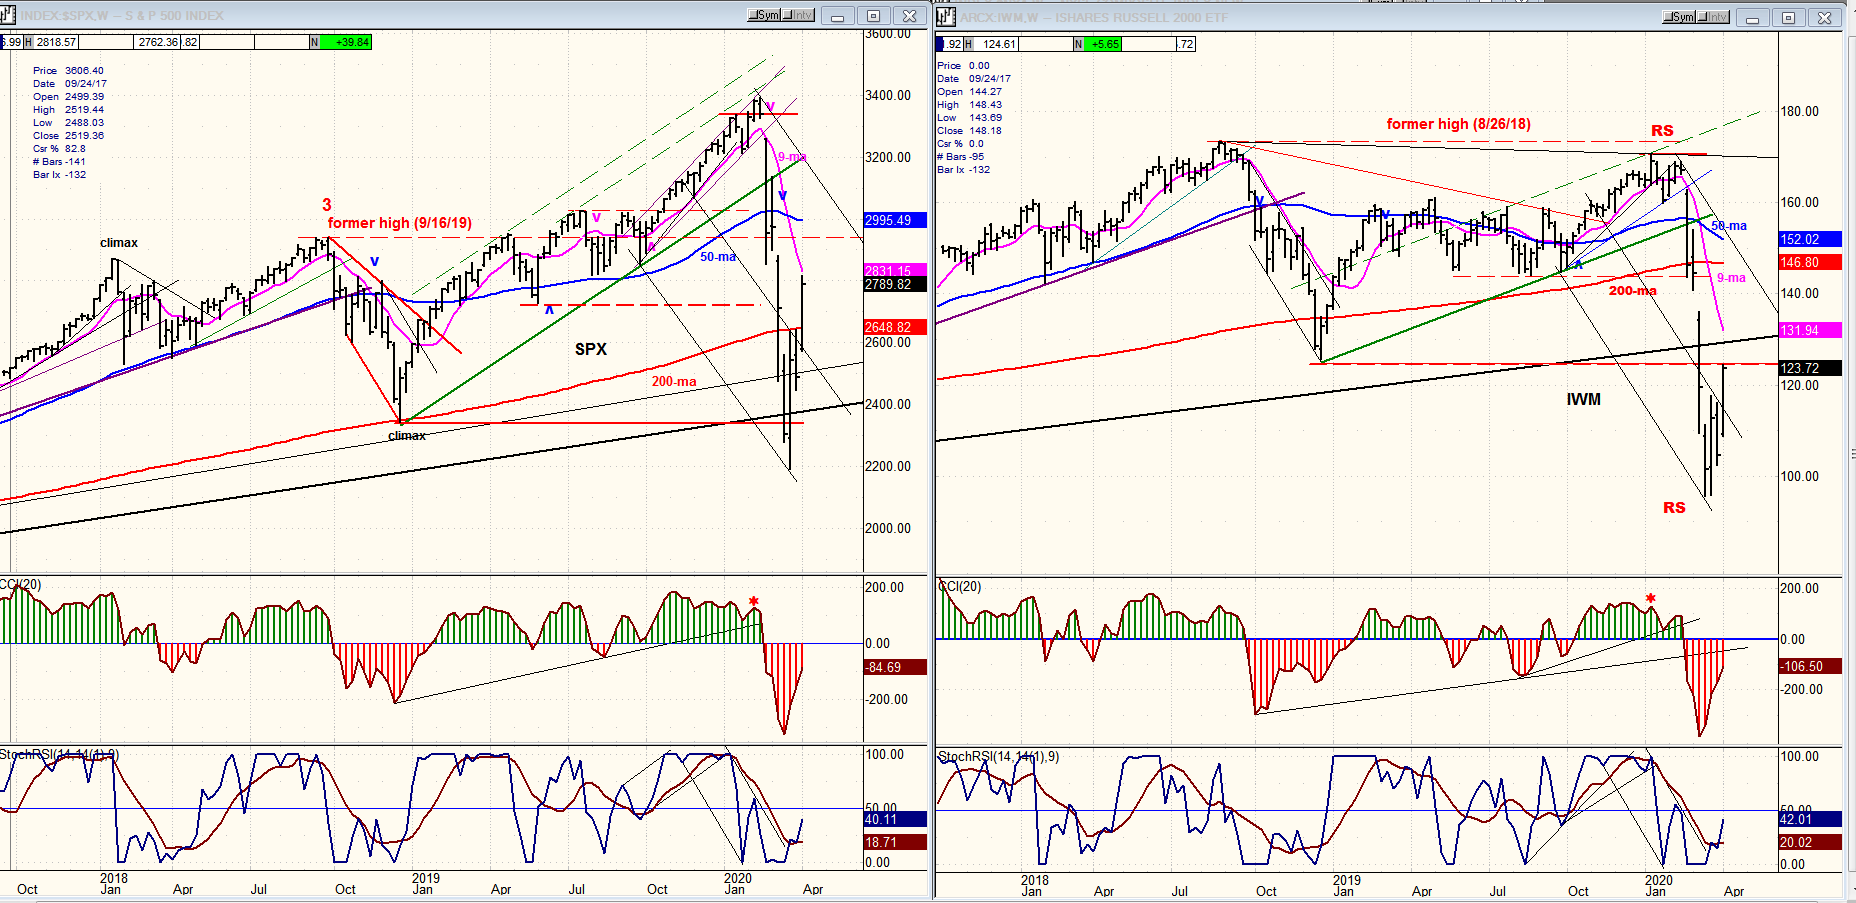
SPX- IWM weekly charts:
The divergent relative strength between the two indexes is glaring, but they both participated in the third week of a countertrend rally from the 3/22 initial bear market low; and there is enough momentum to keep them going a little higher after a short pause. However, indicators are suggesting that this rally will no be enough to turn intermediate indicators positive.
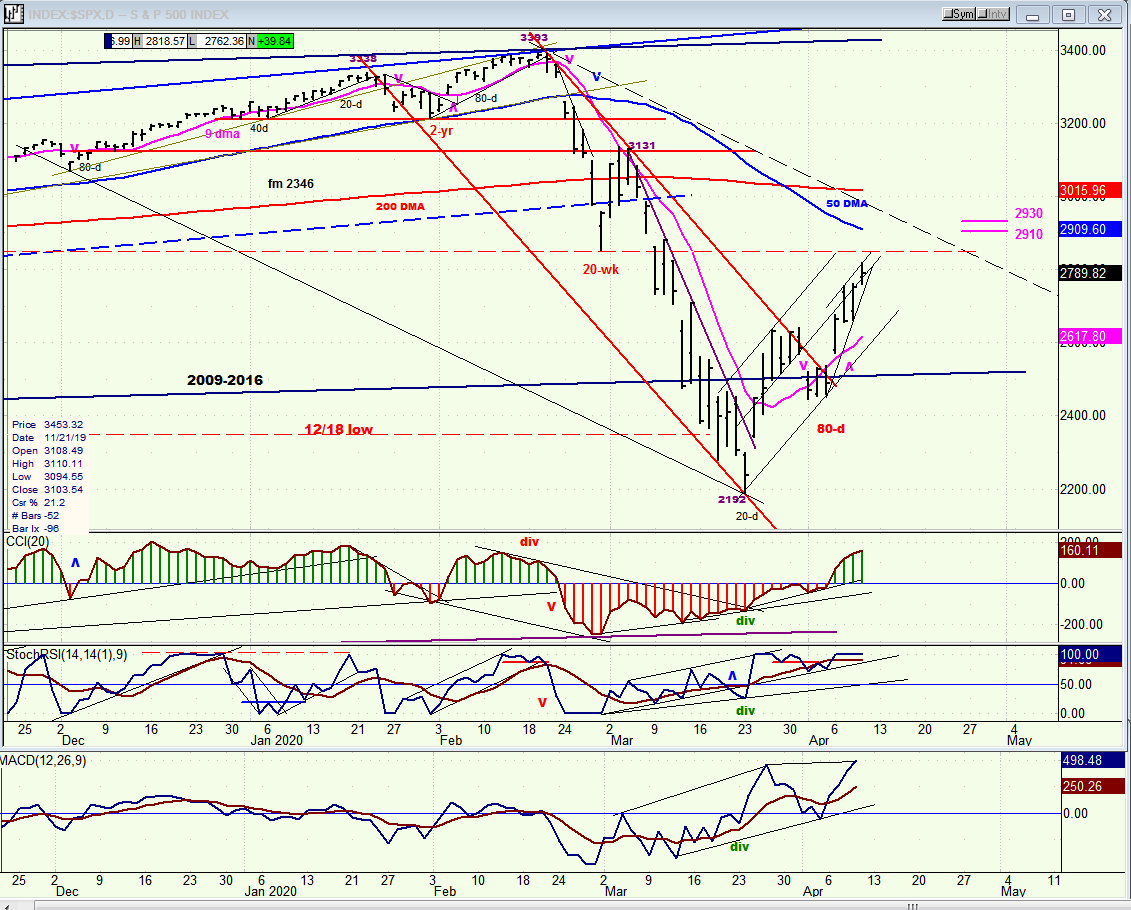
SPX daily chart
After completing its initial decline of 1200 points in about a month, SPX began a countertrend rally which first found resistance at the trend/channel line of the downtrend and, after a “mild” one-day pull-back of 194 points followed by a new base of only three days, started on the second phase which may have ended on Thursday -- 360 points higher in only 4 trading sessions. I am posting these phase numbers and the time span during which they were accomplished to illustrate the unprecedented volatility currently occurring in the market. In any case, since we have essentially reached the projection for the second phase of the rally, one should now expect a new pattern of consolidation to form before embarking on the third and final sprint to the range posted on the chart. This new consolidation should be expected to be longer than the one which took place a the ~2500 level, but perhaps not necessarily deeper since there is excellent support starting at 2650.
Following the third up-phase of the bear market rally, we should be on the lookout for a new decline which is expected to end mid-year at a new bear market low which is currently undetermined! We’ll need more data to get some idea.
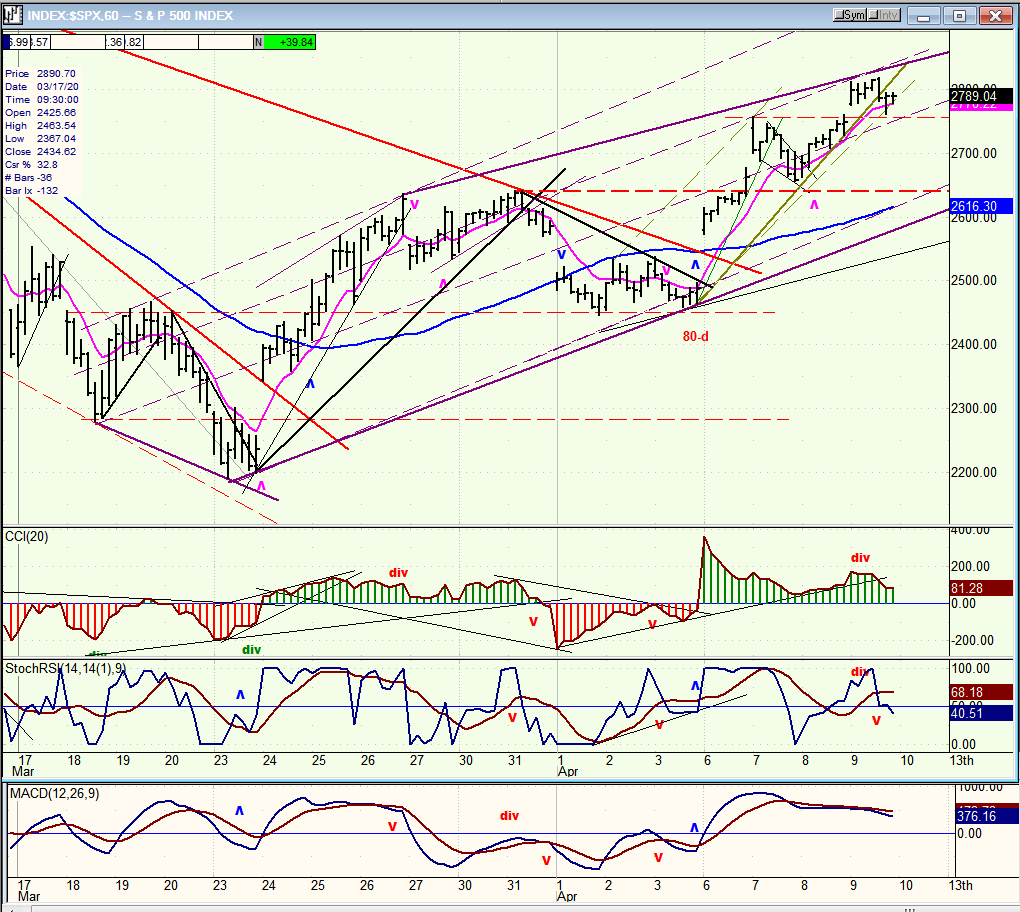
SPX hourly chart
In the last letter, I mentioned that the 80-day cycle could bottom early; and it did, starting off the next up-phase of the countertrend rally with a gap opening taking the index from 2489 on Monday morning, to Thursday where it topped at 2819 and closed at 2789. This puts it in the projected range for the end of the second phase of the rally where it could bounce around for a couple of days before rolling over for the next near-term correction.
The price target is supported by divergence having developed in the CCI, while the leading SRSI has already become negative. The lack of oscillator divergence at the daily level suggests that, instead of ending the rally at this level, after the next minor correction we could have one more bullish phase in the rally before it ends it in the price range shown on the daily chart.
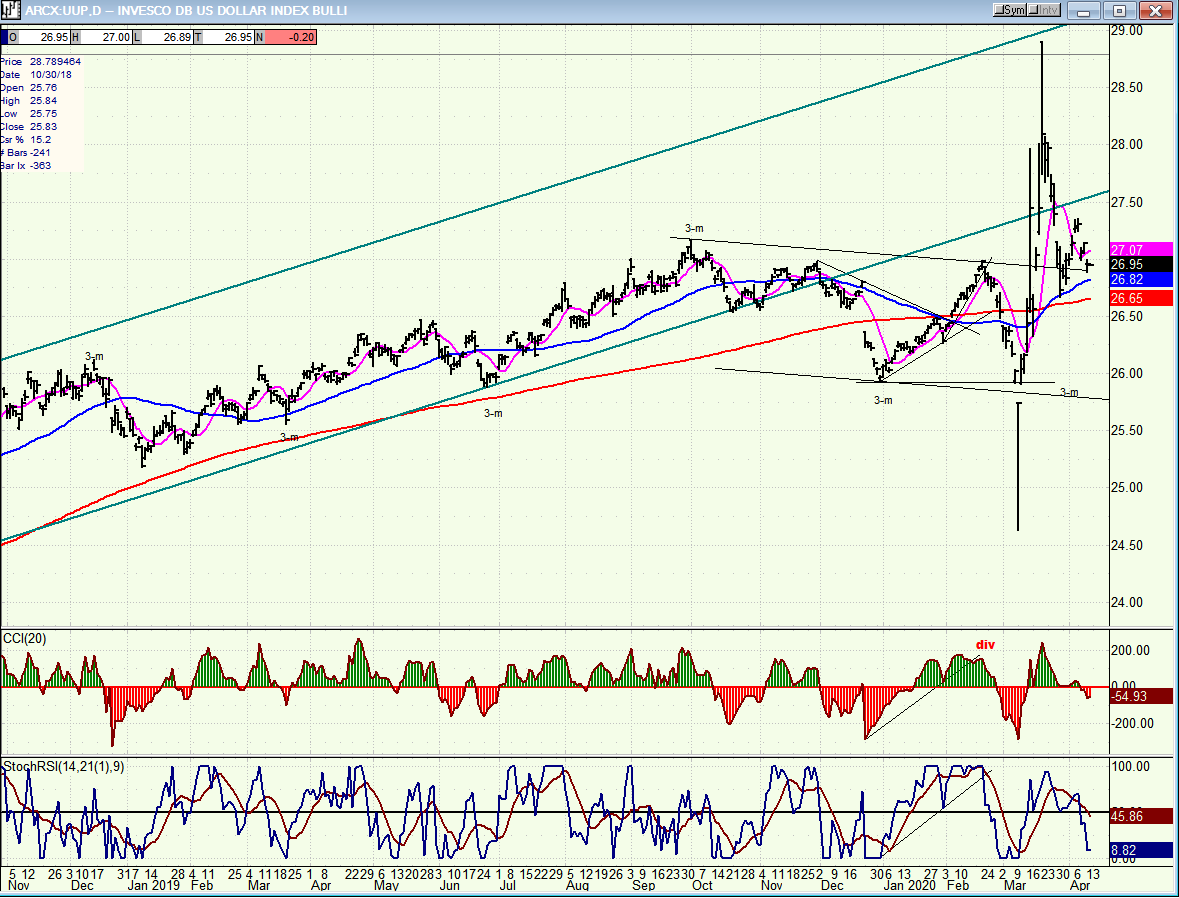
UUP (dollar ETF)
After a brief bounce from the 50-dma, UUP is pulling back one more time to the MA, an area of support which is reinforced by the 200-DMA slightly lower. The most likely near-term activity will be some consolidation at this general level which may resist weakness until the 3-mo cycle turns back down.
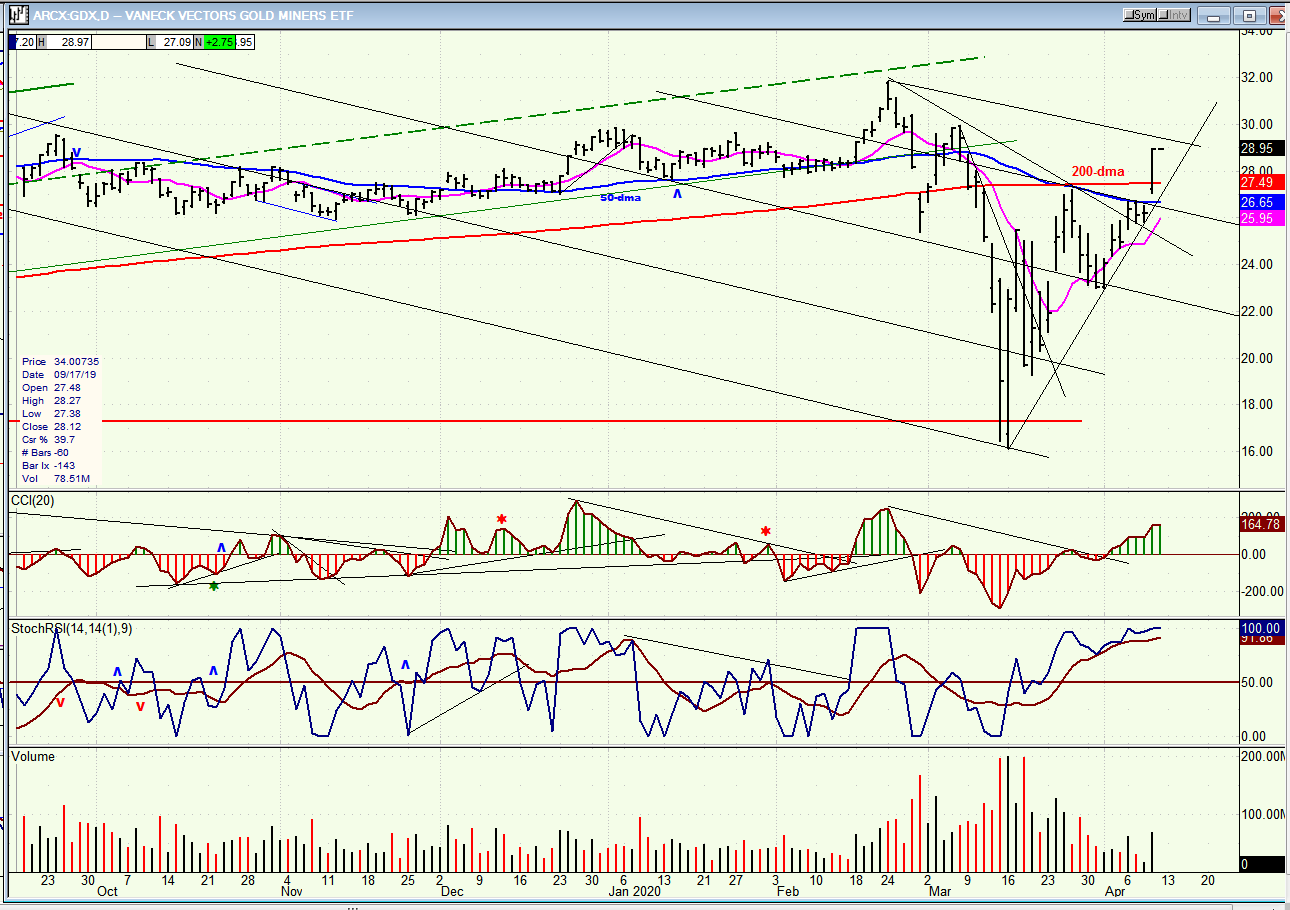
GDX (gold miners)
GDX has made a strong recovery since its recent low of 16. Friday’s surge to 28.95 was caused by a break above the combined 50-dma and 200-dma, but this brought it into a zone of resistance, and in proximity of an interim P&F target which could contain the advance for a little while. The intermediate projection is about 40.
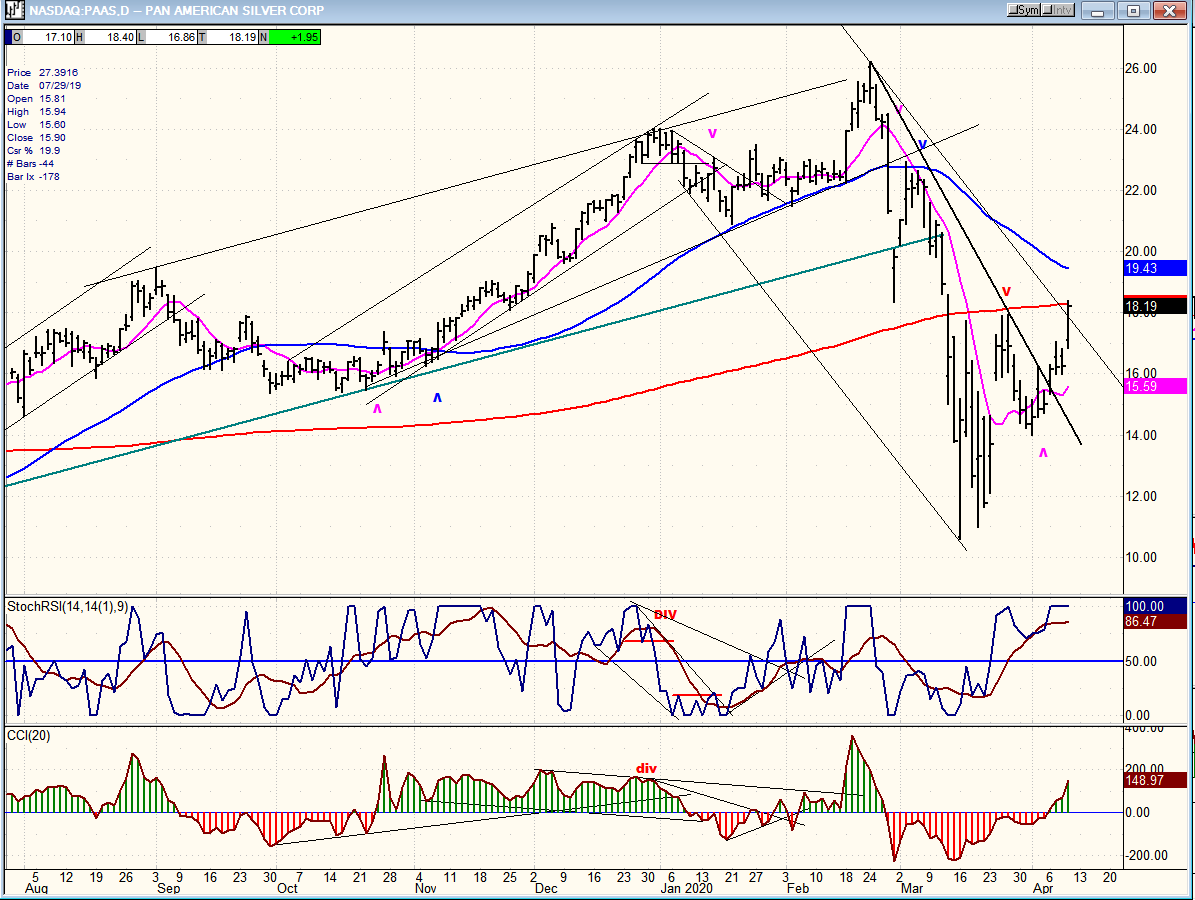
PAAS (Pan American Silver Corp)
Silver is weaker than gold but PAAS duplicates the price pattern of GDX. Thursday’s move to a little above 18 ran into the 200-dma and but could push up another point before the next consolidation.
BNO (U.S. Brent Oil fund)
BNO’s rebound reached 11, but it quickly pulled back to 9.50. It could reach 12 max, short-term, but is not likely to make much more headway until it has built a base which can support higher prices.

Summary
After its initial drop of 1200 points to ~2200, SPX has been making a comeback which is most likely nothing more than a countertrend rally that will have to retest its low successfully to prove otherwise. There should be another hundred points left in the rally before it ends.
Free trial subscription
With a trial subscription, you will have access to the same information that is given to paid subscribers, but for a limited time period. Over the years, I have developed an expertise in P&F charting (price projection), cycles (timing), some familiarity with EWT, and general technical analysis which enables me to warn subscribers of pending reversals in market trends and how far that trend can potentially carry. For a FREE 4-week trial, subscription options and payment plans, I encourage you to visit my website at www.marketurningpoints.com.
The above comments and those made in the daily updates and the Market Summary about the financial markets are based purely on what I consider to be sound technical analysis principles. They represent my own opinion and are not meant to be construed as trading or investment advice, but are offered as an analytical point of view which might be of interest to those who follow stock market cycles and technical analysis.
********

When Andre Gratian was a stock broker years ago, a friend introduced him to technical analysis of the market. Consequently, it is not an exaggeration to say that Andre fell in love with this approach! Ever since then, it has become an increasingly important part of his professional life. Gratian has studied the works of Wyckoff, Edwards & Magee, Edward J. Dewey (cycles) and many others. However, one of my most profitable undertaking has probably been to study Point & Figure charting, which he finds invaluable in analyzing stocks and indices. If he were restricted to one methodology, this is the one that he would choose. This well-rounded background has given him what he feels to be a special insight into the stock market, facilitating the recognition of meaningful patterns and the ‘turning points’ in all trends, whether they be short or long term. Andre feels very comfortable discussing the stock market and passing on meaningful information to others. His subscribers include individuals and money managers throughout the world. Moreover, his Newsletters are currently published on several financial sites, here and abroad.


