Technical Analysis Of The Markets


Current Position Of The Market
SPX Long-term trend: The uptrend should continue after pausing for a correction.
SPX Intermediate trend: “An ending pattern appears to be in its last stages of completion. This should be followed by an intermediate term correction into October.” The correction has started.
Analysis of the short-term trend is done on a daily-basis with the help of hourly charts. It is an important adjunct to the analysis of daily and weekly charts which discuss longer market trends.
Intermediate Correction Underway
Market Overview:
“With an important intermediate cycle bottoming in the near future, it is no wonder that the SPX is having trouble reaching its ideal final target of about 2500.” In fact, SPX found its limit at 2491, and reversed immediately, making it quite clear that this would be its final high (for a while)! For some time, I have warned that the 20-week cycle is very predictable and that, not only a correction was coming, but when this occurred during the seventh year of the decennial pattern, as we approached the month of October, the odds strongly favored that the bottoming phase of the 20-wk cycle would act as a trigger for a much longer and deeper corrective period.
It did not disappoint and came right on cue! The index has already shed 53 points, and a little more is likely – another ten points or so -- down to a level which strongly qualifies as initial support for this correction. If it reaches this area, it will have: come to rest on a former congestion pattern and pivot point, filled a P&F and Fibonacci projection, satisfied a structural requirement, and closed an open gap! By finding a low early next week and reversing, the 20-wk cycle will have bottomed in its normal time frame which is about 96-98 days from its former low.
Should this reversal occur, it will most likely complete the first phase of a corrective pattern, and initiate a rally which will end when its projection (to be determined) is filled. The most likely scenario to expect for the entire correction is an a-b-c pattern which will come to an end in October. We will monitor its development closely to make sure it does not evolve into something totally unexpected.
Analysis: (These Charts and subsequent ones courtesy of QCharts.com)
Daily Chart
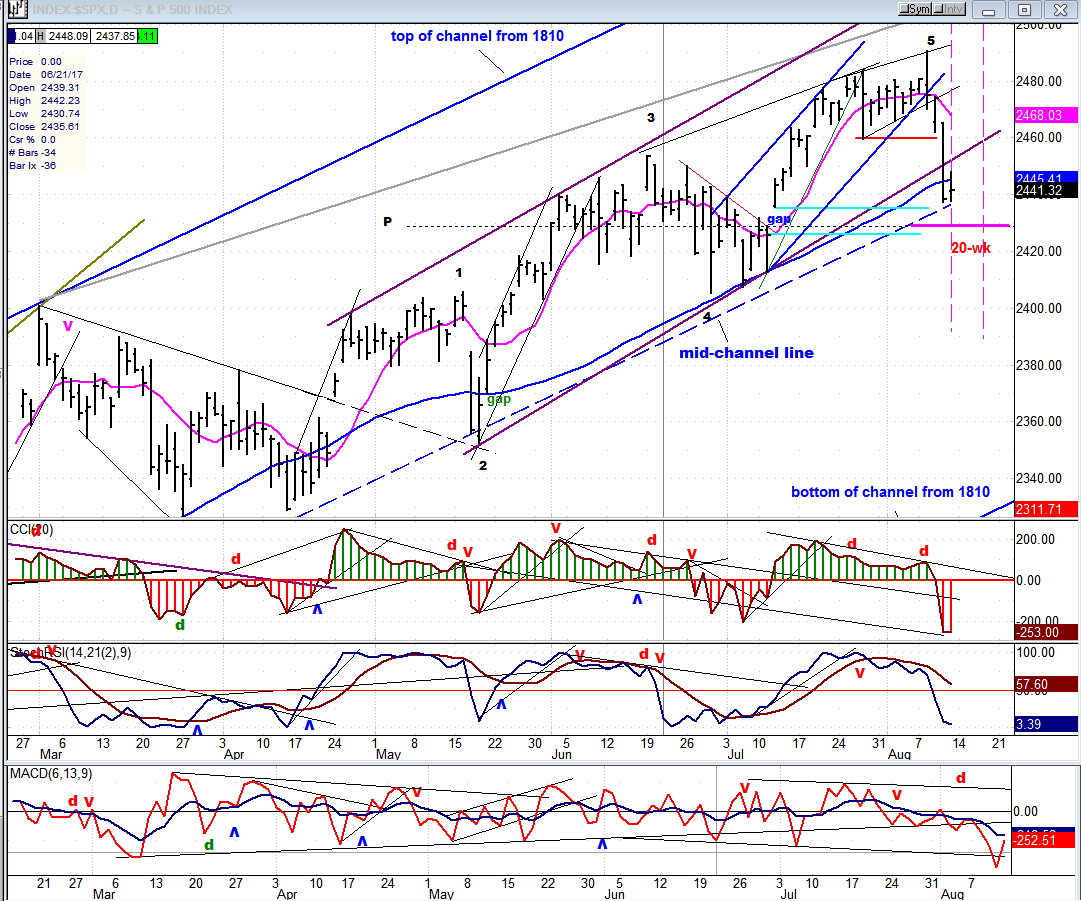
The chart below focuses on the last phase of a larger pattern -- itself only a portion of the bull market -- which started at 1810, and is contained within the blue channel lines. The phase just completed formed a smaller channel whose bottom line followed the (dashed) mid-channel line of the larger channel, as well as the (blue) 55-DMA very closely.
This last phase is not the final wave of that larger pattern. But, as I pointed out last week, its fifth wave shows deceleration not only from its inception at 2323, but by the way it had traded over the past two weeks i.e. in a narrow range, that suggested that the previous high of 2484 might turn out to be the final high. However, as is often the case, the entire formation ended in a small price climax to 2491 which turned around as fast as it got there, and kept on going! I had mentioned earlier that if we continued the uptrend to within a few days of the 20-wk cycle’s estimated low point, this would be precisely the resulting benavior of the bottoming cycle.
As you can see, the index has broken the lower line of the small channel and has come to rest on the (dashed) mid-channel line of the larger channel which had been providing support for every retracement since mid-March. But this is expected to be only temporary, with a clear penetration of the line taking place over the next few days as we close the gap which was created when wave 5 got underway.
Unlike the A/D oscillator at the bottom of the chart, which had turned negative almost a month ago and remained so for the duration of the final topping formation, the momentum indicators waited until the last minute to give a confirmed sell signal; although they had previously shown negative divergence and had started to decline.
Hourly Chart
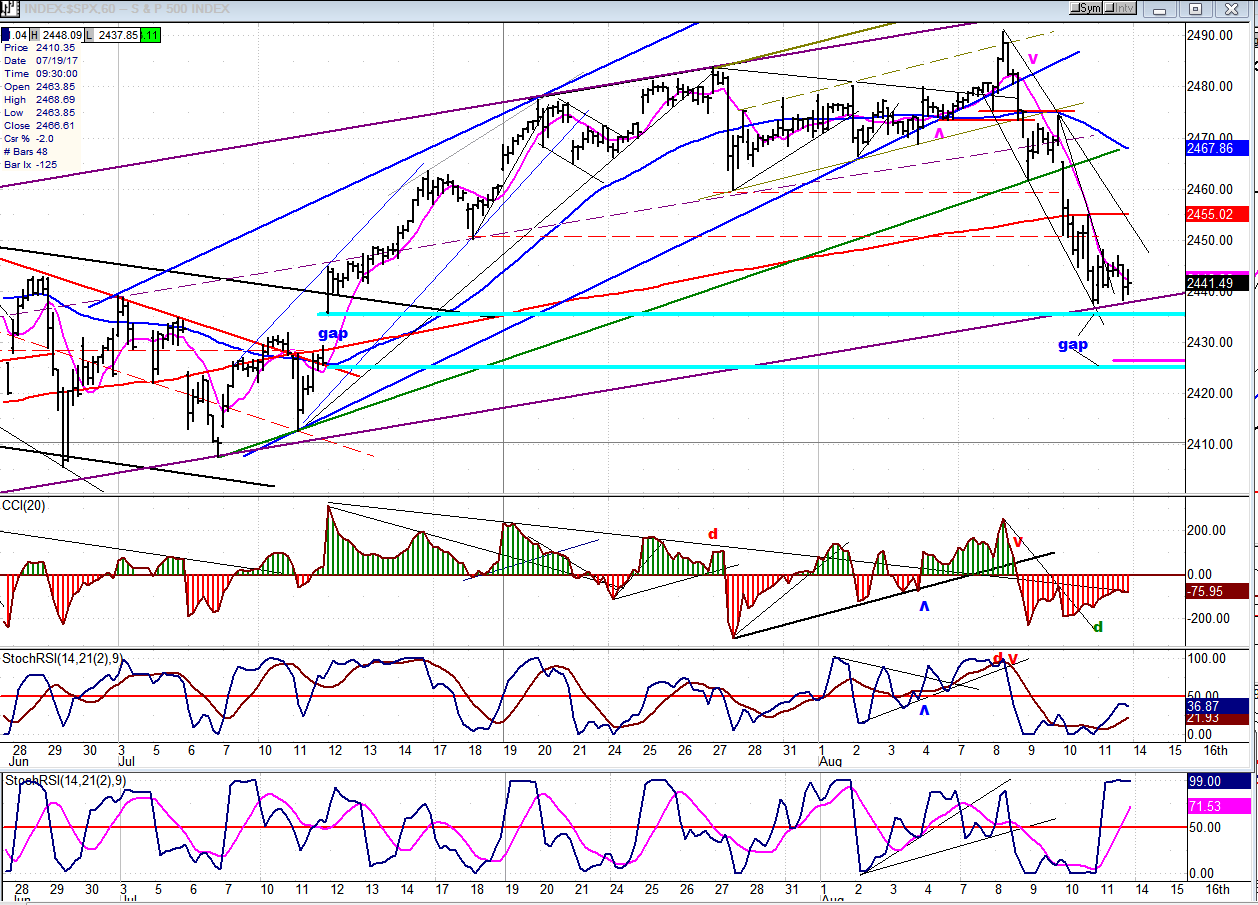
A scrutiny of both daily and hourly charts is very helpful for arriving at analytic clarity. With the hourly chart, we can magnify the action of the index and make it easier to comprehend. In this instance, we can put the final stages of wave 5 under the microscope to see how transparent the terminal pattern was. It crawled along the bottom channel line and finished in a mini-climax, followed by an instantaneous reversal. That sent a clear signal that the end of the move had arrived.
I have often mentioned that parallel trend lines -- especially when those trend lines first connect consecutive tops -- very often offer support points which can halt a move for a little while, and perhaps even longer, when they become the opposite channel line. On this chart, we have an example of this. The purple line connects he tops of waves 3 and 5, with its parallel drawn at the start of wave 5. This created a line which acted as a temporary support line for the decline, just above the top of the gap (which is also often a support point). If my analysis is correct, it will be penetrated next week, as what remains on the cycle pressure fills the gap.
Comparing the position of the hourly indicators with that of the daily is also beneficial. The sell signal given by hourly indicators at a time when the daily ones have already shown negative divergence and started to turn can pin-point the exact beginning of a larger decline, as it did in this case.
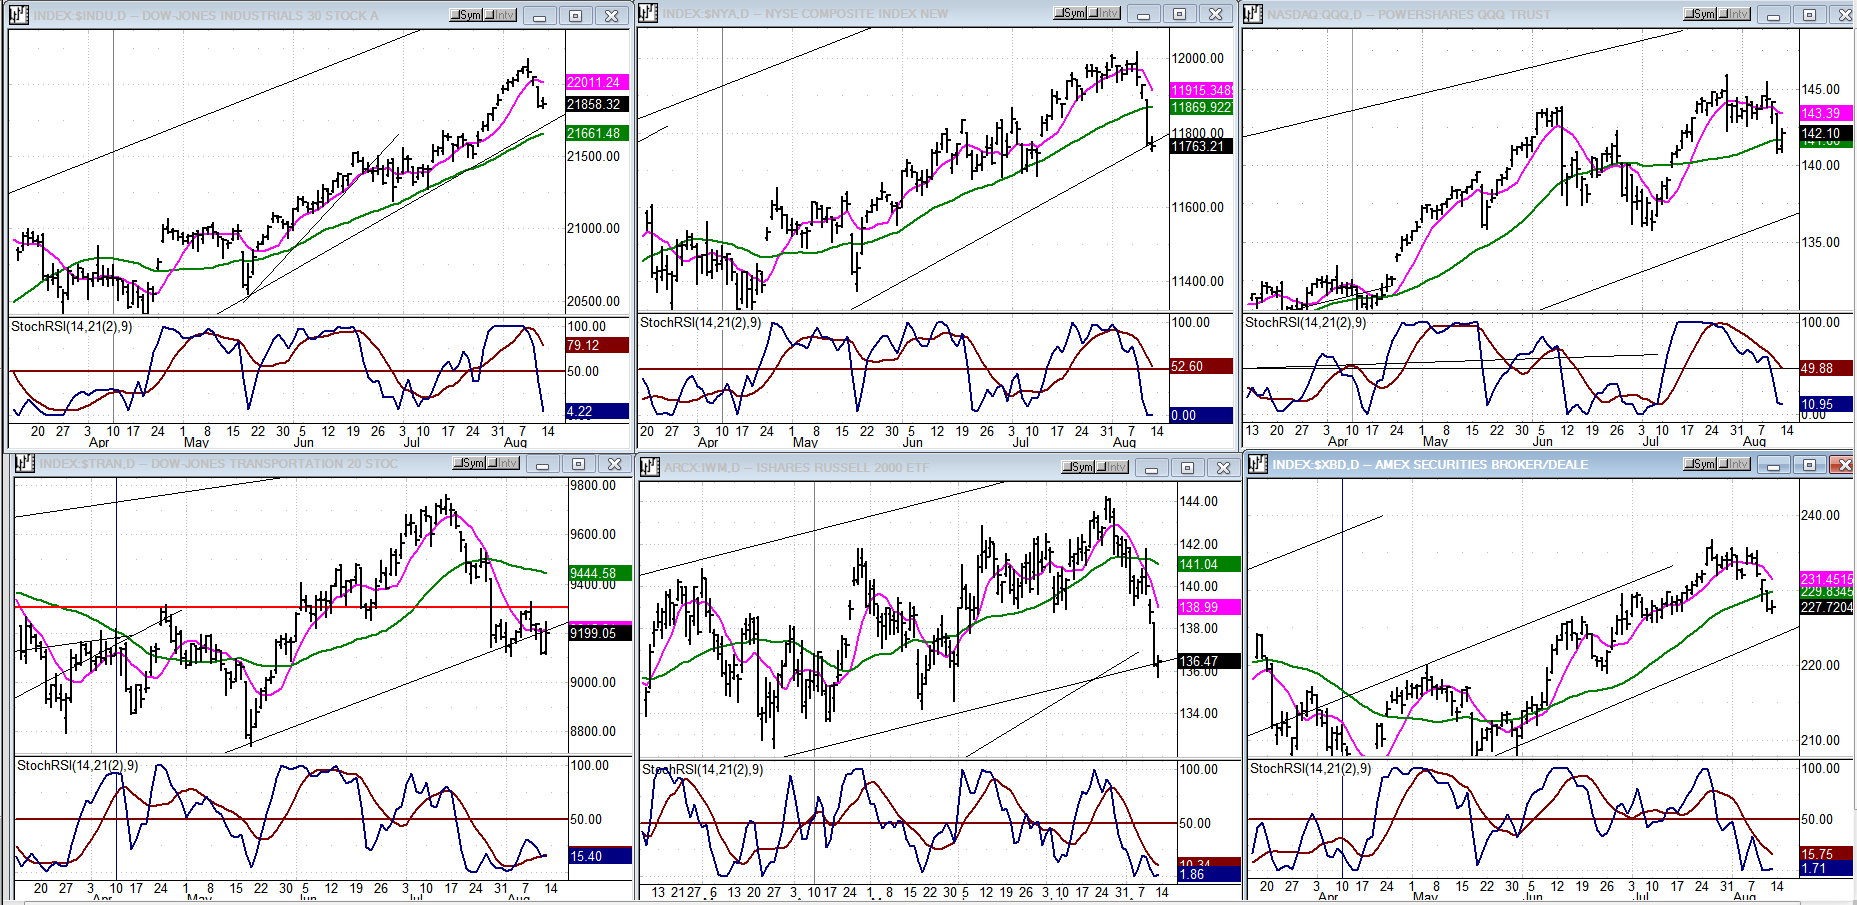
An Overview Of Some Important Indexes (Daily Charts)
All the indexes below are participating in the correction, with the usual leaders TRAN and IWM (bottom left and center) having anticipated the top by at least a week. Even the DJIA is condescending that a correction is underway and probably just starting. But this will have to be confirmed by their future behaviors. After the bottoming of the 20-wk cycle, we should see an attempt at price stabilization, but with no genuine strength returning if we are to continue this correction until October.
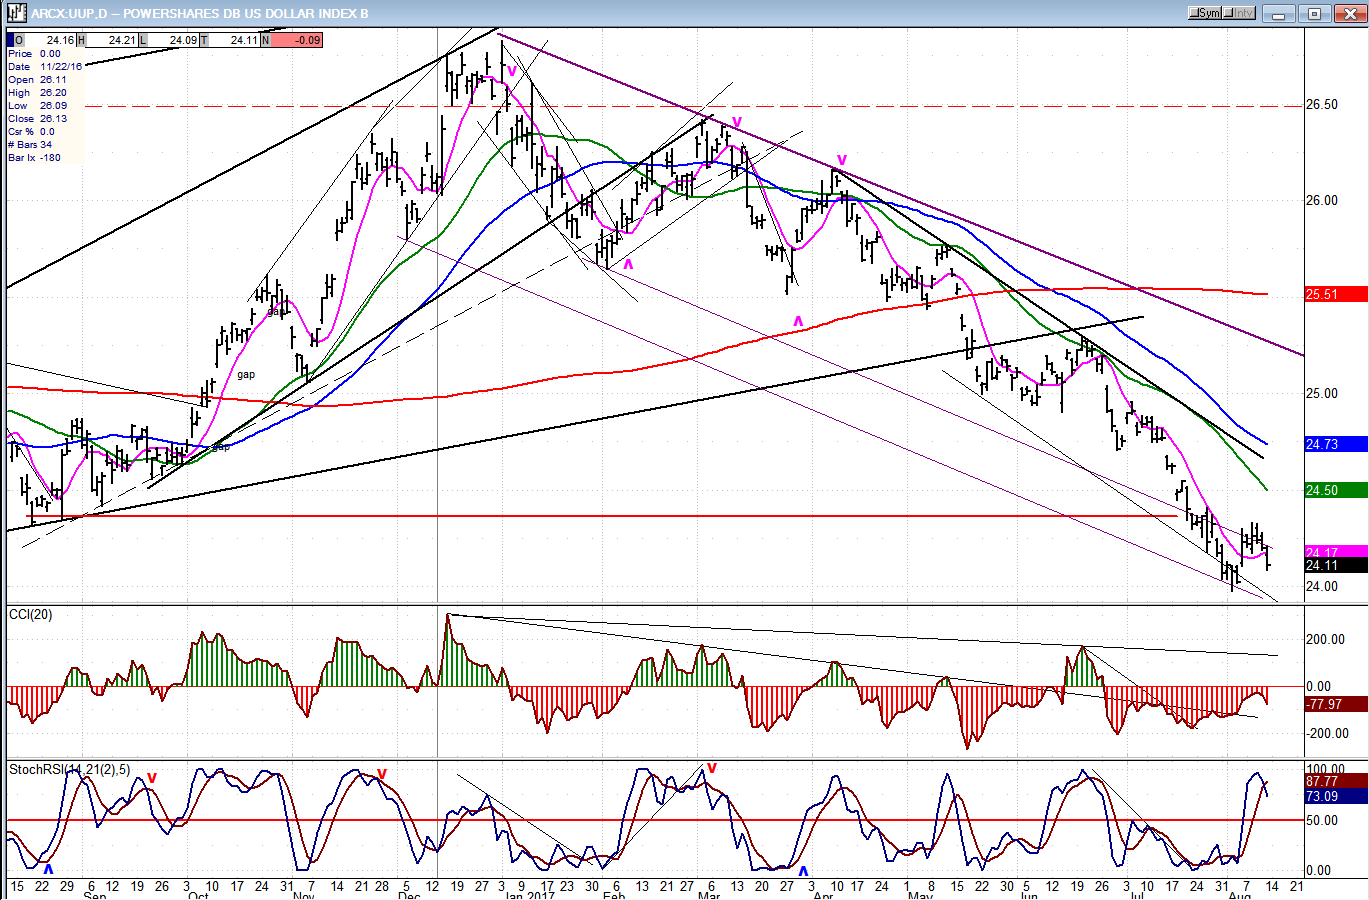
UUP (Dollar ETF)
UUP is engaged in a serious correction which could turn out to be long-term in nature. Last week’s attempt at reversing may already have failed. More likely, the index is re-testing its low and will build a base from which it can retrace some of its downward path. No real strength can be expected immediately after this display of weakness, but an oversold rally to about 25 is possible.
GDX (Gold Miners ETF)
GDX has responded bullishly, first to the bottoming of its 9/10-week cycle, and then to that of the 25/28-day cycle, by creating an uptrend which appears to have a problem moving decisively beyond 23.00. This is more apparent on the hourly chart. There is still an opportunity to reach 23.50+ over the near-term, but lingering at this price level will result in delaying a more substantial uptrend until after the next 19-wk cycle has made its low.
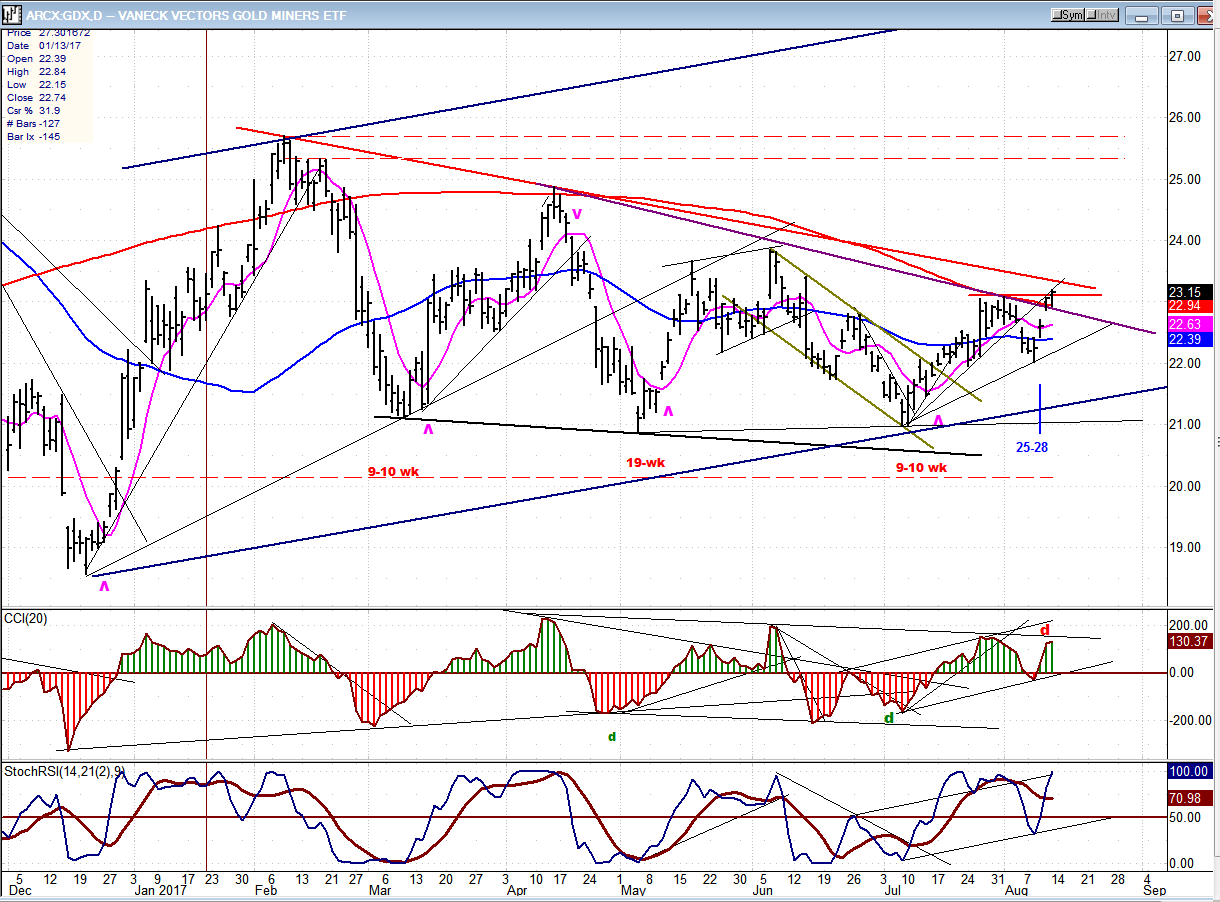
Note: GDX is now updated for subscribers throughout the day, along with SPX.
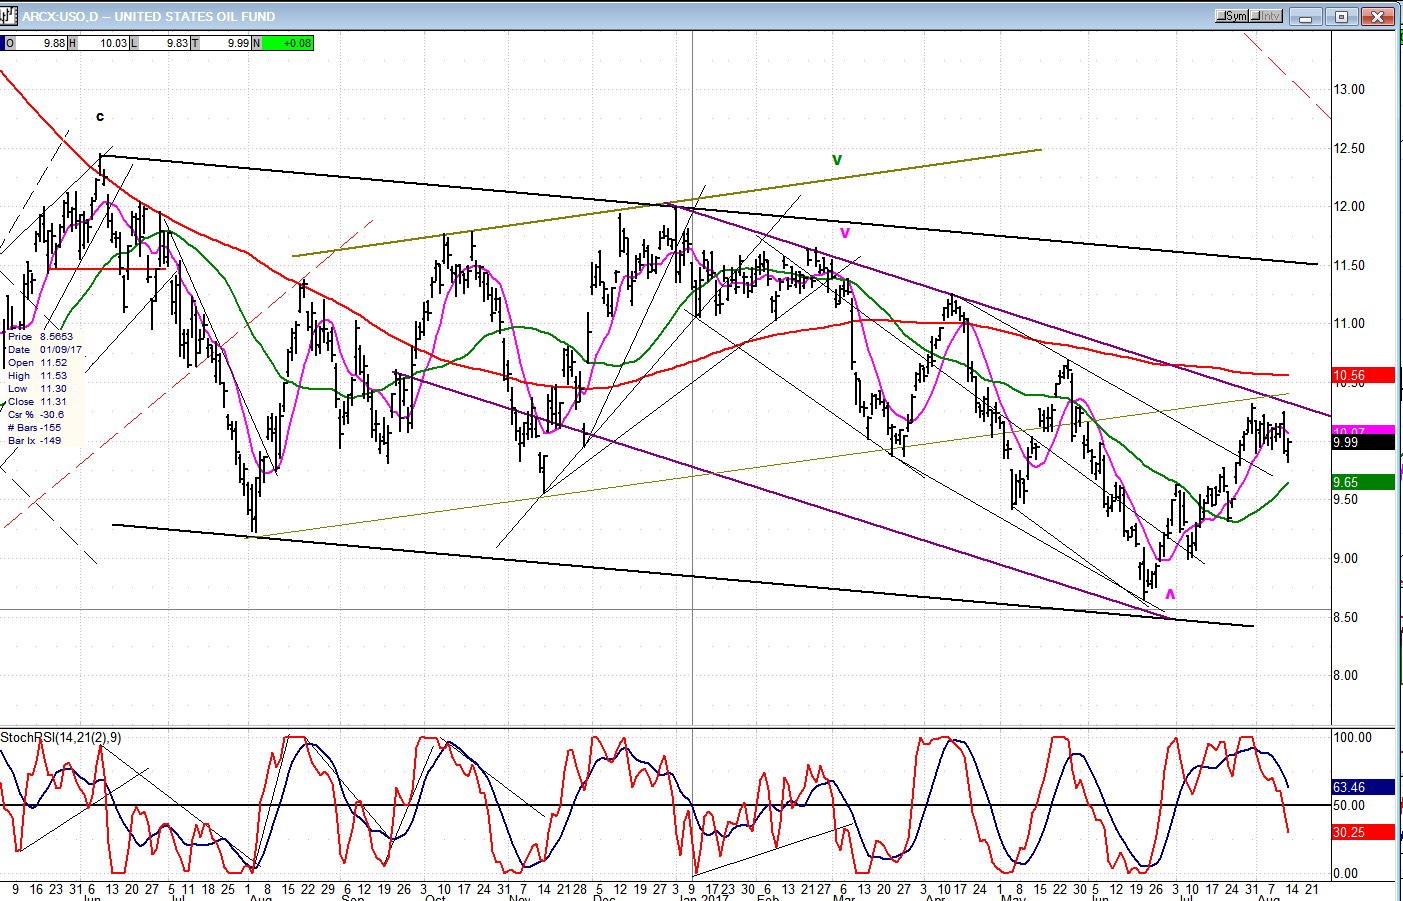
USO (United States Oil Fund)
USO has retraced to the top of its secondary corrective channel, and has stalled. We’ll see if it has enough interested buyers to push it through the top (purple) channel line right away, or if it needs to fall back a little more before doing so. Even if it were successful in rising above it and overcoming its (red) 233-MA, it would still be trading within the confines of its primary corrective channel. This means that any attempt at a genuine long-term trend reversal could still be weeks and months away.
Summary
SPX gave us plenty of warning that it was about to embark on an intermediate-term correction. As it usually does, it came suddenly and, as of Friday, the initial down-thrust is probably still incomplete and should continue into early next week when the low of the 20-wk cycle is due.
Since this is considered to be only a correction in a downtrend and nothing more significant, the most logical scenario would be for last week’s decline to be part of the “a” wave of a corrective pattern, with “b” to start next week. We’ll follow up with a projection for that rally in the next letter,fter a reversal of the initial decline has taken place.
********
For a FREE 4-week trial, send an email to [email protected], or go tand click on “subscribe”. There, you will also find subscription options, payment plans, weekly newsletters, and general information. By clicking on "Free Newsletter" you can get a preview of the latest newsletter which is normally posted on Sunday afternoon (unless it happens to be a 3-day weekend, in which case it could be posted on Monday).
The above comments and those made in the daily updates and the Market Summary about the financial markets are based purely on what I consider to be sound technical analysis principles. They represent my own opinion and are not meant to be construed as trading or investment advice, but are offered as an analytical point of view which might be of interest to those who follow stock market cycles and technical analysis.

When Andre Gratian was a stock broker years ago, a friend introduced him to technical analysis of the market. Consequently, it is not an exaggeration to say that Andre fell in love with this approach! Ever since then, it has become an increasingly important part of his professional life. Gratian has studied the works of Wyckoff, Edwards & Magee, Edward J. Dewey (cycles) and many others. However, one of my most profitable undertaking has probably been to study Point & Figure charting, which he finds invaluable in analyzing stocks and indices. If he were restricted to one methodology, this is the one that he would choose. This well-rounded background has given him what he feels to be a special insight into the stock market, facilitating the recognition of meaningful patterns and the ‘turning points’ in all trends, whether they be short or long term. Andre feels very comfortable discussing the stock market and passing on meaningful information to others. His subscribers include individuals and money managers throughout the world. Moreover, his Newsletters are currently published on several financial sites, here and abroad.


