Technical Analysis Of The Markets


Current Position of the Market
SPX Long-term trend: The uptrend should continue after pausing for a correction.
SPX Intermediate trend: SPX could make a new high before continuing its correcting into October/November.
Analysis of the short-term trend is done on a daily-basis with the help of hourly charts. It is an important adjunct to the analysis of daily and weekly charts which discuss longer market trends.
Keeping Us Guessing
Market Overview
Until last week, analysis was relatively simple: SPX had made a top at 2491 which represented an intermediate peak. Since we are now in the decennial pattern ending in 7, and approaching October, the most bearish possible historical period for the stock market, it is easy to assume that an intermediate correction is taking place with the next low in October/November. The favored pattern for a correction is A-B-C, and we could count wave A as bottoming at 2427, with wave B now in progress headed for ???. A likely possibility, based on the primary congestion pattern created between 2440-45, is 2480/85. But if the count is taken across the entire pattern, it takes us up to 2505! There is also another way to count the base which yields 2507. So, with last week’s strength, the index has created enough uncertainty that we will have to let it tell us which of the two counts it wants to choose. Whatever the result, continuing to correct into October/November is more than probable. It’s only a question of whether the index will make a new high, first.
As mentioned to subscribers, there is a 6-wk cycle bottoming early next week which should give us a minor correction. The closing action on Friday suggested that the bottoming action had already started, and since the index waited until it printed 2480 to start correcting, it is going to make our analysis less complicated. If, after this minor correction, we go to 2485 and turn down sharply, we can be fairly certain that the B-wave has ended. However, if we keep going, then we will need to hold off and see if the second option is in play. More than often, Fibonacci counts and P&F counts are nearly identical. Since 2488 is the most “logical” extreme that can be attributed to the B-wave, that should be the red line in the sand (to use a cliché) for the B-wave.
We’ll discuss what the indicators are saying in the chart analysis section.
Analysis: (These Charts and subsequent ones courtesy of QCharts.com)
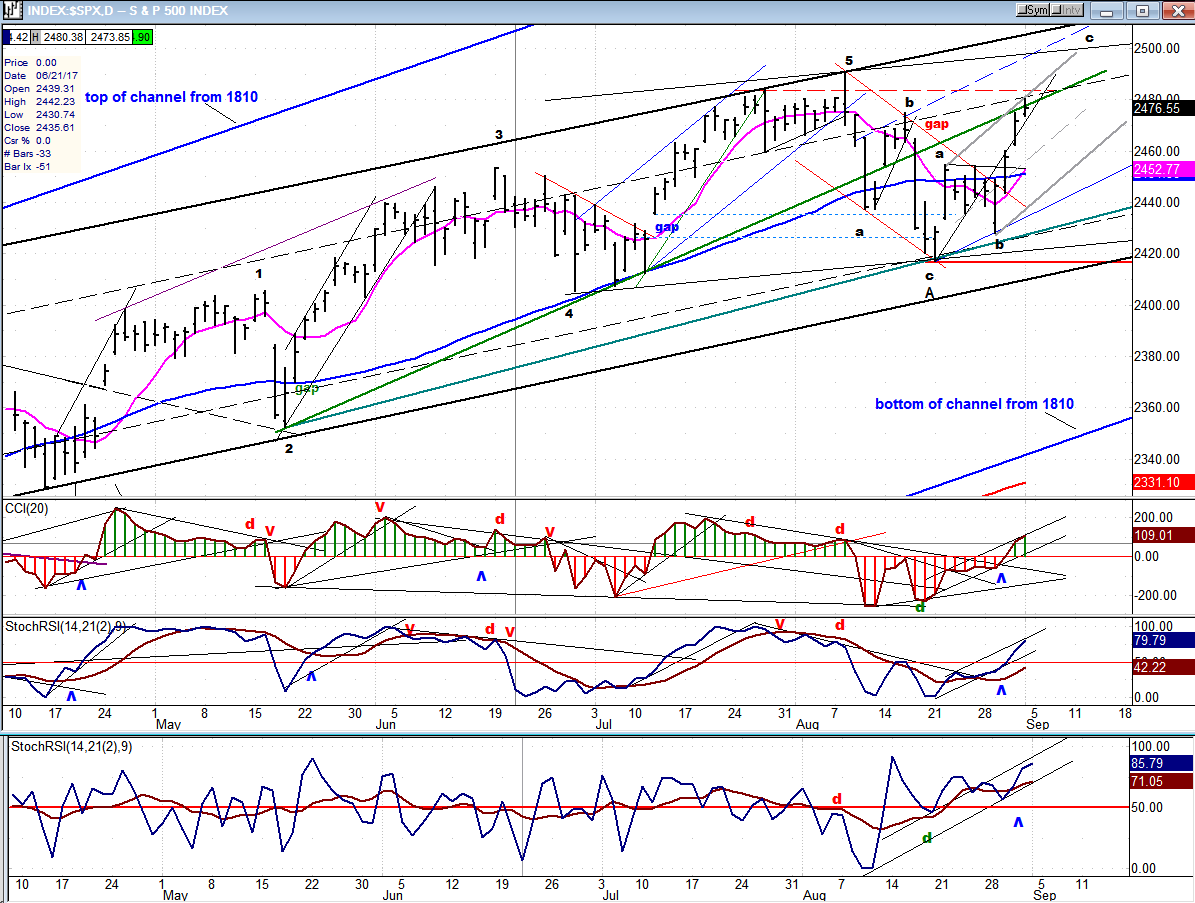
Daily Chart
Last week’s strength has the bears fretting -- and for good reasons! At the risk of showing my EWT ignorance, I believe there is no reason why, in a strong market, wave B cannot rise above the former top before reversing ias wave C, and this is what last week’s strength might imply. In fact, while the logical length of wave “c” of B should be either 1.38 or 1.62 of wave “a”, (2480-2488), if it extended to a full 100% of wave “a”, that would take it to 2404! And since that closely corresponds to the larger P&F counts I mentioned above, there are grounds to be concerned if you are short.
This dove-tails into another reason to fret: the daily momentum indicators had remained negative until last week, although the A/D oscillator had turned positive and remained positive during and after the bottoming of wave A, something I should not have ignored even though the momentum oscillators had remained negative. However, last week, they also turned positive. So, in order to return to a neutral/negative stance in the indicators, we will have to get enough of a pull-back into early next week as the 6-wk cycle makes it low. But in an uptrend, that cycle does not have an historical pattern of causing much weakness. Nor is there very much congestion at the 2480 top. In fact, there is precious little. Based on that pattern, the most we might expect of this pull-back is 2465, while a .382 retracement of the entire rally could take us back down to 2460. And we cannot even assume that either of these two targets will be reached.
In any case, if we cannot develop a lot of weakness from 2480, we should look for a potential extension to 2485-88 when the rally resumes, with the likelihood of going even higher if SPX does not come to a screeching halt around those levels.
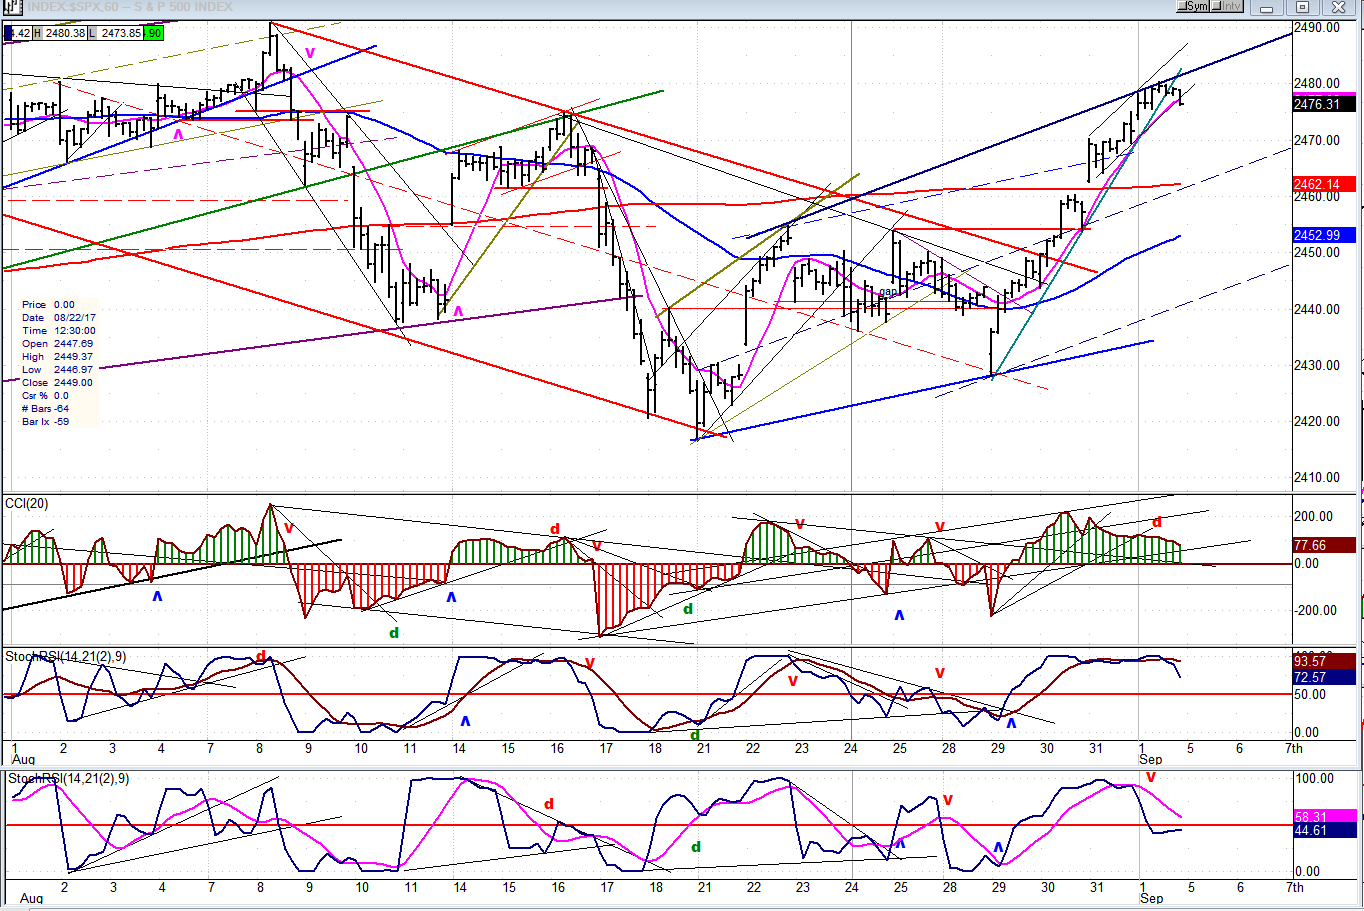
Hourly Chart
The strength in the rally first made itself known when it went past its (red) 233 MA and kept going. That occurred at the same time as it rose sharply above the top line of the light blue channel. If prices turn down from here, they will have formed a new, steeper channel which demonstrates the accelerated upside momentum. And if they fail to fall back below the mid-channel line and the red MA immediately, it will be a sign of continued strength which will enhance the prospects for additional gains.
Note also, that the oscillators have not yet given a sell signal, and if this pull-back fails to bring one this, added to the strength in the daily indicators will be another proof of continued market strength .
But when all is said and done, the real test is whether we can exceed the 2488 level. We should know next week, but should not be too surprised at this strong showing. After all, the 40-wk cycle only made its low about two weeks ago, and it could resist being pulled down into the “Fall” a bit longer!
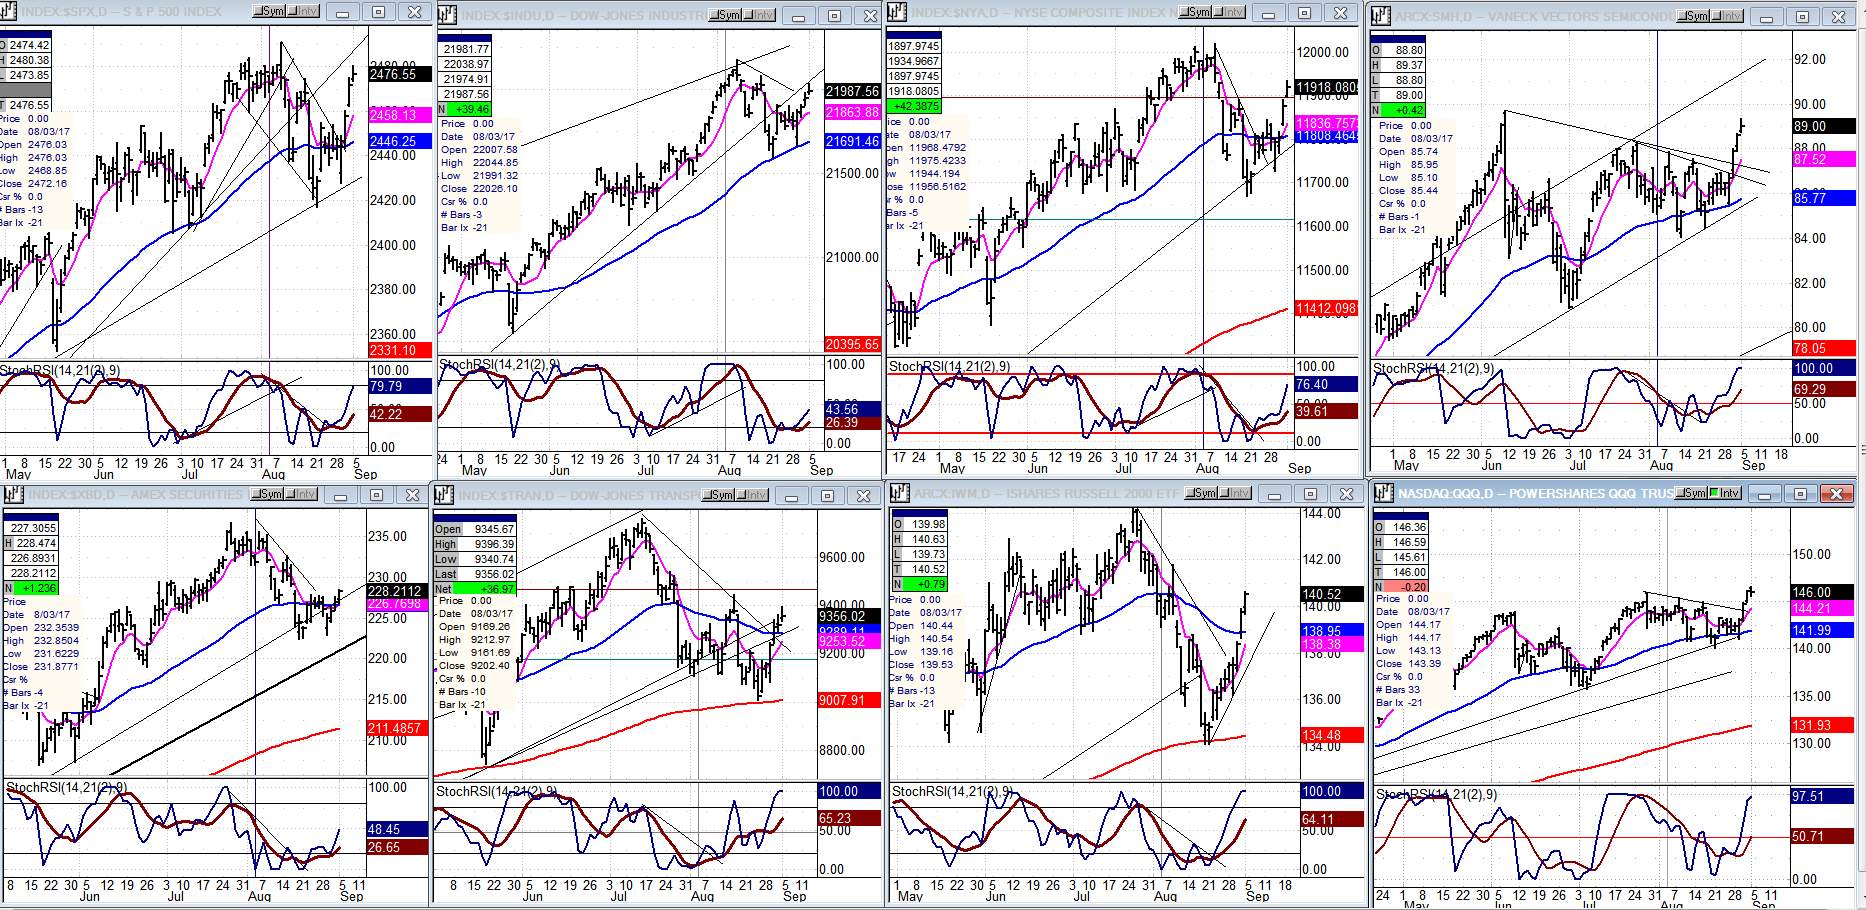
An Overview Of Some Important Indexes (Daily Charts)
All of the following indexes participated in the rally, but some more than others. Notable for their reluctance to do so are XBD and TRAN (bottom left), both important leading indicators. QQQ (bottom right) made a new high, but its P&F chart suggests that it may quit after touching 147. And the DJIA (second from left, top row) was not as strong as SPX (first chart on the left, top row). Overall, it is a mixed performance reflecting a lack of coherence which will require a little more time to see if the strong brings up the weak, or if the weak rein in the strong.
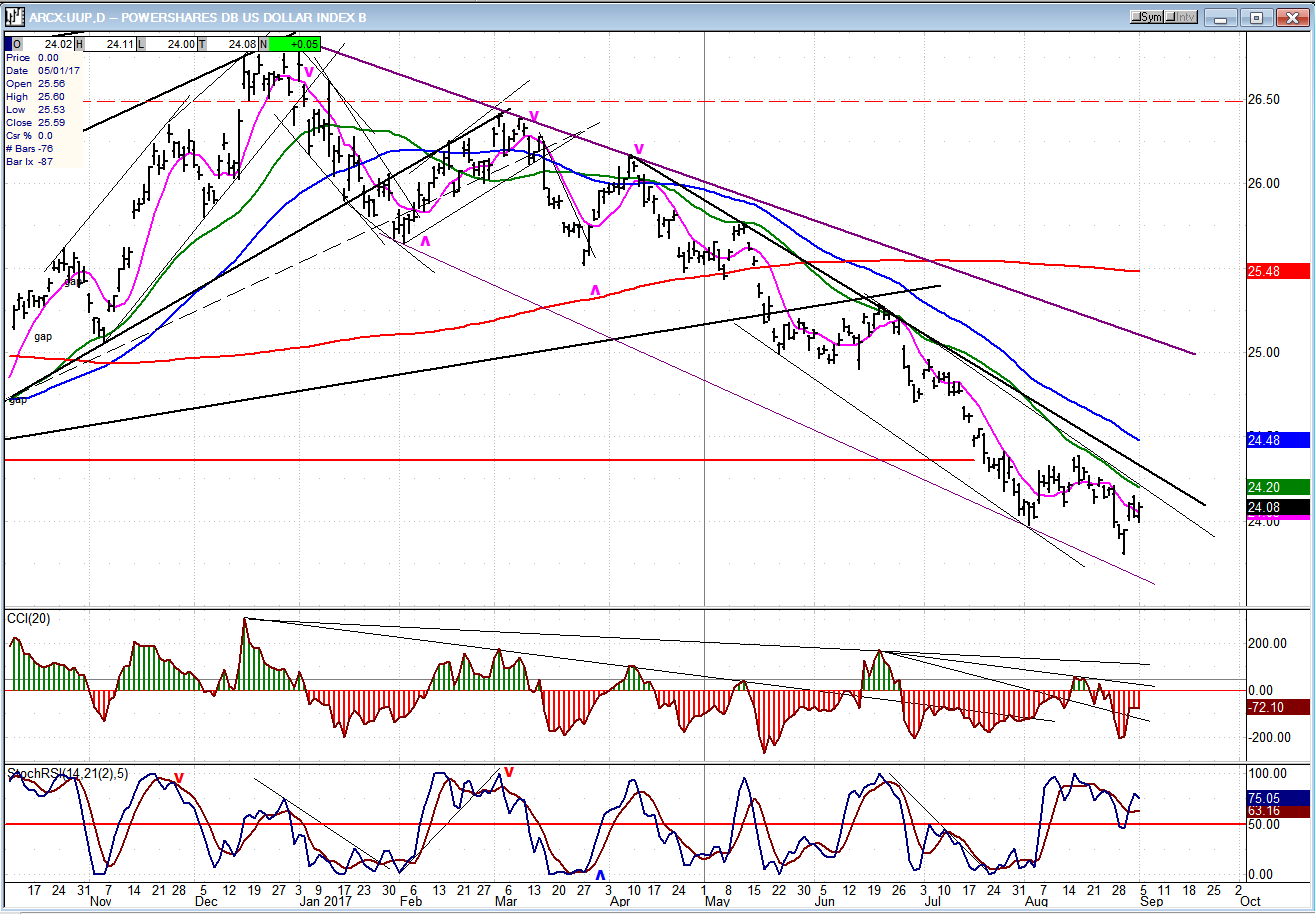
UUP (Dollar ETF)
UUP must prove that it has found more than a temporary low.
GDX (Gold Miners ETF)
The gold miners are looking much more bullish since they were able to overcome resistance at 23. They look as if they are ready to make a new intermediate high after pulling back into the cycle lows which are due around the middle of the month.
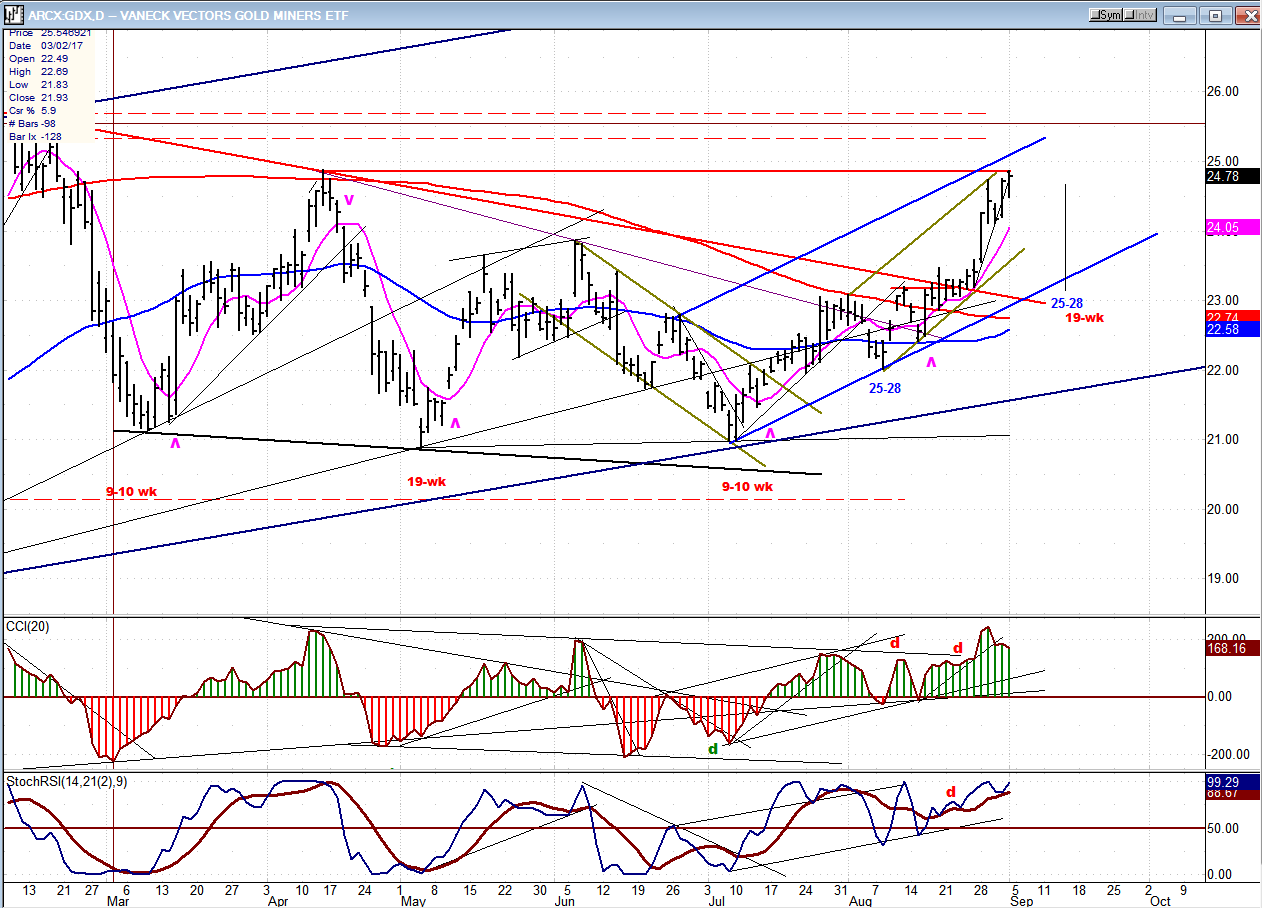
Note: GDX is now updated for subscribers throughout the day, along with SPX.
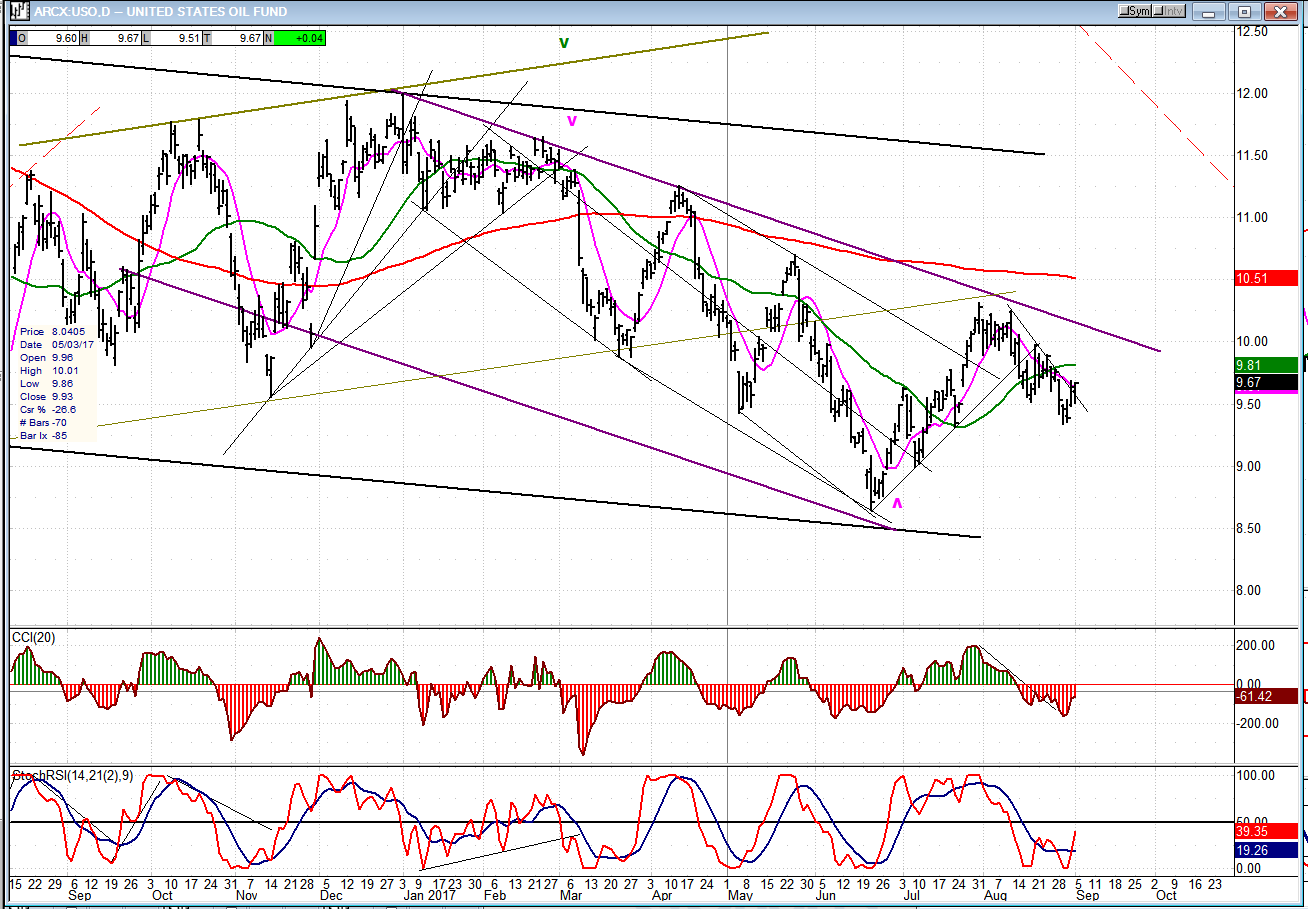
USO (United States Oil Fund)
USO has backed off a little more instead of rising to challenge its secondary downtrend line. Since no divergence is showing in the oscillators, it may not be through with its correction.
Summary
Next week SPX must decide if it ends its rally at the current level, goes a little higher first, or continues all the way to 2500+, which has remained an unfilled projection made long ago.
********
For a FREE 4-week trial, send an email to [email protected], or go to (and click on) “subscribe”. There, you will also find subscription options, payment plans, weekly newsletters, and general information. By clicking on "Free Newsletter" you can get a preview of the latest newsletter which is normally posted on Sunday afternoon (unless it happens to be a 3-day weekend, in which case it could be posted on Monday).
The above comments and those made in the daily updates and the Market Summary about the financial markets are based purely on what I consider to be sound technical analysis principles. They represent my own opinion and are not meant to be construed as trading or investment advice, but are offered as an analytical point of view which might be of interest to those who follow stock market cycles and technical analysis.

When Andre Gratian was a stock broker years ago, a friend introduced him to technical analysis of the market. Consequently, it is not an exaggeration to say that Andre fell in love with this approach! Ever since then, it has become an increasingly important part of his professional life. Gratian has studied the works of Wyckoff, Edwards & Magee, Edward J. Dewey (cycles) and many others. However, one of my most profitable undertaking has probably been to study Point & Figure charting, which he finds invaluable in analyzing stocks and indices. If he were restricted to one methodology, this is the one that he would choose. This well-rounded background has given him what he feels to be a special insight into the stock market, facilitating the recognition of meaningful patterns and the ‘turning points’ in all trends, whether they be short or long term. Andre feels very comfortable discussing the stock market and passing on meaningful information to others. His subscribers include individuals and money managers throughout the world. Moreover, his Newsletters are currently published on several financial sites, here and abroad.


