Technical Analysis Of The Markets


Current position of the market
SPX: Long-term trend – The bull market is continuing with no sign of a major top in sight.
Intermediate trend – Soon coming to an end.
Analysis of the short-term trend is done on a daily basis with the help of hourly charts. It is an important adjunct to the analysis of daily and weekly charts which discusses the course of longer market trends.
Another Minor Top?
Market Overview
Last week’s projected minor top was very brief and shallow, and quickly followed by a 47-point rally to a new high. So far, the upside projections have worked well and have been spot on! This now brings us to the next minor top which should precede a better correction, but not necessarily “the” intermediate correction that I now feel is not very far away.
All the anxiety about the seventh year of the decennial pattern has been for naught, so far, since the month of October is nearly over and the market is still making new highs. But the year is not over, and if October was a miss, the seventh year probably won’t be, and one should not become overconfident that the pattern will not repeat itself. There are enough signs that we are getting close to an intermediate top which has eluded us with deceitful projections, but this time, the evidence is compelling and cannot be ignored.
There is a minor cycle low due on Monday which should not bring too much weakness; but it could be enough to cause a small retracement which may be followed by another small rally before we get the next minor correction.
Chart Analysis (These charts and subsequent ones courtesy of QCharts)
SPX Daily Chart:
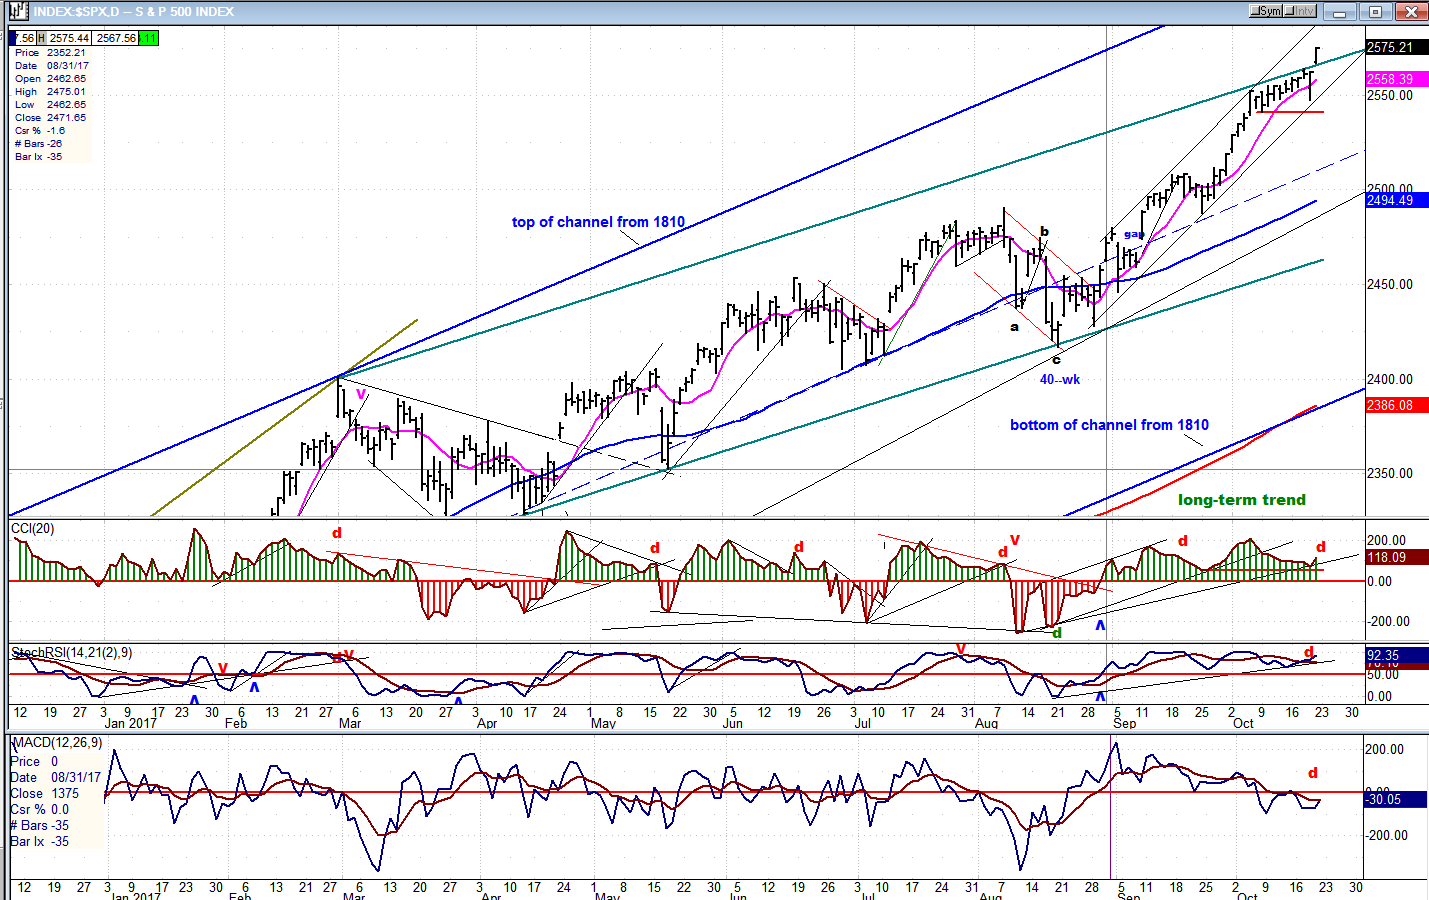
The uptrend which emerged from the 40-wk cycle low on August 21 has been straight up, even moving outside of the green channel last week, and continuing to remain well above the mid-major channel line from the 1810 low. Before moving above the top channel line, there were several days of deceleration which had formed a terminal pattern, but the correction which ensued was quickly bought by traders and, with the assistance on some renewed optimistic news about “tax reform”, the index tacked on enough points to pierce through the top.
That the market is overbought is an understatement. A quick move which exceeds the top of a channel is normally a sign that we are ready for a correction, and this is verifiable by a glance at the three oscillators at the bottom of the chart which all show negative divergence. There is also a P&F phase count whose minimum projection was already met when SPX touched 2474, on Friday, but which can extend a few points higher before we produce another minor top which should give us a better price retracement than previously, and last more than one day!
This time, we should break outside of the steep channel which started at the 40-wk cycle low. I won’t have a good feel for the extent of the correction until the top distribution pattern can be evaluated after the up-move is over. And, while the last low was determined by the six-week cycle, I am not sure of exactly what lies directly ahead cycle-wise -- perhaps a ten-week cycle low, although it does not have much of a reputation for clarity. But if we can get a good count from the top, we can be prepared for a reversal after it has been exhausted.
A .382 retracement would take us down to about 2521, and that’s always a good possibility. We’ll just have to see where the index finds support before making its next (and final) phase high.
SPX Hourly Chart:
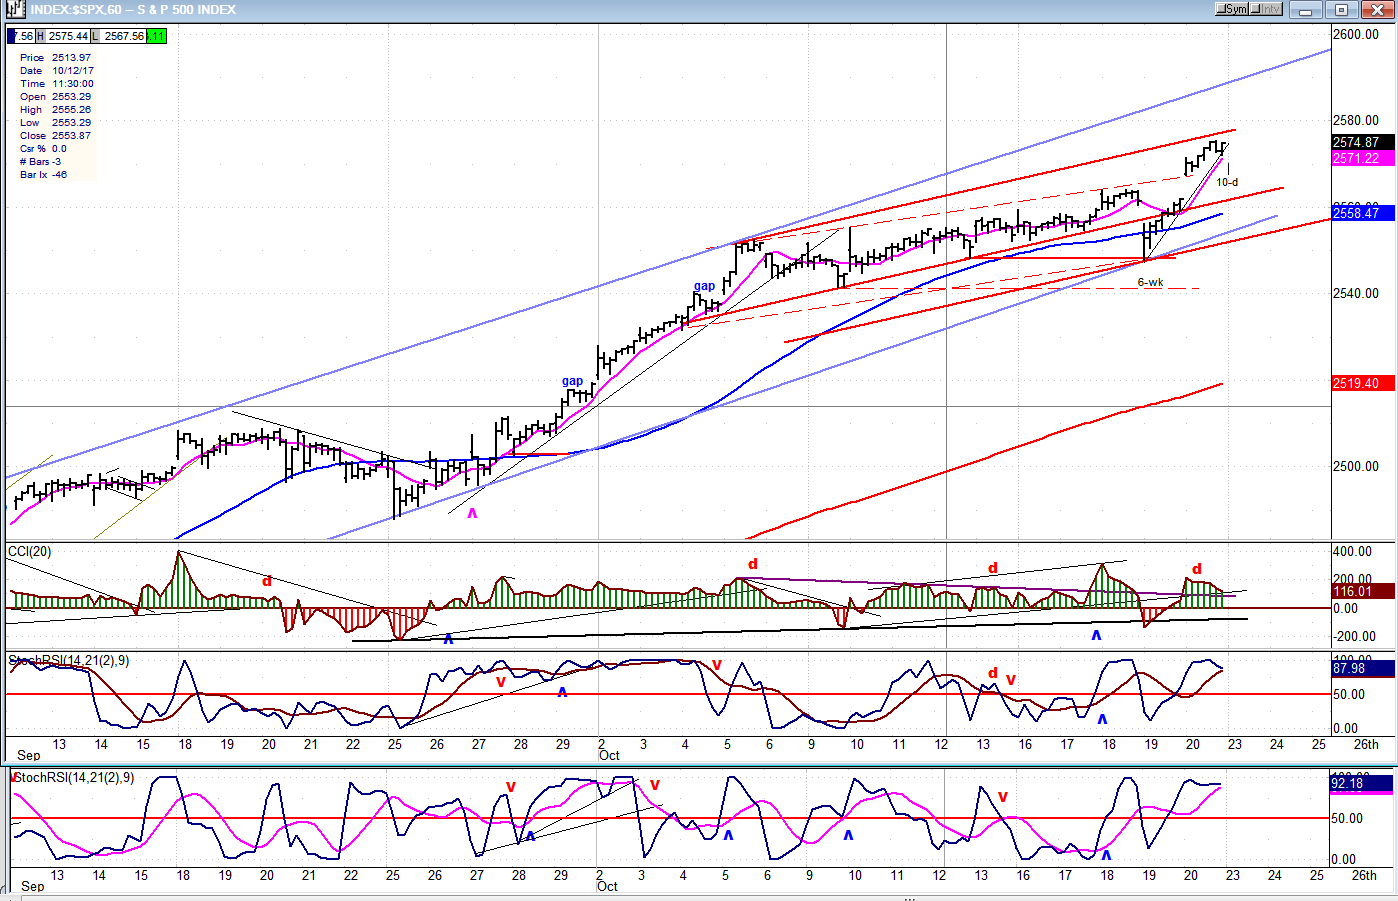
The blue channel is the same as the one which represents the steep move from the 40-wk cycle low. Here we can better see the deceleration which took place at the end of the move before the brief pull-back into the 6-wk cycle low. The deceleration pattern is encased in the red trend lines.
The 10-d cycle low should come at some time during Monday’s trading session and it is not expected to start anything significant on the downside. But if something does start, it should mean that we have already made our minor top after reaching the minimum projection target.
The 2540 level is a good support level, but stopping there on the next correction would seem inadequate. On the other hand, the .382 retracement level of 2521 looks exaggerated compared to what we have seen since the beginning of the uptrend. But it does correspond to where the 233-hr MA should be in a few days, so it may be a valid target.
All the oscillators on the hourly chart are at their highs and beginning to roll-over, so we could certainly start our correction from this level. The 10-day cycle may not be able to provide more than a short holding period after it bottoms, but since there is a slightly higher projection for this phase, let’s not completely ignore it.
An Overview Of Some Important Indexes (Daily Charts)
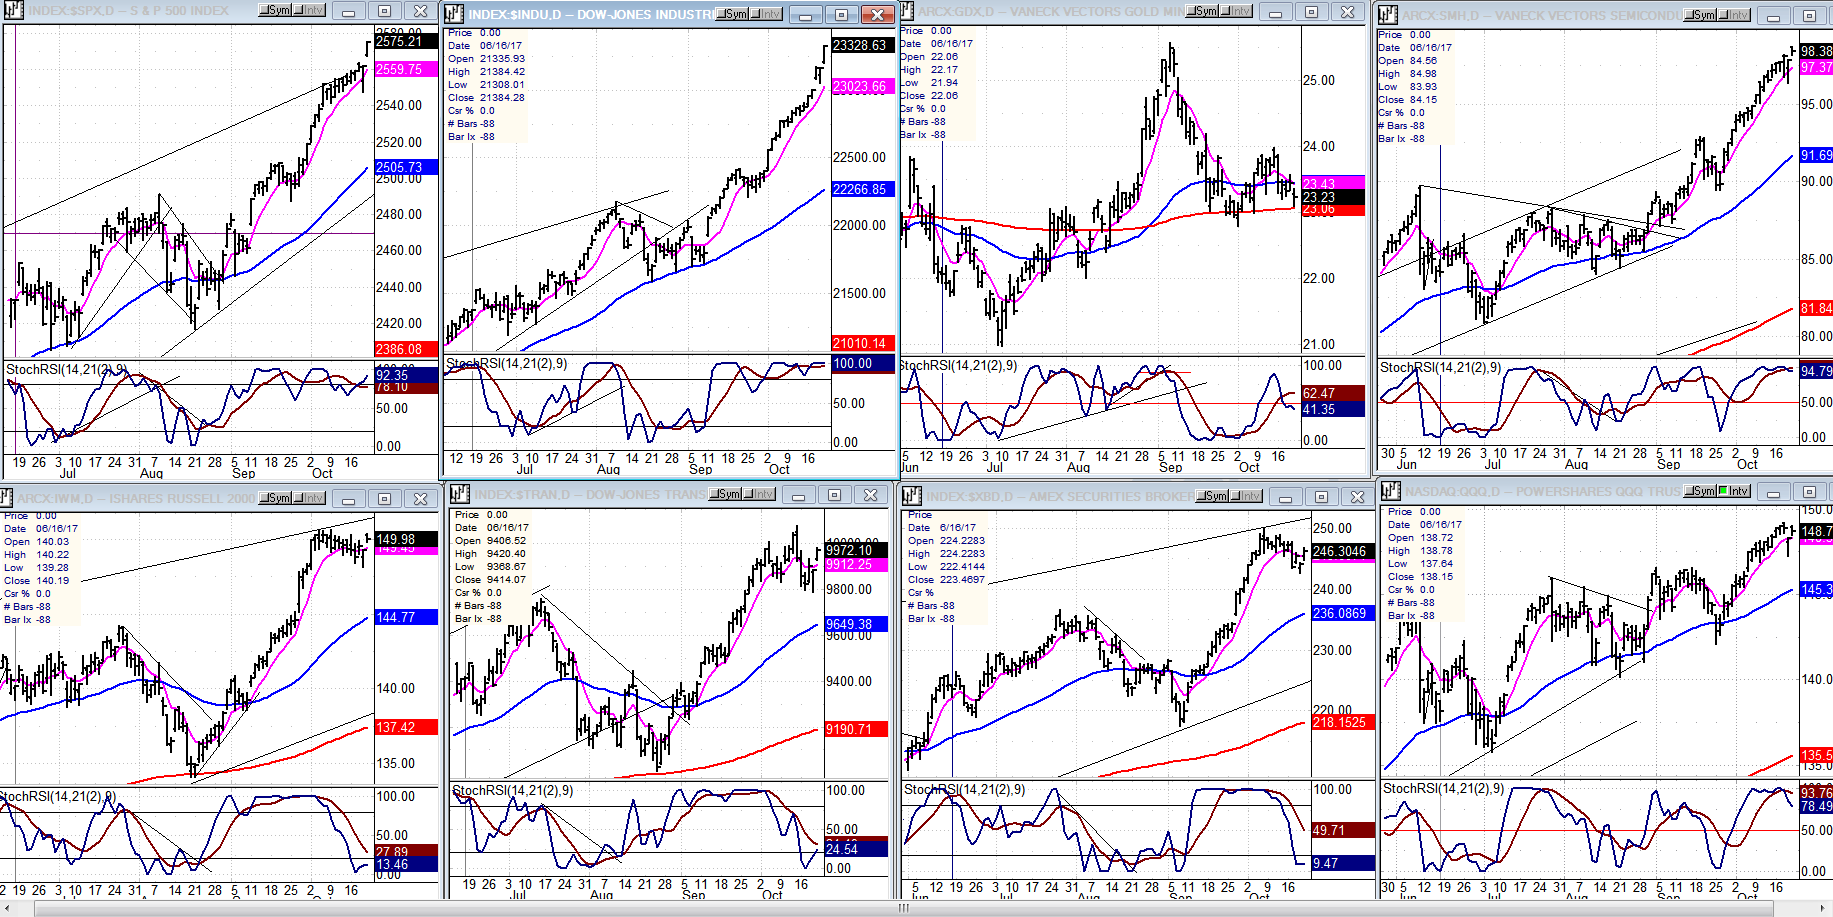
I have substituted GDX for NYA (third, top) to show how that index is faring against the overall market. On the bottom tier, the first three charts ( IWM, TRAN, and XBD) are clearly the leaders of the pack. They all agree that a topping formation is starting. QQQ (4th, bottom) is still affected primarily by AAPL and is a little less of a canary than the other three at this stage.
UUP (Dollar ETF)
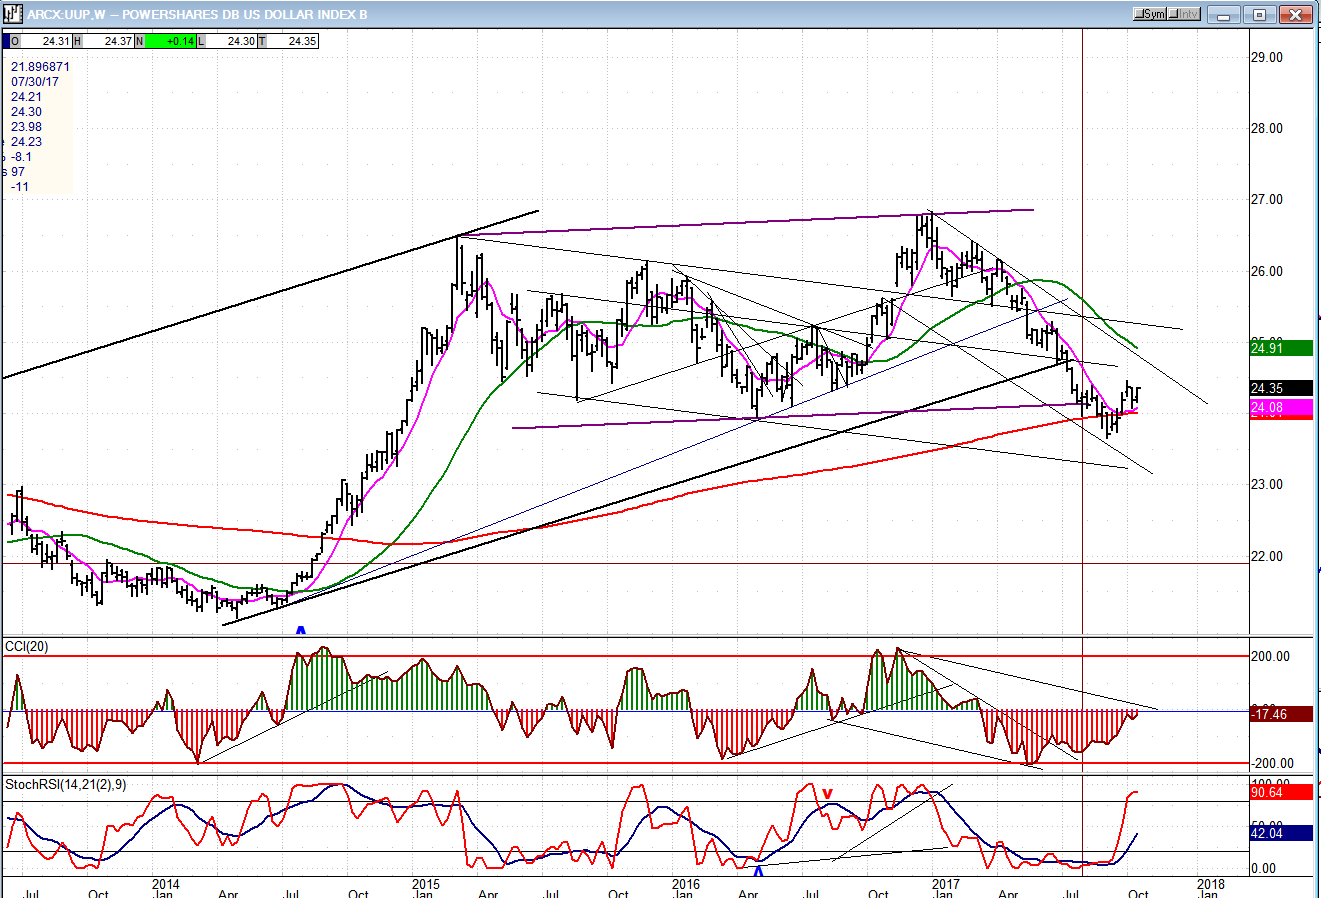
I have posted a weekly chart of the dollar to show what the longer term trend looks like. It’s a little less negative than the short-term, especially if UUP decides to consolidate in this general area. Note that it is in the downtrend provided by the thin down-channel and still has room to decline before finding support. But first, it could have a bit more of a rally to the shorter-term downtrend line.
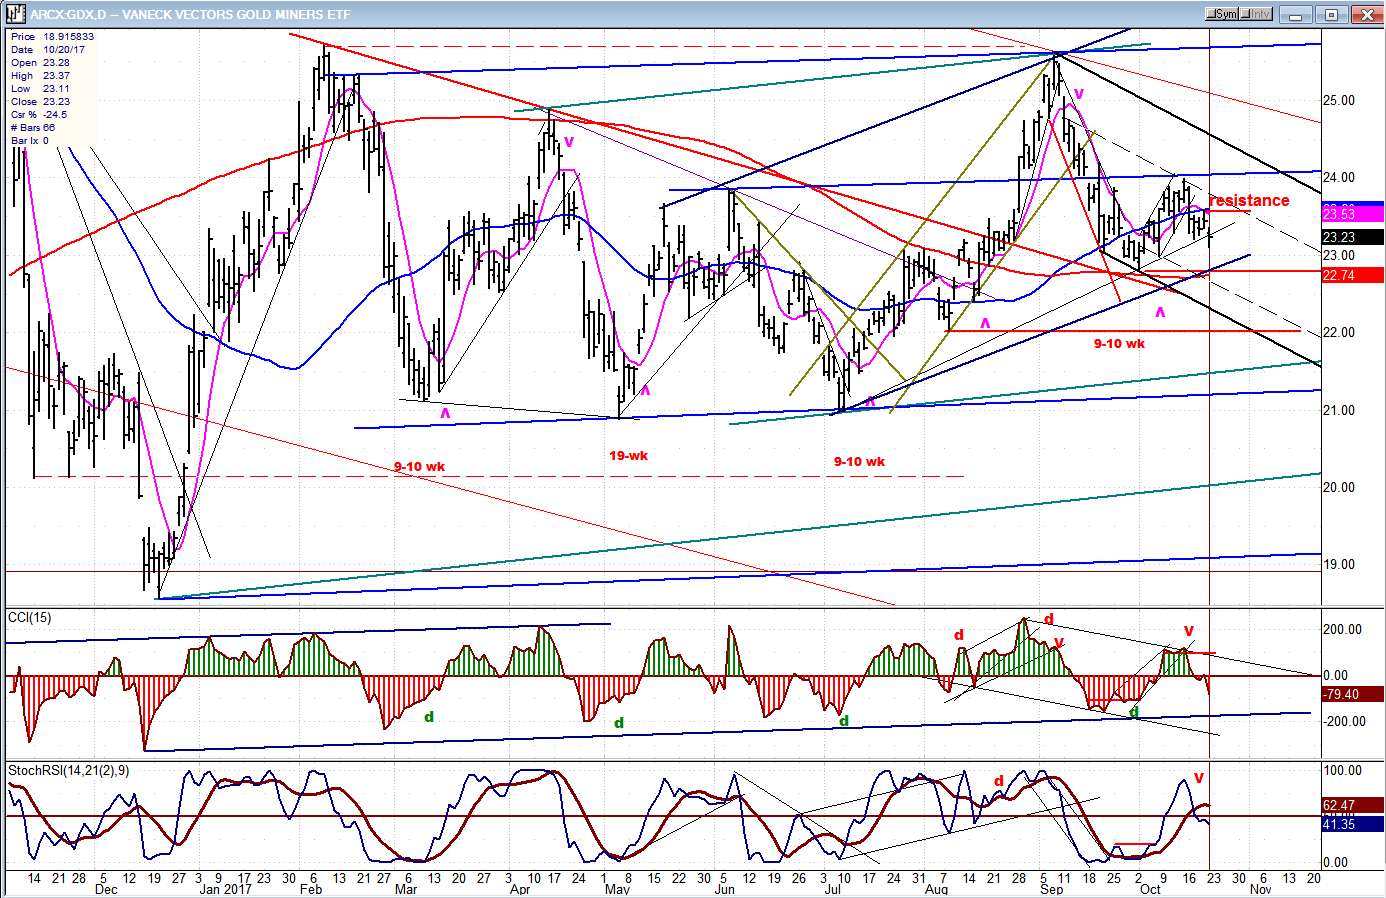
GDX (ETF For Gold)
I have drawn various channels which represent the various cycles currently influencing the price of GDX. They are all identified by different colors. As you can see, the longer-term trend is sideways, pressured by a 52-wk cycle due to make its low in (ca.) mid-December. Short term, the index is still correcting and will probably continue until that cycle has made its low. The target is most likely either the green or second higher blue line when it breaks out of the dark blue up-channel. To abrogate that prediction, it would have to rise above the second blue line from the top.
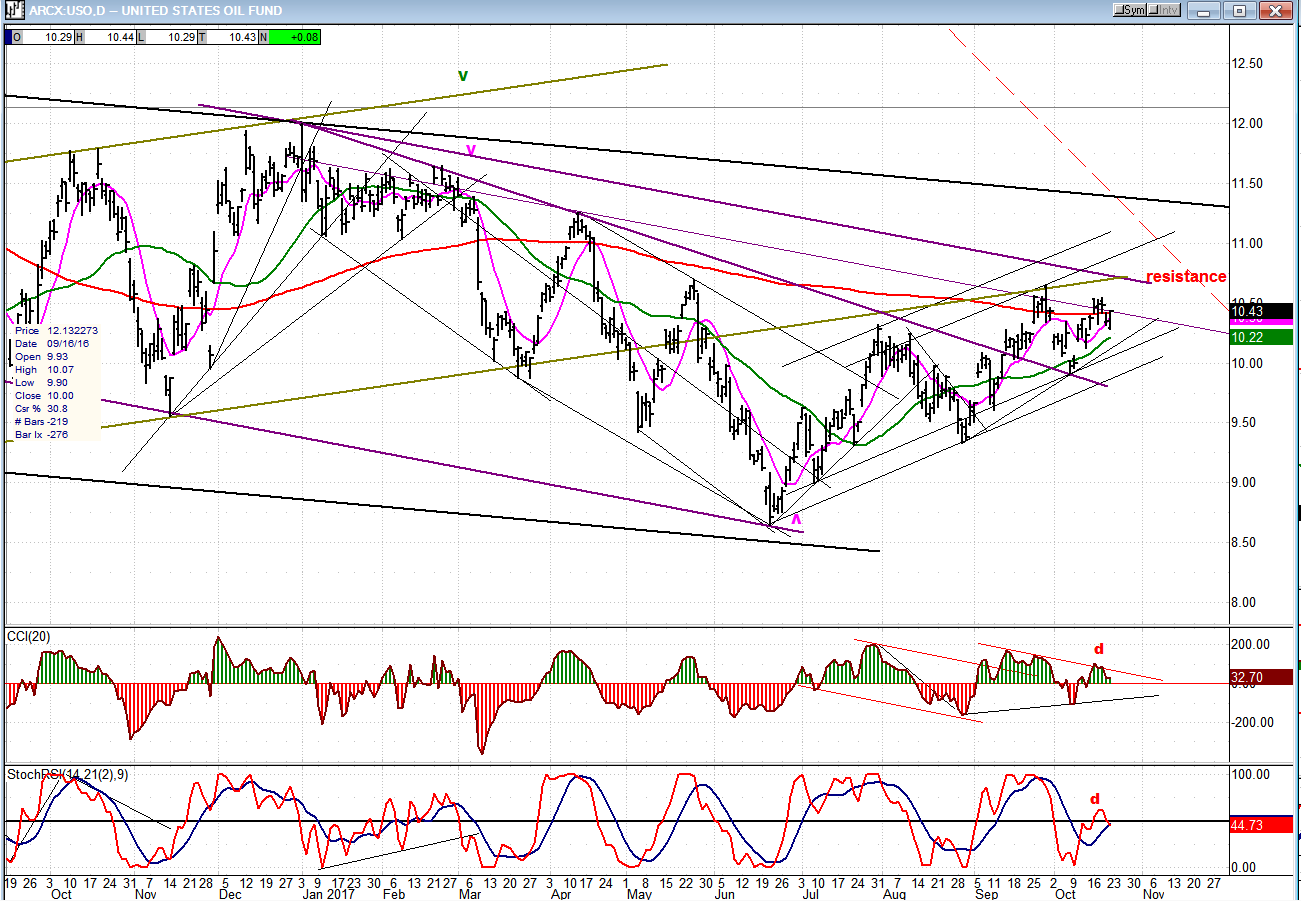
USO (United States Oil Fund)
USO is holding on to its gain, but has overhead resistance which could send it back into a decline unless it can clearly break above it. The next stop would then be the major correction channel top (black line).
Summary
We are getting close to an intermediate top, but not quite there, yet. Another minor top, followed by another minor correction is likely to come first. A decline below 2521 on the next correction would alter that scenario.
********
FREE TRIAL SUBSCRIPTON
Market Turning Points is an uncommonly dependable, reasonably priced service providing intra-day market updates, explanations, and commentary, plus detailed weekend reports. It is ideally suited to traders, but it can also be valuable to longer-term holders since price projections are provided using Point & Figure analysis along with best-time estimates obtained from cycle analysis.
For a FREE 4-week trial, Send an email to: [email protected]
For further subscription options, payment plans, and for general information, I encourage you to visit my website at www.marketurningpoints.com.
The above comments about the financial markets are based purely on what I consider to be sound technical analysis principles. They represent my own opinion and are not meant to be construed as trading or investment advice, but are offered as an analytical point of view which might be of interest to those who follow stock market cycles and technical analysis.

When Andre Gratian was a stock broker years ago, a friend introduced him to technical analysis of the market. Consequently, it is not an exaggeration to say that Andre fell in love with this approach! Ever since then, it has become an increasingly important part of his professional life. Gratian has studied the works of Wyckoff, Edwards & Magee, Edward J. Dewey (cycles) and many others. However, one of my most profitable undertaking has probably been to study Point & Figure charting, which he finds invaluable in analyzing stocks and indices. If he were restricted to one methodology, this is the one that he would choose. This well-rounded background has given him what he feels to be a special insight into the stock market, facilitating the recognition of meaningful patterns and the ‘turning points’ in all trends, whether they be short or long term. Andre feels very comfortable discussing the stock market and passing on meaningful information to others. His subscribers include individuals and money managers throughout the world. Moreover, his Newsletters are currently published on several financial sites, here and abroad.


