Technical Analysis Of The Markets


Current Position Of The Market
SPX: Long-term trend – The bull market is continuing with no sign of a major top in sight.
Intermediate-trend – Soon coming to an end.
Analysis of the short-term trend is done on a daily basis with the help of hourly charts. It is an important adjunct to the analysis of daily and weekly charts which discusses the course of longer market trends.
Still Bullish (Near-Term)!
Market Overview
Chart Analysis (These charts and subsequent ones courtesy of QCharts)
This is some bull market, huh? And it does not look like it will give up the ghost anytime soon! The probable cause of this strength will be discussed later, but for now, there are good reasons to think that it is approaching a significant correction; so this is the time for the bulls to exercise some caution as the upside potential appears to be limited. However, oweverHowever it won’t happen next week. For now, it looks as if we need to go a little higher before we make another short-term top. And the next correction may not be ‘it’, either.
The weekly indicators are still too strong for anything really serious to take place right away. The weekly chart of the SPX shows no sign of long-term deceleration and, for that matter, nor does the daily. The 1X Point & Figure chart is showing some congestion, but we need to see more on the 10X in order to ensure a decline of consequence. This could happen over the next two or three weeks since we are nearing a short-term top which should be followed by a short-term correction and by another rally -- a process that could add enough Xs and 0s to the 10X chart to form a top capable of producing a decline of a hundred-plus points.
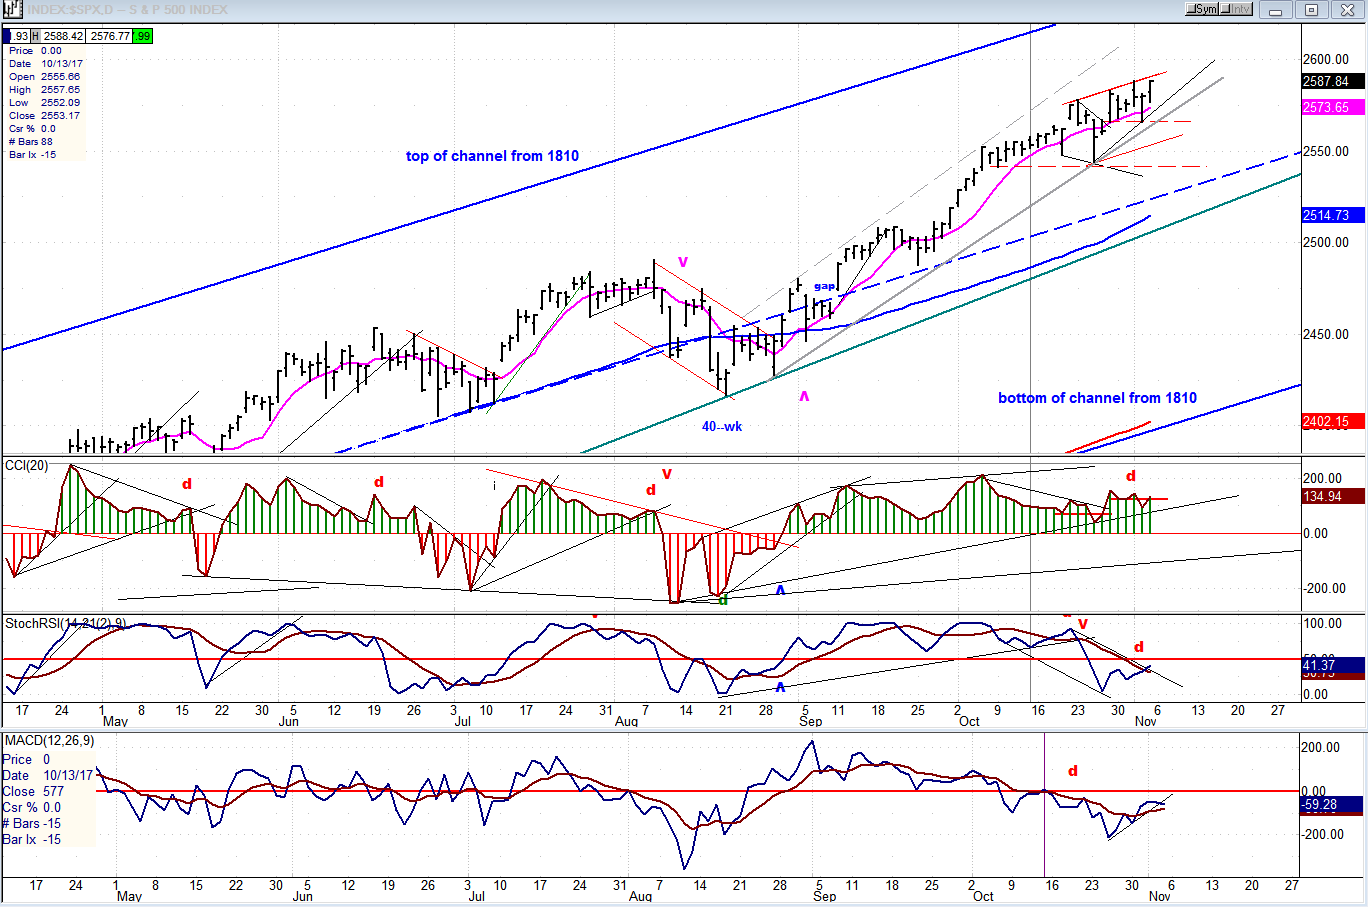
SPX Daily chart:
The 1810 low of January 2016 was most likely caused by the 7-year cycle which also bottomed in March 2009. But its effect on the market could not have provided a bigger contrast. Obviously a larger cycle (perhaps 40-yr) was also involved which produced the kind of weakness that we saw in the last bear market. This is the only factor that could be the cause of the strength that we now see in the market. This is why we should not expect a major top to come anytime soon. Also, if the 7-year cycle did make its low two years ago, we should not expect an important top to occur for at least another year or even more. With the 7-year cycle still in its adolescence, we can also understand why the 40-week cycle which made its low in August had such a small impact on prices, and why it is still pushing us higher and higher. It, too, is still early in its phase
The chart, below, is not showing much deceleration. Nowhere is this more evident than on the top oscillator (CCI) which has been a solid green ever since the cycle turned up. Before we can have a good correction, it will have to drop into the red. But it’s very high and, although it is showing some negative divergence, it does not look not as if it is not ready to do so right away. The original price trend line was very steep and was broken only briefly, readjusting to another one also steep.
There is a minor cycle due to make its low early next week which could bring a pull-back of a few points followed by a new high. After that, there is a six-week cycle due to bottom towards the end of the month. Probably not until after its reversal should we expect to get a larger top. There are some important cycles due in the middle of January which should give us a correction on a par with that of the 40-week cycle and by that time, we will have accumulated enough distribution on the 10X chart to nurture a significant downtrend.
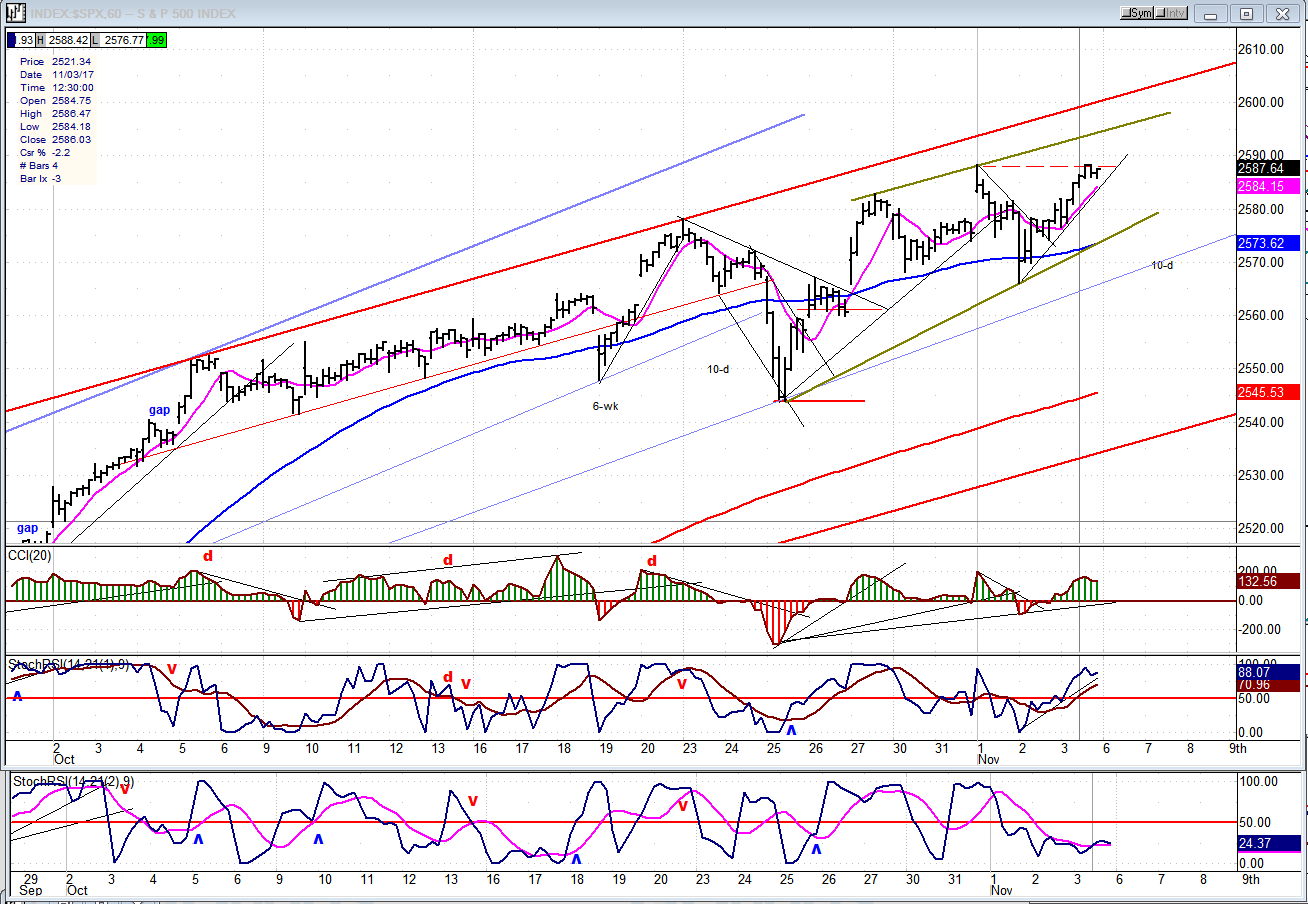
SPX Hourly Chart:
On Friday, SPX nearly matched the previous high -- only coming a few pennies short. Since there is a 10-day cycle low due on Tuesday, it’s likely that we will pull-back for a couple of days before making a slightly newer high. The pattern we are making looks very much like an ending diagonal which would be complete on the next small up-move. If it is an ending diagonal, the next short-term correction could take us back to the point from which it originated, around 2545. After the next rally we should finally be ready for a more important pause in this uptrend which could bring about a correction of a hundred points or more. A more accurate count will be available after we have made our final top and take a measurement of the distribution pattern.
Toward the end of the day on Friday, it looked very much as if we were preparing to reverse into the minor cycle low. In spite of a 12-point rally, the A/Ds started the day negative and remained negative throughout the entire treading session.. The move in the SPX was largely the result of a strong tech sector. It peaked a couple of hours before the close and underwent a little distribution until the closing bell.
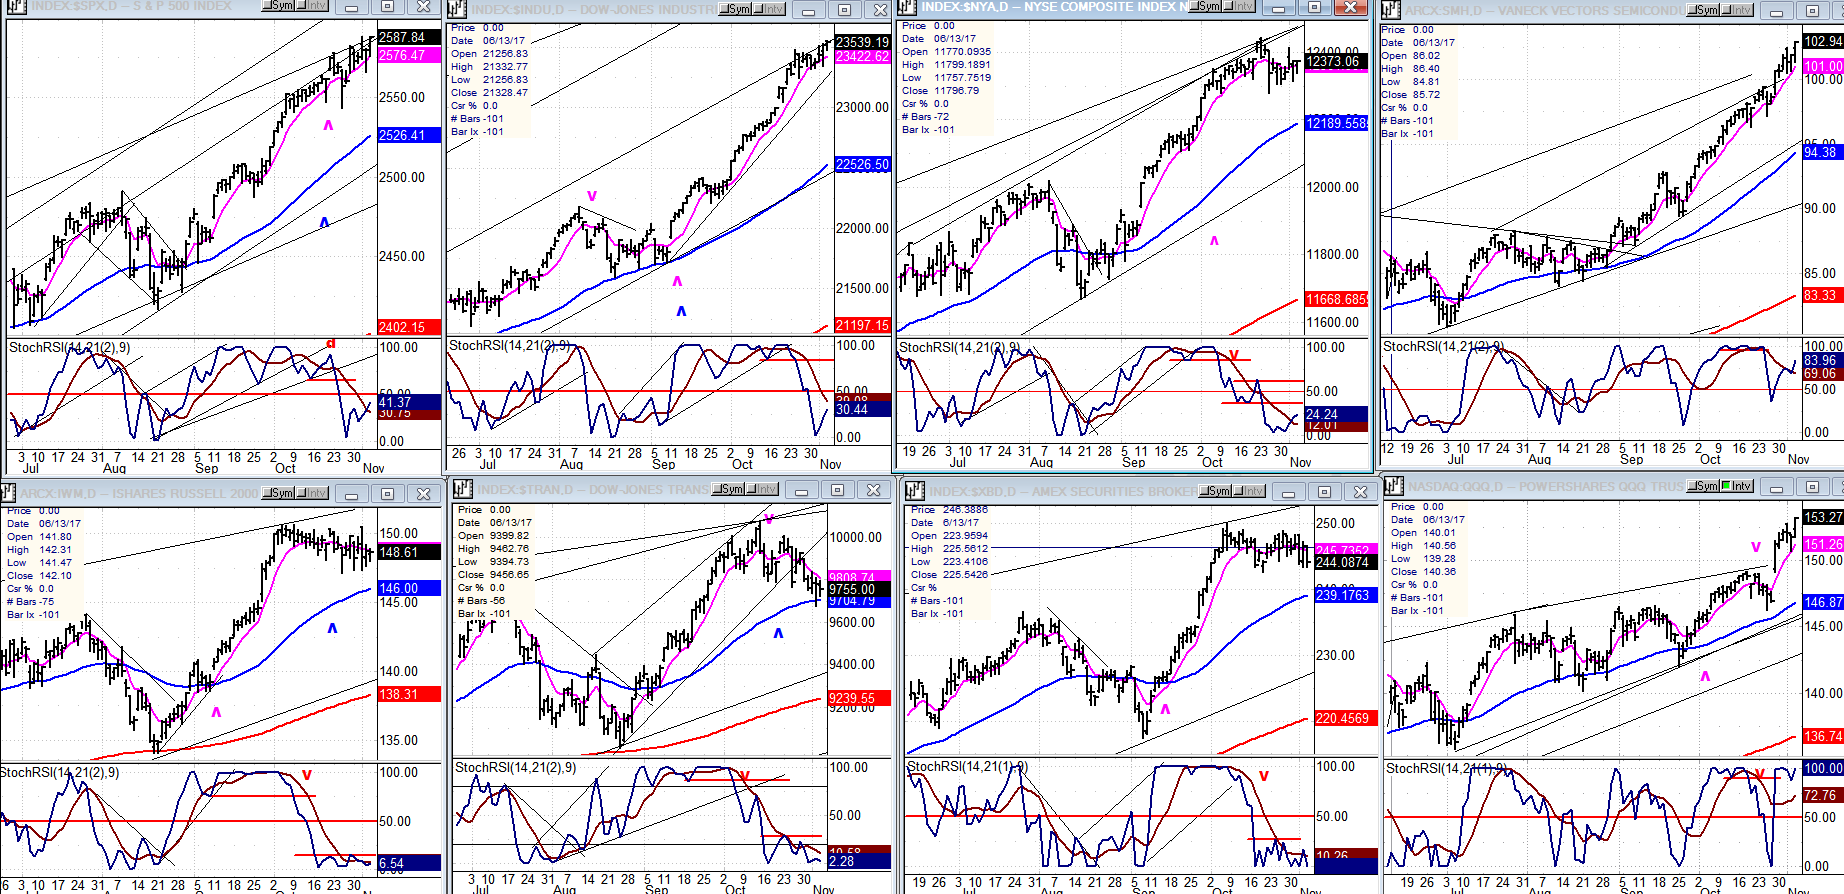
An Overview Of Some Important Indexes (Daily Charts)
The lower tier – except for QQQ – is suggesting that a correction is coming. QQQ responded to the recent strength in the tech sector which led the market higher last week. We may be starting to differentiate between the leaders and the followers.
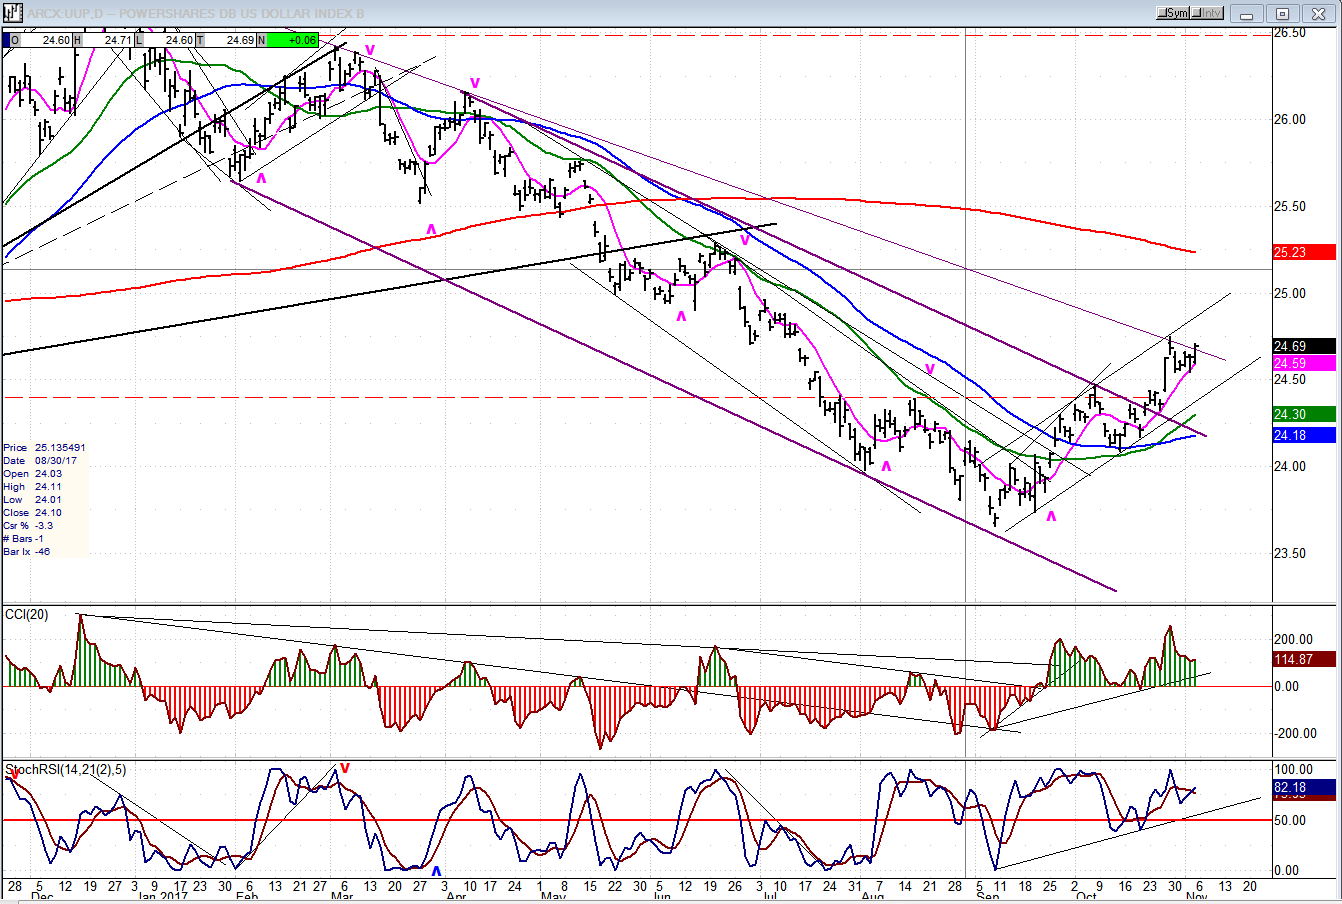
UUP (Dollar ETF)
UUP has completely come out of its corrective channel and, after a brief consolidation, is getting ready to move past its last downtrend line. The break-out wave looks valid and the index should move higher. A move up to its 233-day MA would represent a 50% retracement of its recent decline and looks like an attainable goal for now.
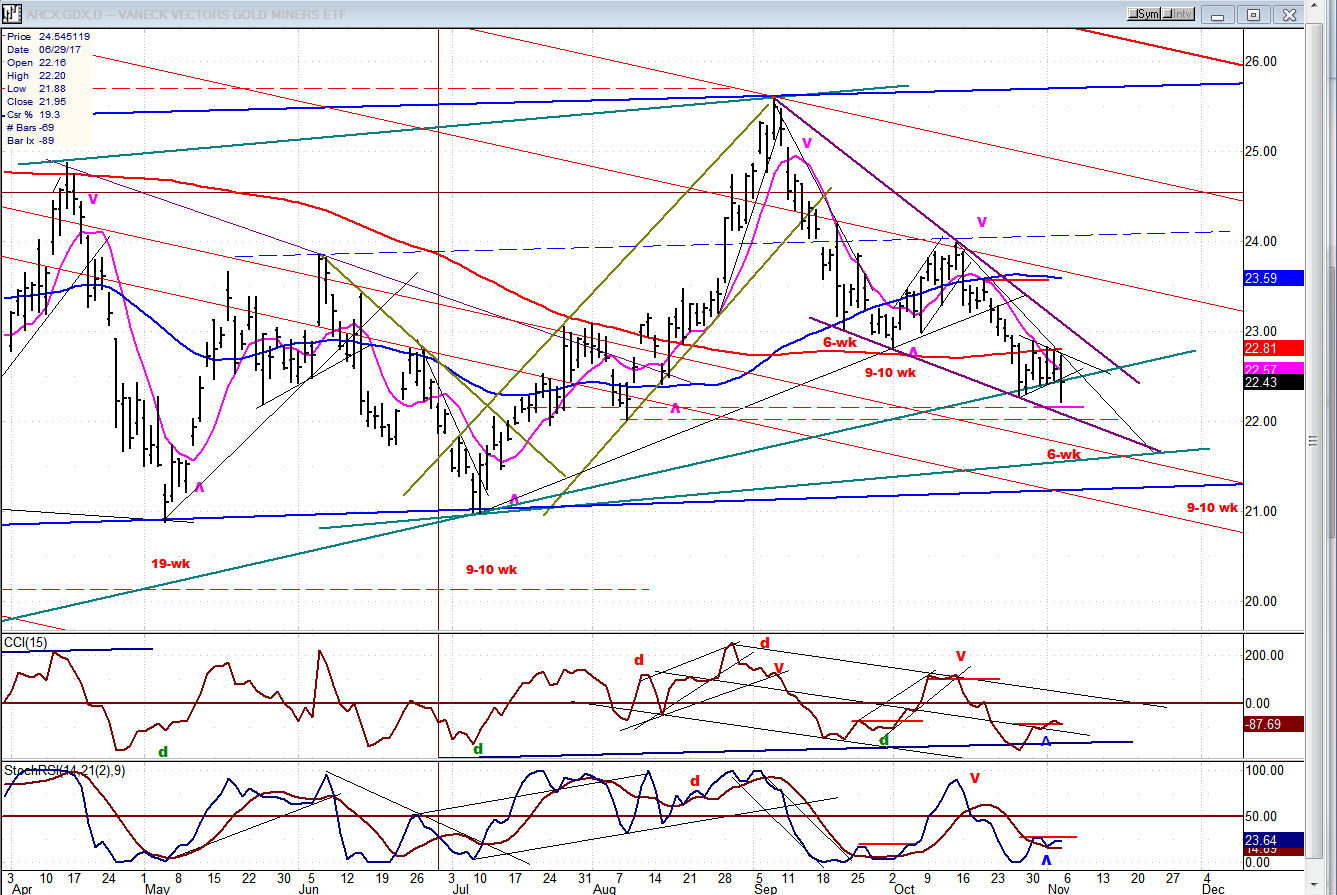
GDX (ETF For Gold)
GDX moved down to its ideal time frame for the low of the 6-wk cycle and turned up on Friday. If it continues higher, this will be confirmed as a genuine reversal and we should see higher prices before it is pulled back down by the next bottoming 9-10 week cycle.
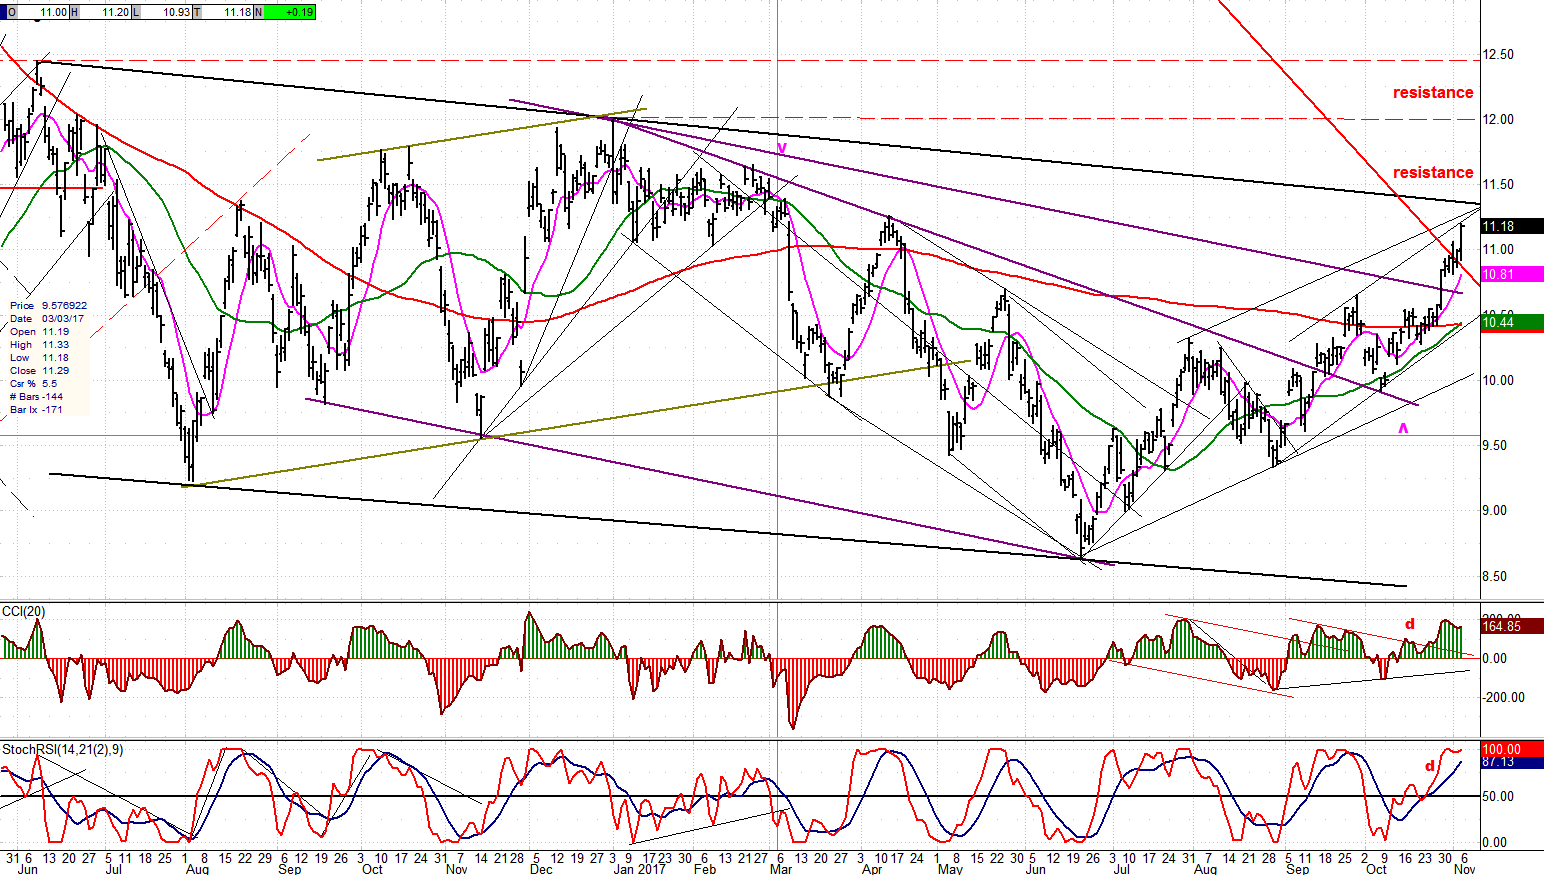
USO (United States Oil Fund)
USO has made an impressive recovery since its June low. However, it is coming up to the top trend line of its primary corrective channel and, even if it goes through it, it will face more resistance from its previous short-term highs. If this is a genuine trend reversal, more consolidation should be expected before it can overcome the 12.50 high.
Summary
SPX is three to four weeks away from an intermediate top. A few minor reversals to build an adequate distribution phase on the P&F chart will first be required.
********
FREE TRIAL SUBSCRIPTON
Market Turning Points is an uncommonly dependable, reasonably priced service providing intra-day market updates, explanations, and commentary, plus detailed weekend reports. It is ideally suited to traders, but it can also be valuable to longer-term holders since price projections are provided using Point & Figure analysis along with best-time estimates obtained from cycle analysis.
For a FREE 4-week trial, Send an email to: [email protected]
For further subscription options, payment plans, and for general information, I encourage you to visit my website at www.marketurningpoints.com.
The above comments about the financial markets are based purely on what I consider to be sound technical analysis principles. They represent my own opinion and are not meant to be construed as trading or investment advice, but are offered as an analytical point of view which might be of interest to those who follow stock market cycles and technical analysis.

When Andre Gratian was a stock broker years ago, a friend introduced him to technical analysis of the market. Consequently, it is not an exaggeration to say that Andre fell in love with this approach! Ever since then, it has become an increasingly important part of his professional life. Gratian has studied the works of Wyckoff, Edwards & Magee, Edward J. Dewey (cycles) and many others. However, one of my most profitable undertaking has probably been to study Point & Figure charting, which he finds invaluable in analyzing stocks and indices. If he were restricted to one methodology, this is the one that he would choose. This well-rounded background has given him what he feels to be a special insight into the stock market, facilitating the recognition of meaningful patterns and the ‘turning points’ in all trends, whether they be short or long term. Andre feels very comfortable discussing the stock market and passing on meaningful information to others. His subscribers include individuals and money managers throughout the world. Moreover, his Newsletters are currently published on several financial sites, here and abroad.


