Technical Analysis Of The Markets


Current Position of the Market
SPX: Long-term trend – The bull market is continuing with a top expected in the low 3000s.
Intermediate trend – The intermediate correction from 2873 should now continue until May.
Analysis of the short-term trend is done on a daily basis with the help of hourly charts. It is an important adjunct to the analysis of daily and weekly charts which discusses the course of longer market trends.
A Revealing Thursday Session
Market Overview
On February 9th, the first decline from 2873 was arrested two weeks later at 2533, slightly below the combined intermediate trend line from 1810 and the 200-DMA -- a formidable support level! The trampoline effect sent the index rebounding to 2802 where gravity took over, and support was again tested on 3/23, with another decline to 2586. Another rebound could only reach 2575 before reversing. A third decline on Wednesday of last week was once more met with buying at 2593 on the rising support level, although this time, the index was a little slower to bounce, finally doing so on Thursday with a 50-point move to 2657.10 where it was stopped by the declining 55-DMA and reversed once more in the last hour of trading.
Observing the market’s behavior over the past six+ weeks suggests that cyclical pressure continues to prevent a bullish reversal which could lead to new highs. Thursday’s action was particularly revealing, because not only did the index make a lower high, but in the way it was done. You’d think that a 50-point move denoted strength which should be followed by a consolidation period and more on the upside, but the market’s action suggests otherwise. When 2657 was reached, there was an immediate reversal of 16 points to 2641 followed by an 11-point retest of the high, and a close at 2642. And selling continued after the close, with the index dropping to 2632.50 and closing at 2634.9.
Perhaps this was simply cautious selling before an extended weekend, but most likely it suggests that over the next 10-days, the support level will be broken and the former low of 2533 will be retested. The driving force should be the same bottoming cycle which was responsible for the February 9th low. Of course, there is no guarantee that this will take place, but this is also substantiated by a P&F projection, thereby increasing the odds for this occurrence. We should have confirmation or denial by the market itself, next week.
Chart Analysis (These charts and subsequent ones courtesy of QCharts)
SPX daily chart
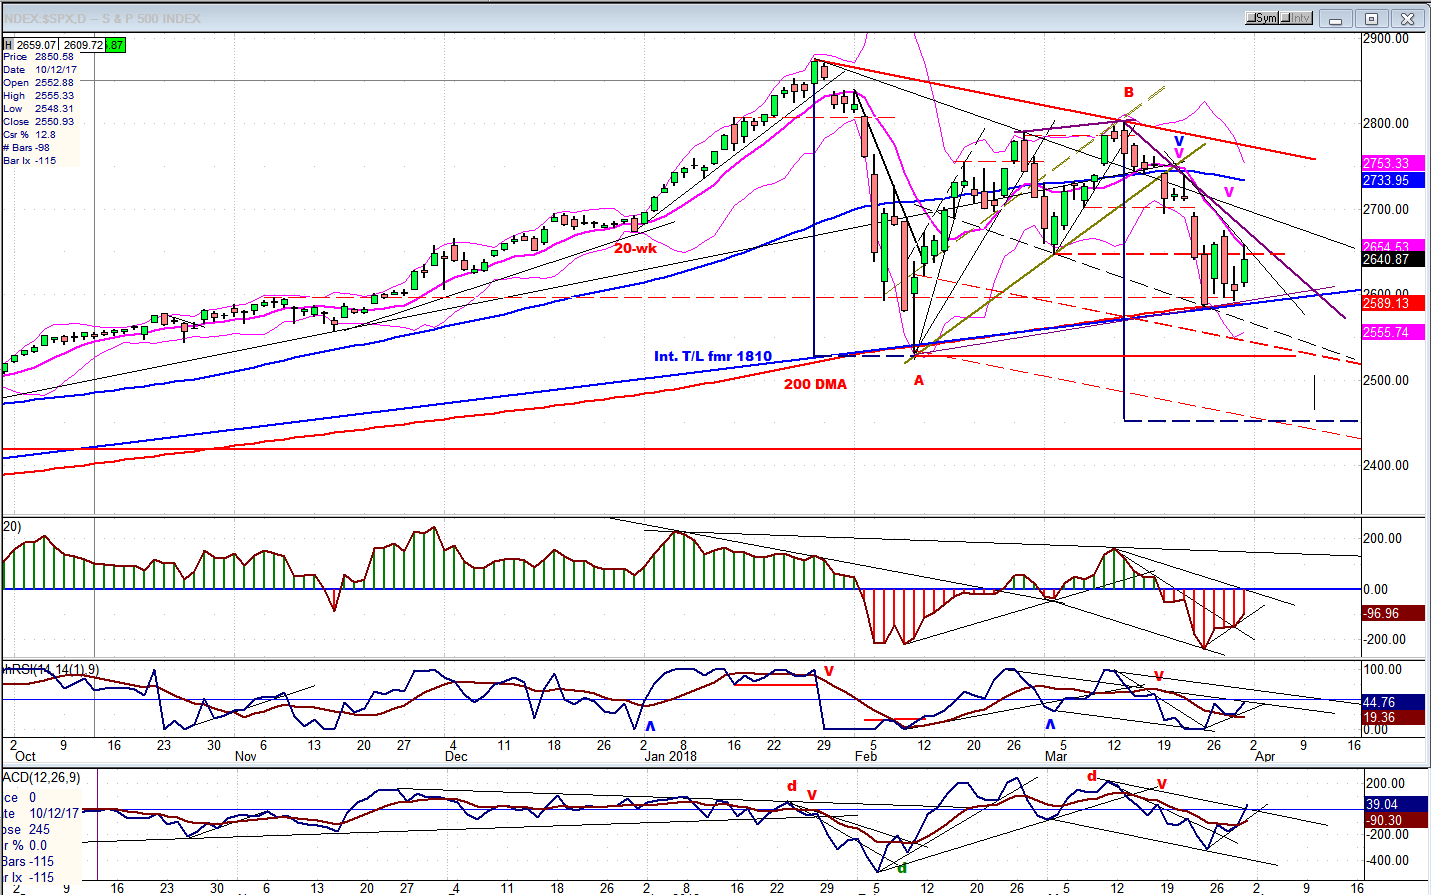
Here, you can see graphically what was described above. The intermediate trend line and the 200-DMA have merged to create a powerful support level which has arrested several attempts at taking prices lower. It’s obvious that we are coming to a decision point! There is a major (red) downtrend line pointing down, and a secondary (purple) one doing the same, but at a much steeper angle and squeezing the index against the intermediate trend line. This is the one which will decide if we go up or down from here. If it cannot be penetrated on the upside over the next few days, the support level will be broken. The small vertical bar at the right of the chart identifies the next ideal bottoming of the same cycle which took prices down to point A. That does not bode well for the bulls who would like support to hold and create a bullish reversal. But beyond that, next week is week 32 of the 40-week cycle! Which means that the smaller cycle is getting more and more assistance from the larger one. That would seem to put the odds squarely in favor of the bears.
Looking at the overall pattern, I have marked points A and B of what looks like a large corrective pattern which started at 2873. If that’s the case, it would appear that we are already moving toward C, and logic dictates that it would be reached by the time the 40-wk cycle makes its low. The two vertical lines on the chart are of the same size; in other words if C should equal A, the final low should be at 2450.
Another possibility (actually favored) is that another good rebound will develop over the next couple of weeks, after the first cycle has bottomed. In that case, the pattern could morph into an ending formation of a-b-c-d-e. Once again, we’ll just have to see what the market wants to do!
SPX hourly chart
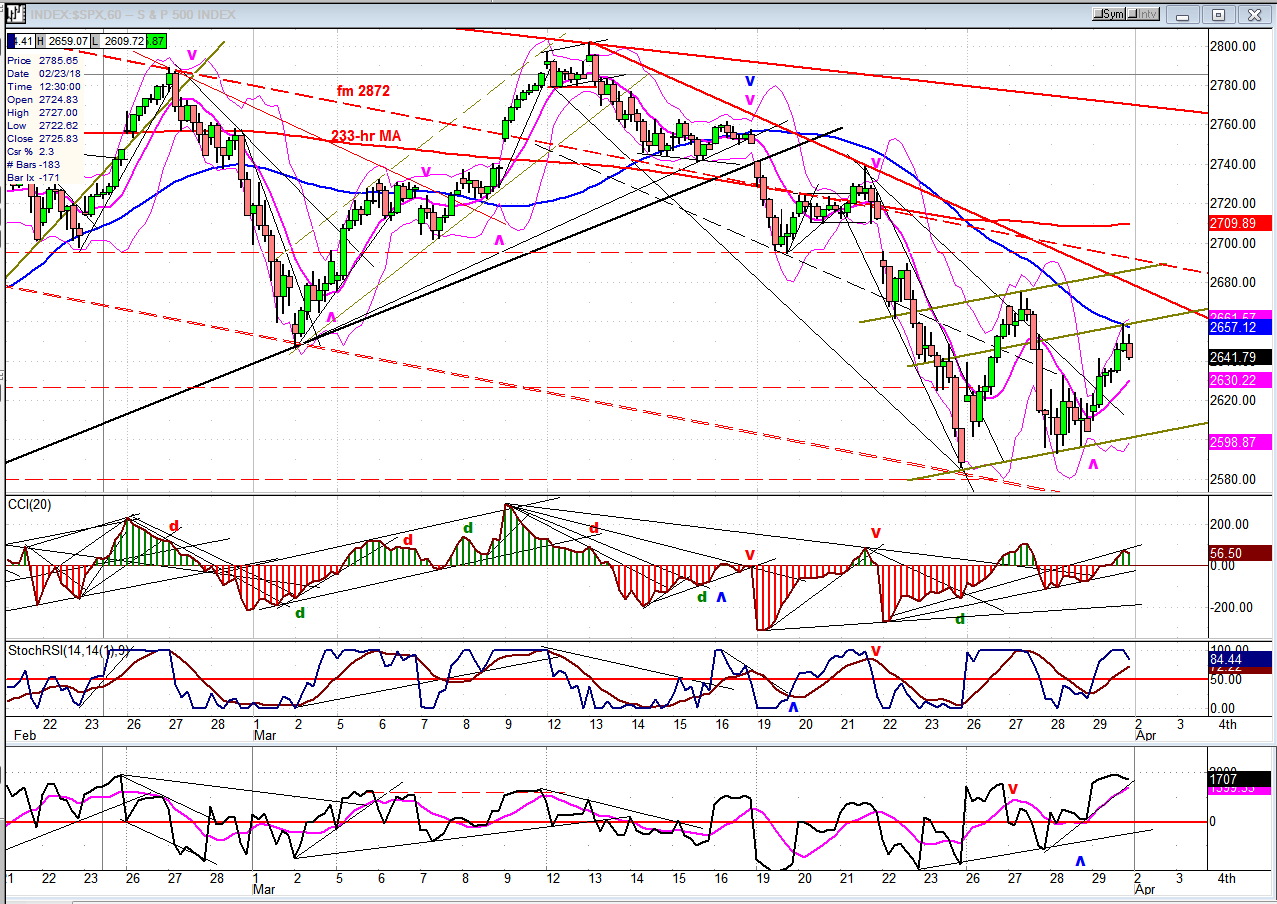
Thursday’s rally stopped at the 55-hr MA and reversed, and the index continued to sell off after the close. There is not much to be derived from the hourly chart, as it stands. We need to wait until Monday to find out what the market wants to do next, although the closing action suggests another test of the support level.
All the indicators have started to turn, but they have not yet given a sell signal. The next time they do, we could be on our way to 2530-60.
FANGS (weekly charts)
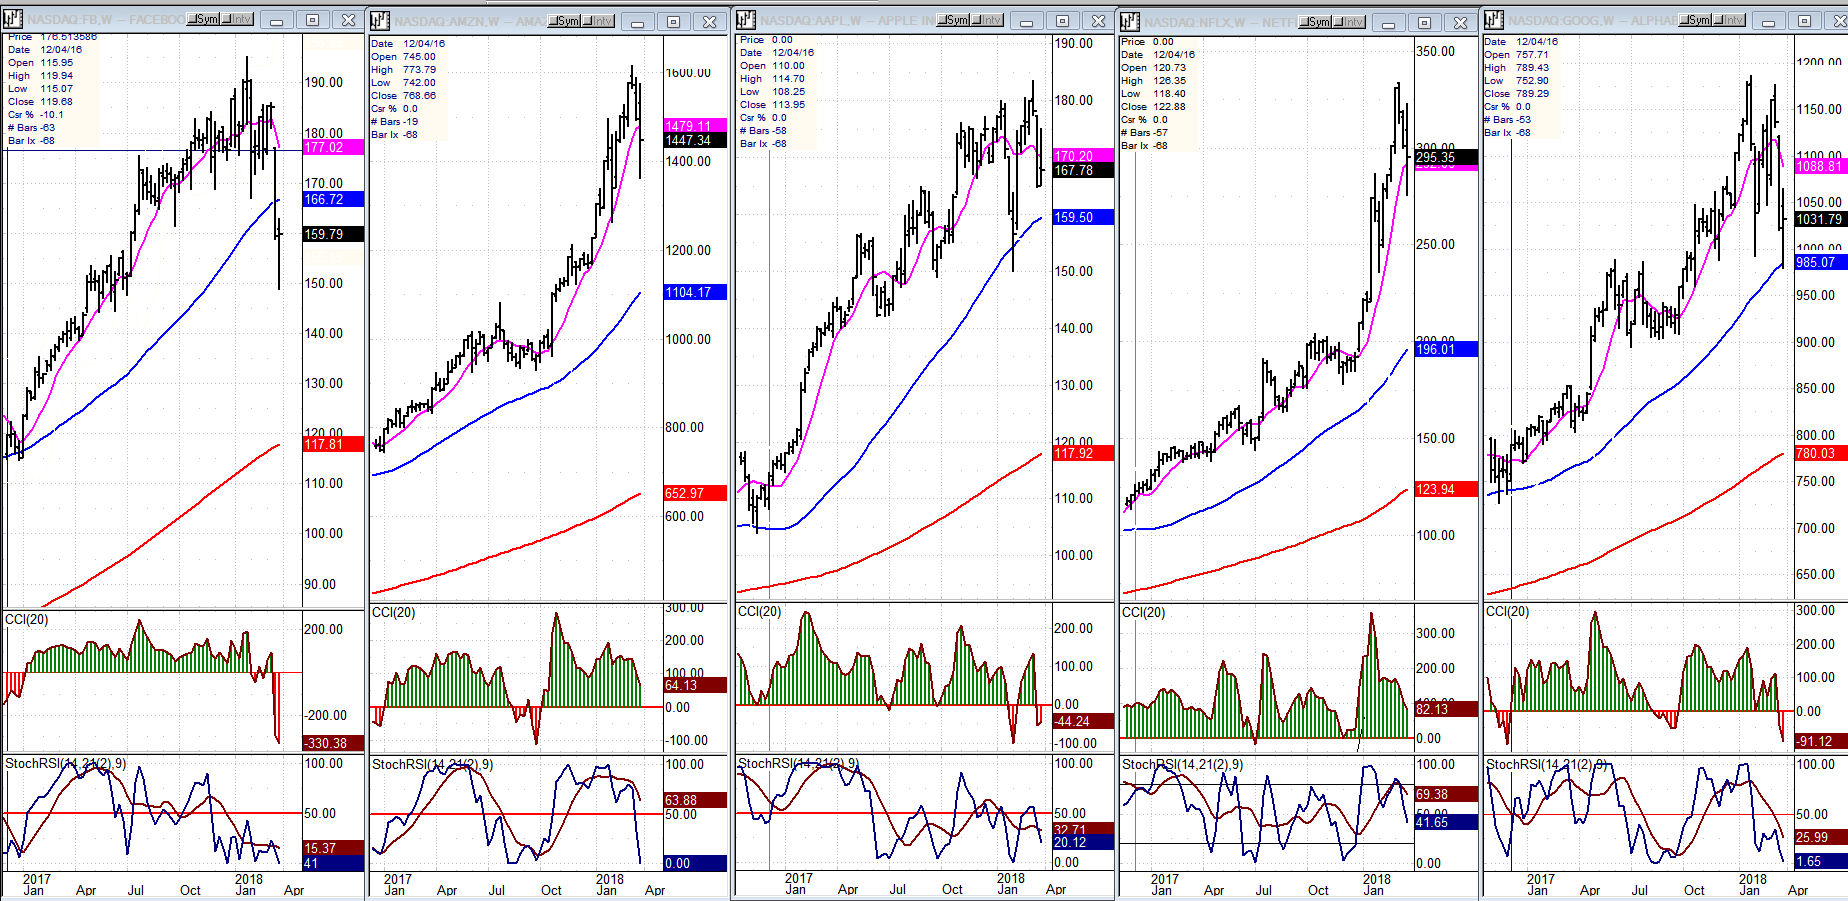
Of the 5 FANGs, Facebook has suffered the most from the market correction. It has also received a lot of bad press recently and this could go on for a while longer until the cloud over its head has been removed. Google is the next weakest with problems related to those of Facebook. The other 3 went against the correction for a while, but have now caught up with it. The action in this sector and in the NDX in general is putting a lot of pressure on SPX, which is the reason it is underperforming both TRAN and IWM.
UUP (dollar ETF)
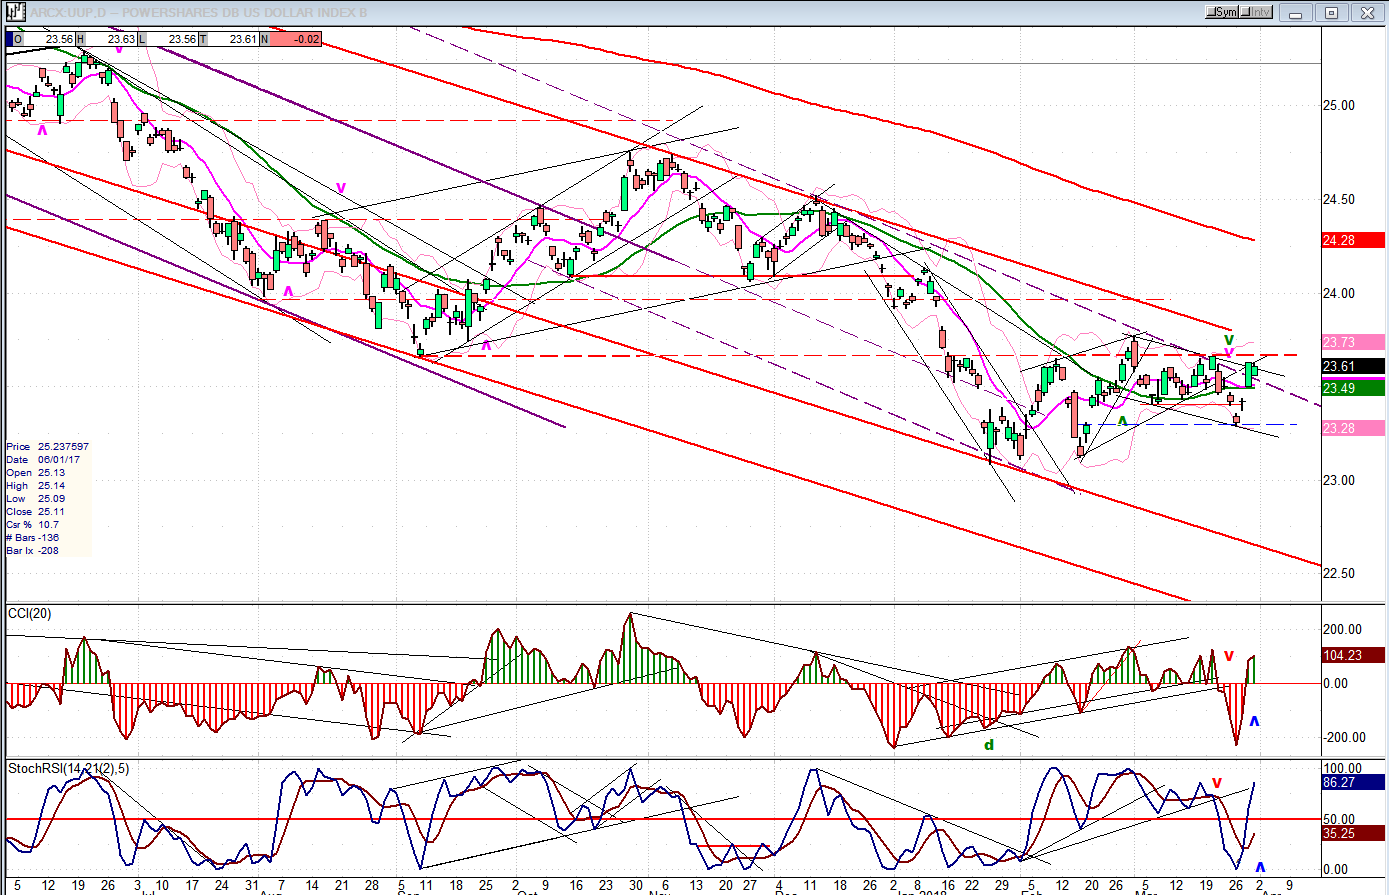
UUP started to extend its correction but rallied back above its 30-DMA right away. Its position is essentially neutral for now. We need a little more time to assess its short-term direction
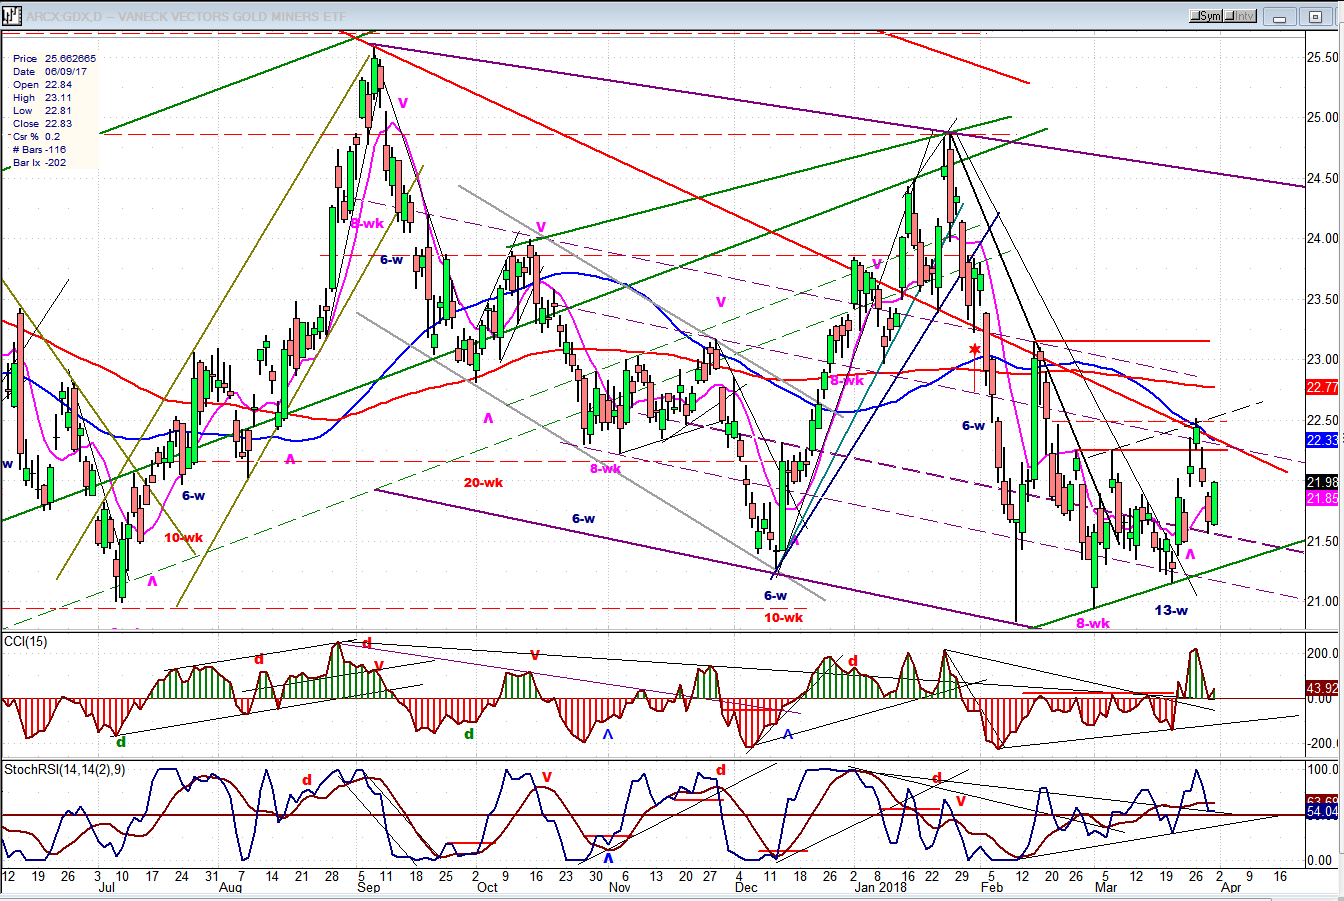
GDX (Gold miners ETF)
The action of GDX continues to be tied to that of UUP. GDX started to rally after its 13-wk cycle low, but it met with resistance at its 55-DMA and was also affected by UUP’s refusal to continue its decline. We’ll have to see if it (and gold) will be able to start moving independently from the dollar, or if it will continue to be tied to its action.
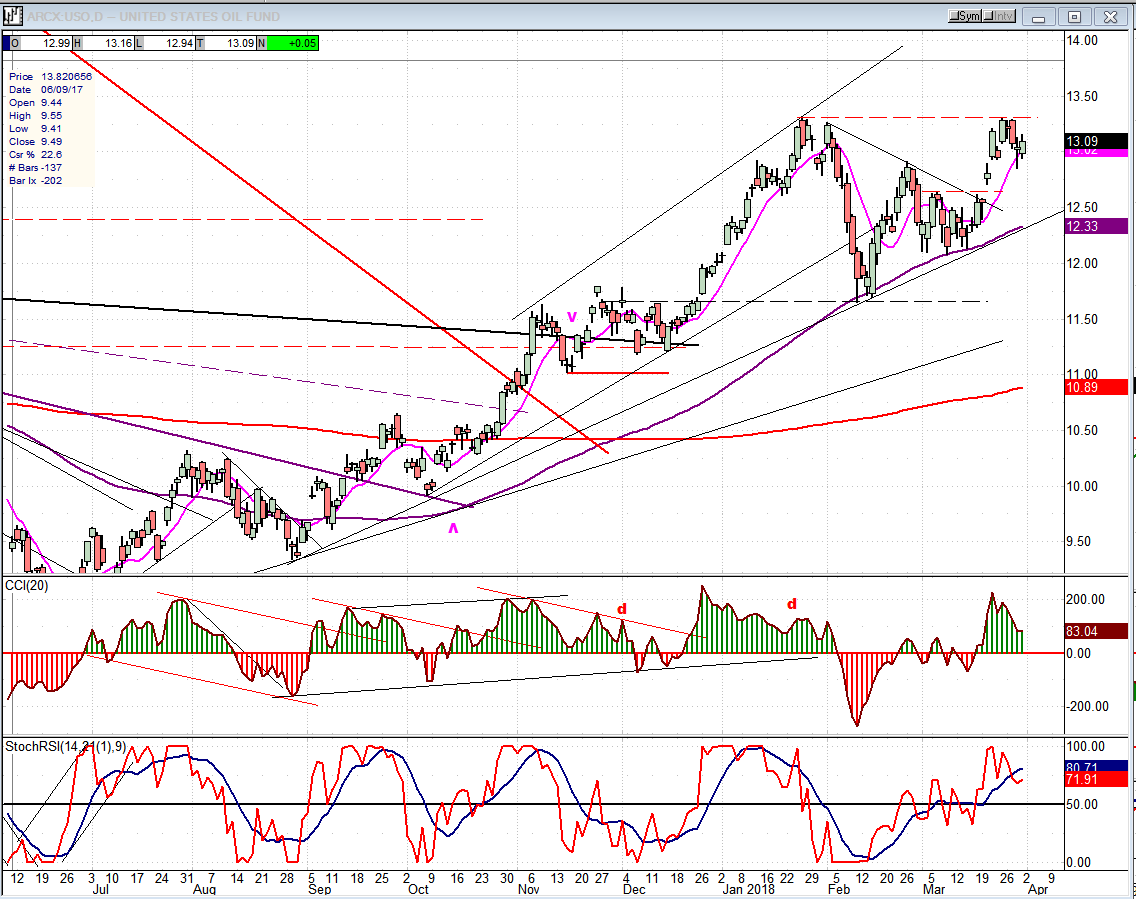
USO (United States Oil Fund)
USO found resistance at its former high and is consolidating. So far, this action is normal and it still looks bullish.
Summary
The short and intermediate trends of SPX continue to have a downward bias, mostly due to the cycles bottoming directly ahead. These should keep it from attempting to resume its uptrend over the next couple of months.
*********
FREE TRIAL SUBSCRIPTON
With a trial subscription, you will have access to the same information that is given to paid subscribers, but for a limited time period. I think you will find that knowing how far a move can carry is one of the most useful benefits of this service, whether you are a trader or an investor -- especially when this price target is confirmed by reliable indicators which give advance warning of a market top or bottom. Furthermore, cycle analysis adds the all- important time element to the above price projections.
For a FREE 4-week trial, further subscription options, payment plans, and for general information, I encourage you to visit my website at www.marketurningpoints.com.
The above comments about the financial markets are based purely on what I consider to be sound technical analysis principles. They represent my own opinion and are not meant to be construed as trading or investmentadvice, but are offered as an analytical point of view which might be of interest to those who follow stock market cycles and technical analysis.

When Andre Gratian was a stock broker years ago, a friend introduced him to technical analysis of the market. Consequently, it is not an exaggeration to say that Andre fell in love with this approach! Ever since then, it has become an increasingly important part of his professional life. Gratian has studied the works of Wyckoff, Edwards & Magee, Edward J. Dewey (cycles) and many others. However, one of my most profitable undertaking has probably been to study Point & Figure charting, which he finds invaluable in analyzing stocks and indices. If he were restricted to one methodology, this is the one that he would choose. This well-rounded background has given him what he feels to be a special insight into the stock market, facilitating the recognition of meaningful patterns and the ‘turning points’ in all trends, whether they be short or long term. Andre feels very comfortable discussing the stock market and passing on meaningful information to others. His subscribers include individuals and money managers throughout the world. Moreover, his Newsletters are currently published on several financial sites, here and abroad.


