Technical Analysis Of The Markets


Current Position of the Market
SPX: Long-term trend – The bull market is continuing with a top expected in the low 3000s.
Intermediate trend – The intermediate correction from 2873 should now continue until May.
Analysis of the short-term trend is done on a daily basis with the help of hourly charts. It is an important adjunct to the analysis of daily and weekly charts which discusses the course of longer market trends.
More Weakness? How Much?
Market Overview
Some analysts called for the final low of the correction to have occurred on 4/02, at 2554. I have been reluctant to do this for two principal reasons: 1) The 40-wk. cycle low is still ahead of us -- ideally due to bottom sometime in May, and 2) there is an unfilled valid count to 2450 on the SPX. With this past week’s market action, the market direction appears ready to be moving to the downside again, and if we start a decline that continues for another four to six weeks into the cycle low, considering the degree of volatility currently present in the market, it is not too far-fetched to conceive of another (and final) leg of the correction descending to the above-mentioned level. Of course, the market action will have to confirm this possibility, and we should know as early as next week if it has a chance of materializing.
I had expected the weakness to begin last week because of the minor cycles due at the end of the past week and into the beginning of the next. The first cycle bottomed on Wednesday but had little effect on prices and extended the bounce for a couple of days. The second did bring prices down 34 points from the high when it bottomed right on cue at the end of the day. The third, which could bottom as late as Wednesday, may be the charm to start the anticipated pull-back. If the 40-wk cycle takes over from there, then look for protracted lower prices ahead.
Chart Analysis (These charts and subsequent ones courtesy of QCharts)
SPX daily chart
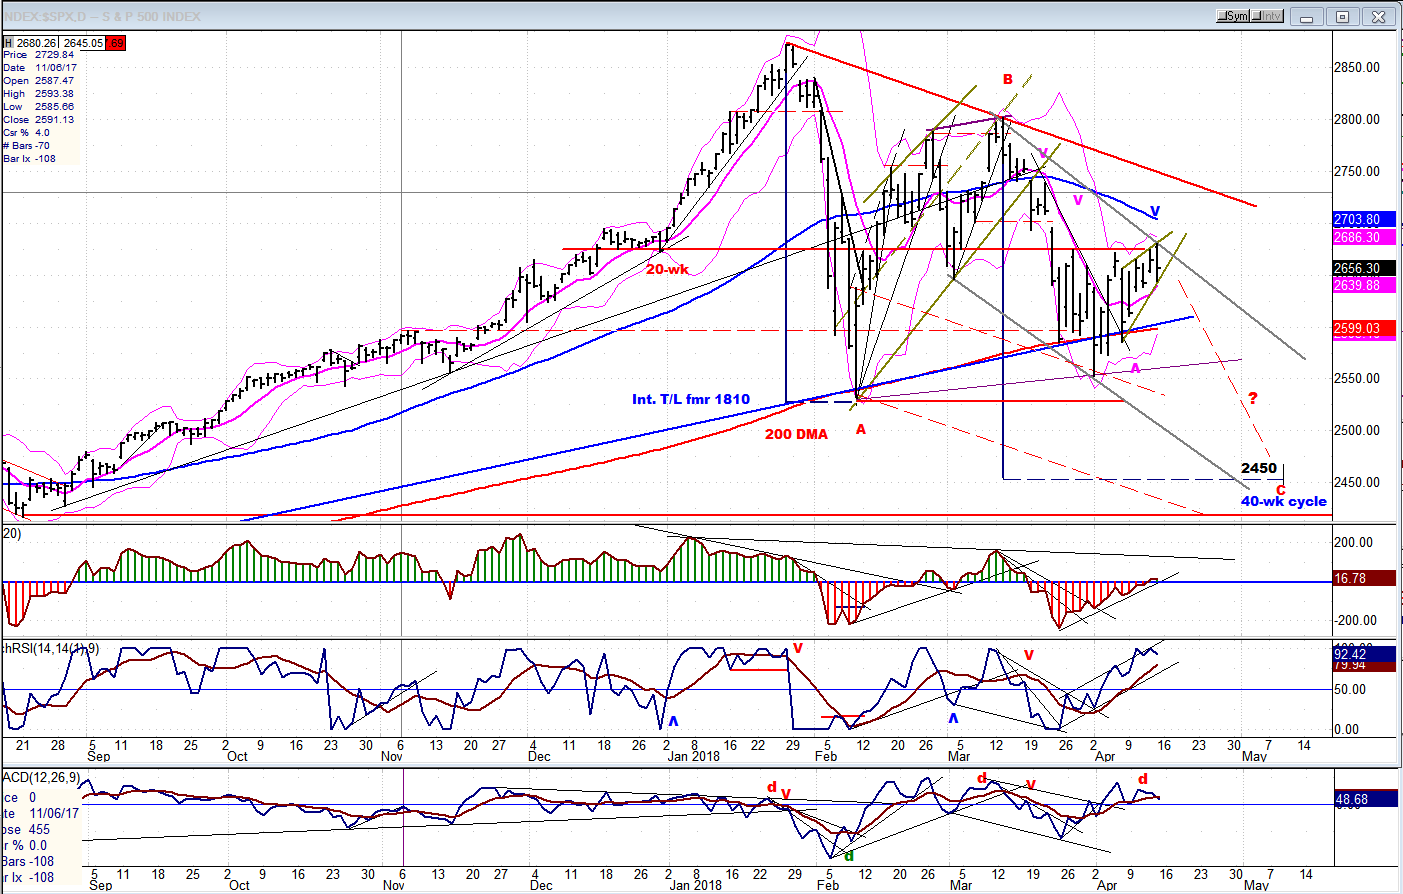
On the daily SPX chart, I have drawn a downside channel which could represent the basic trend pattern for the next few weeks. Here is the analysis which supports this view, starting with the two primary points that were made in the Market Overview. There is an important cycle low due during May. It is most likely that the index will not be able to start a bullish uptrend until that low is out of the way. To those who are familiar with Point & Figure analysis -- AND cycles – the combining of these two analytical studies often affords us an uncanny time/price preview. The congestion pattern which produced a count taken at the 2760 level gives us a target of 2450. These two factors should influence the behavior of the index over the next few weeks. If so, it should already be apparent in the chart pattern.
-
If we compare the low of 2/09 with that of 4/02, we notice a significant difference of price behavior. Upon reaching 2533 on 2/09, the index took off immediately and kept on going for 256 points before it had a significant correction. On 4/02, what started as a strong rebound from 2554 quickly morphed as a tepid price recovery forming a bearish ascending wedge -- which appears to have come to an end on Friday at 2680. Something seems to be suppressing the advance, and that could very well be the 40-wk cycle which is about 9/10th complete at this point, and approaching what could be a climactic phase into its low point.
-
There is some evidence that the beginning of a decline started on Friday. If I convert this chart to candlesticks, the pattern which was made on Friday was a bearish engulfing candle, which, as the name implies, is bearish, in this case most likely announcing the completion of the bearish wedge formation. We know that a wedge pattern will normally retrace back to the beginning of the formation, so we should see, at a minimum, a price retracement to 2650. That would bring it just below the T/L-MA support level once again. That could come quickly and, if so, what follows will either confirm or deny what the P&F-cycle combination suggests.
-
The daily oscillators also point to a top being made on Friday. They started to turn down, with the A/D taking the lead after showing some clear negative divergence. If they all go negative next week, it will begin to confirm the view expressed above.
-
One final point which was made earlier: structural symmetry suggests that a drop to 2450 would make C=A.
These are too many bearish warnings to be ignored, and if the market decides to take another course, it will have to prove them wrong over the next few days and weeks.
SPX hourly chart
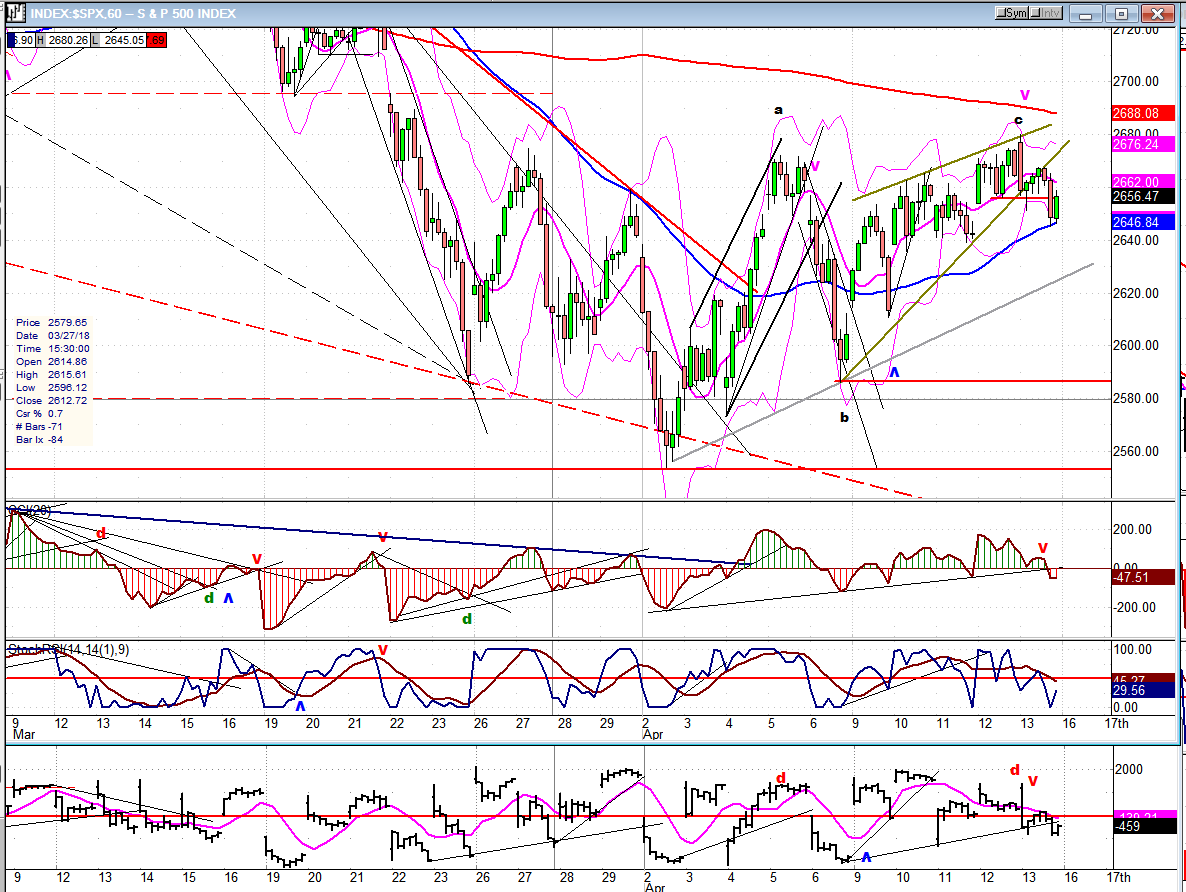
I have posted the hourly chart on candlesticks to show that at point “c”, the 60m bars also show a bearish engulfing candle. The index rallied for three hours and then dropped into the low of a mini cycle which happened to coincide with support from the 55-hr MA. If the analysis provided above is correct, we should next see a decline down to the first horizontal red line which is drawn at the low of the bearish wedge (more visible on this chart). Then, after another brief consolidation, the decline should continue into the low of the next minor cycle due mid-week. The final confirmation that we have started a decline into the 40-wk. cycle low will come when the 2553 former low is breached. This is the downward progress that we must see in order to confirm the validity of the bearish scenario depicted above.
All three oscillators have already given sell signals to confirm the move out of the bearish wedge pattern. They should not turn back up until the index gets down to the former low.
TRAN, SPX, IWM (daily charts)
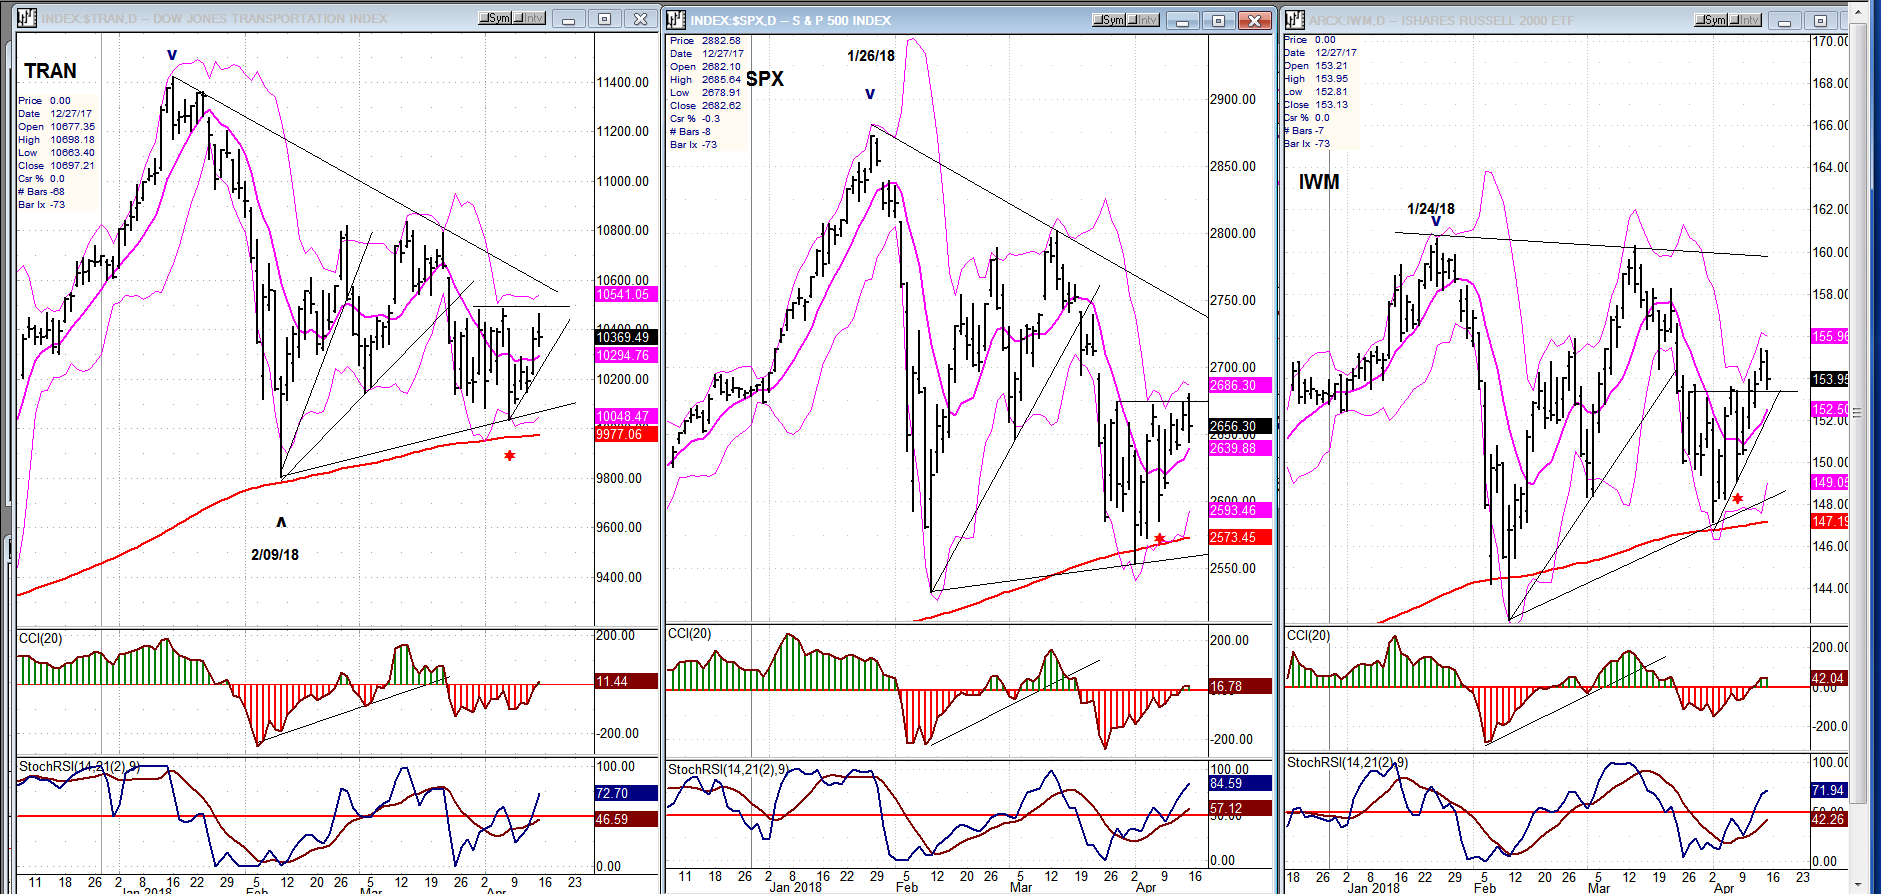
I don’t want to engage in a micro analysis of these charts, because the point is to compare them primarily on an intermediate term basis and not on a daily one. But I could not help but notice that, in the past few days, the TRAN made a lower low followed by a lower high, while the other two made a higher low followed by a higher high. This may be meaningful!
UUP (dollar ETF)
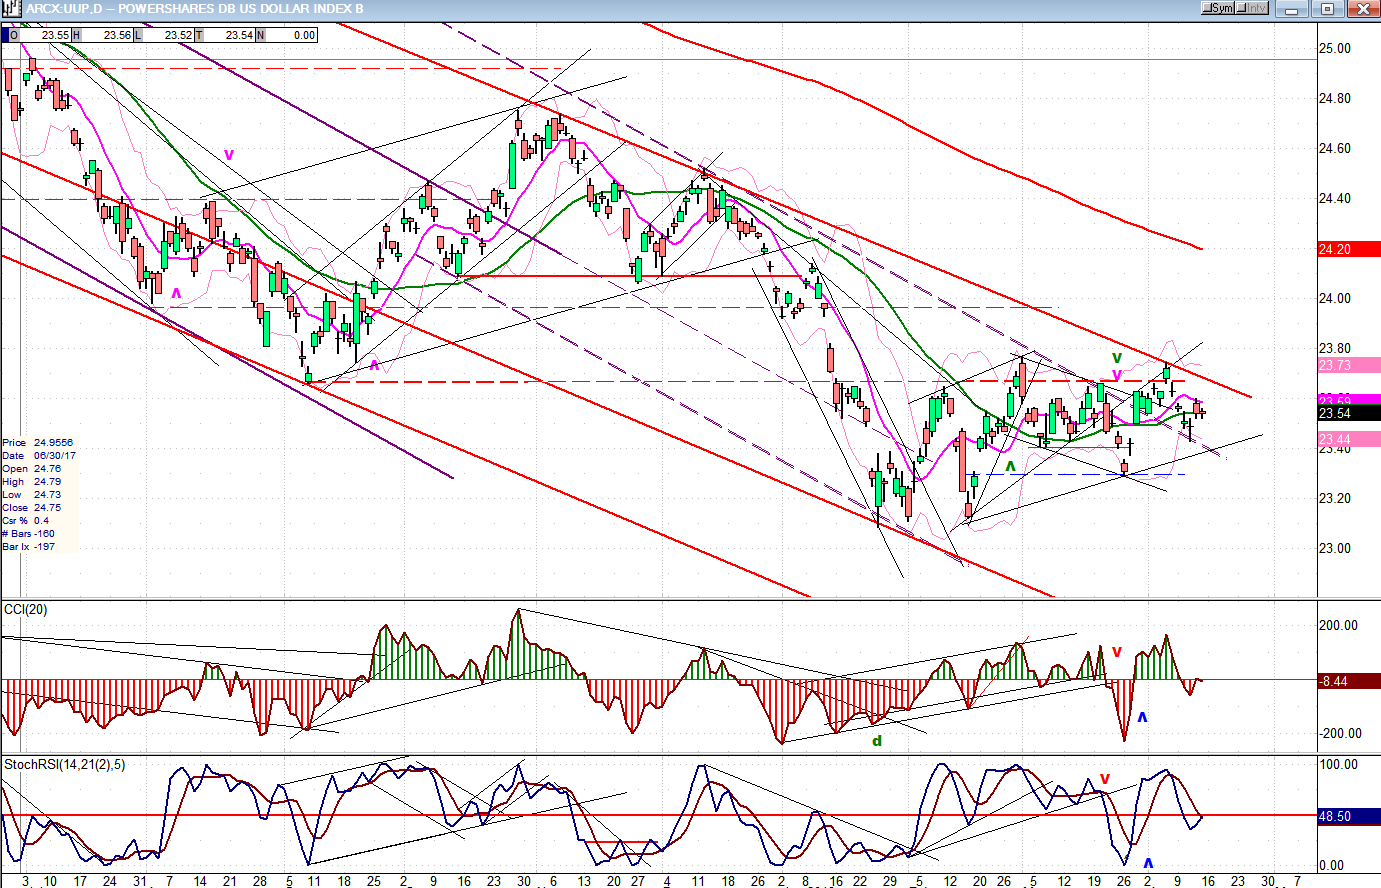
After attempting a break-out above its red downtrend line and being repelled by it, UUP once again found support on the dashed parallel channel line and bounced. Whichever trend line is broken first will determine the direction of the trend, but odds favor down rather than up.
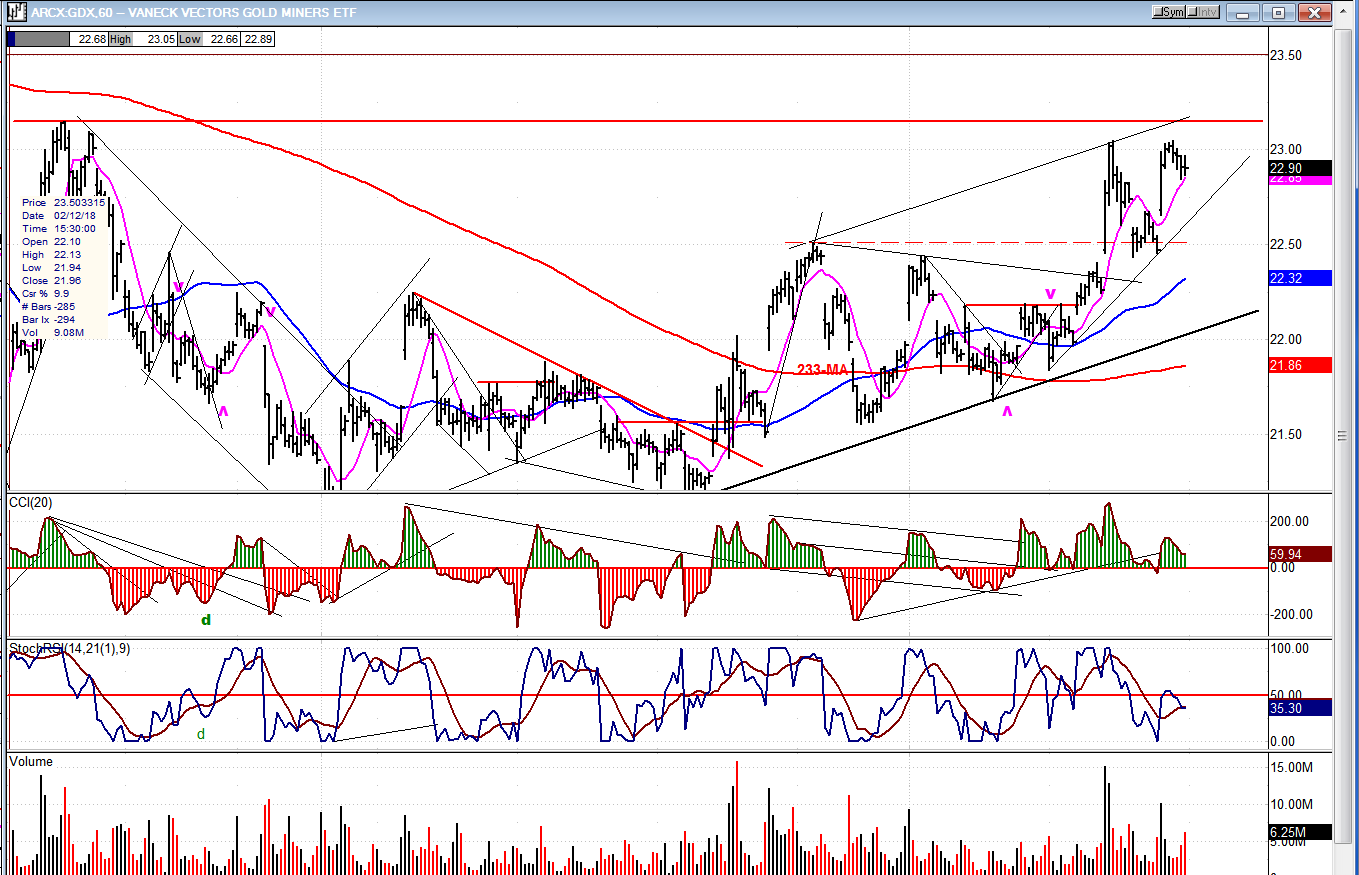
GDX (Gold miners ETF)
GDX is picking up upside momentum and looks ready to overcome the last obstacle to its break-out. If it succeeds, it should immediately seek 25-25.50, and later much higher if it fills the count which has been accumulated in the base that started to form in early February and projects a move up to ~47.00.
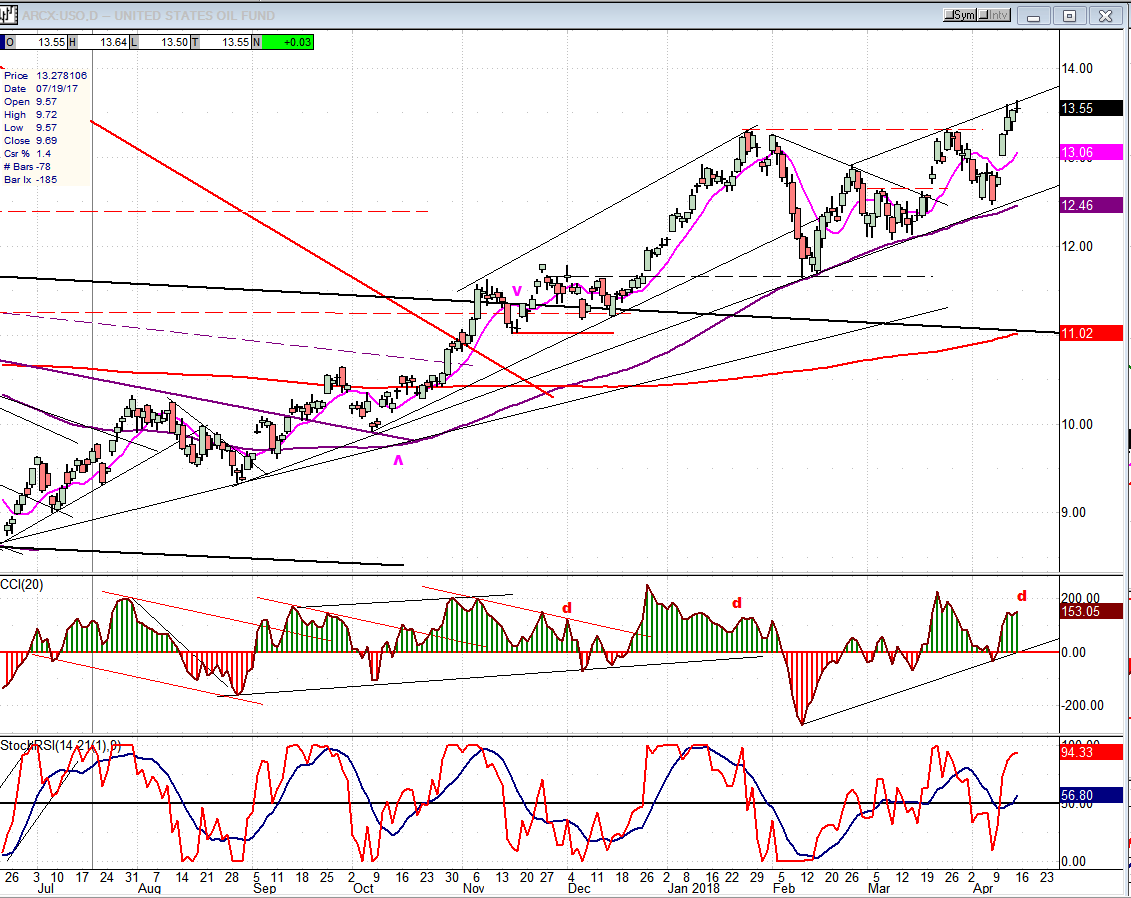
USO (United States Oil Fund)
USO continues the rally which started at the 8.71 low in June ’17, interrupted only by sporadic consolidations along the way. It will soon reach an important resistance level ca. 14.00 which corresponds to a P&F projection which has been mentioned repeatedly
Summary
SPX looks ready to start on its final downward phase into the 40-wk cycle low and a potential 2450 target, to end the current intermediate correction.
*********
FREE TRIAL SUBSCRIPTON
With a trial subscription, you will have access to the same information that is given to paid subscribers, but for a limited time period. I think you will find that knowing how far a move can carry is one of the most useful benefits of this service, whether you are a trader or an investor -- especially when this price target is confirmed by reliable indicators which give advance warning of a market top or bottom. Furthermore, cycle analysis adds the all- important time element to the above price projections.
For a FREE 4-week trial, further subscription options, payment plans, and for general information, I encourage you to visit my website at www.marketurningpoints.com.
The above comments about the financial markets are based purely on what I consider to be sound technical analysis principles. They represent my own opinion and are not meant to be construed as trading or investment advice, but are offered as an analytical point of view which might be of interest to those who follow stock market cycles and technical analysis.

When Andre Gratian was a stock broker years ago, a friend introduced him to technical analysis of the market. Consequently, it is not an exaggeration to say that Andre fell in love with this approach! Ever since then, it has become an increasingly important part of his professional life. Gratian has studied the works of Wyckoff, Edwards & Magee, Edward J. Dewey (cycles) and many others. However, one of my most profitable undertaking has probably been to study Point & Figure charting, which he finds invaluable in analyzing stocks and indices. If he were restricted to one methodology, this is the one that he would choose. This well-rounded background has given him what he feels to be a special insight into the stock market, facilitating the recognition of meaningful patterns and the ‘turning points’ in all trends, whether they be short or long term. Andre feels very comfortable discussing the stock market and passing on meaningful information to others. His subscribers include individuals and money managers throughout the world. Moreover, his Newsletters are currently published on several financial sites, here and abroad.


