Technical Analysis Of The Markets
 share
share
 share
share
 share
share
 share
share
 share
share
Current Position Of the Market
SPX: Long-term trend – The bull market is continuing with a top expected in the low 3000s.
Intermediate Trend – The intermediate correction from 2873 should continue until about mid-May.
Analysis of the short-term trend is done on a daily basis with the help of hourly charts. It is an important adjunct to the analysis of daily and weekly charts which discusses the course of longer market trends.
Still Range Bound
Market Overview
SPX started an intermediate correction on 1/29 which should continue to correct for another couple of weeks. From a high of 2873, the initial drop of 340 points to 2533 on 2/09 was followed by a rally to 2777 on 3/13, another drop to 4/02, and another rally to 4/18, before reversing again. By then, the sequence of higher lows and lower highs began to look like a contracting triangle in the making. However, this pattern could soon be morphing into something else, so we need to let it complete before labeling it.
The time frame to end this correction is best relegated to the low of a 40-week cycle which is due probably shortly after mid-May. The final price low is unclear at this time, since there are two counts which could turn out to be valid. A new low could be made, or simply a re-test of the low. The original projection to about 2450 is looking less and less likely.
The 20-wk and 40-wk cycles are as reliable as cycles can be when it comes to deciding on the ideal time frame for their lows. Furthermore, the weekly chart oscillators are a good source of confirming data. These currently tell us that we are approaching completion, but are not quite there yet.
Chart Analysis (These charts and subsequent ones courtesy of QCharts)
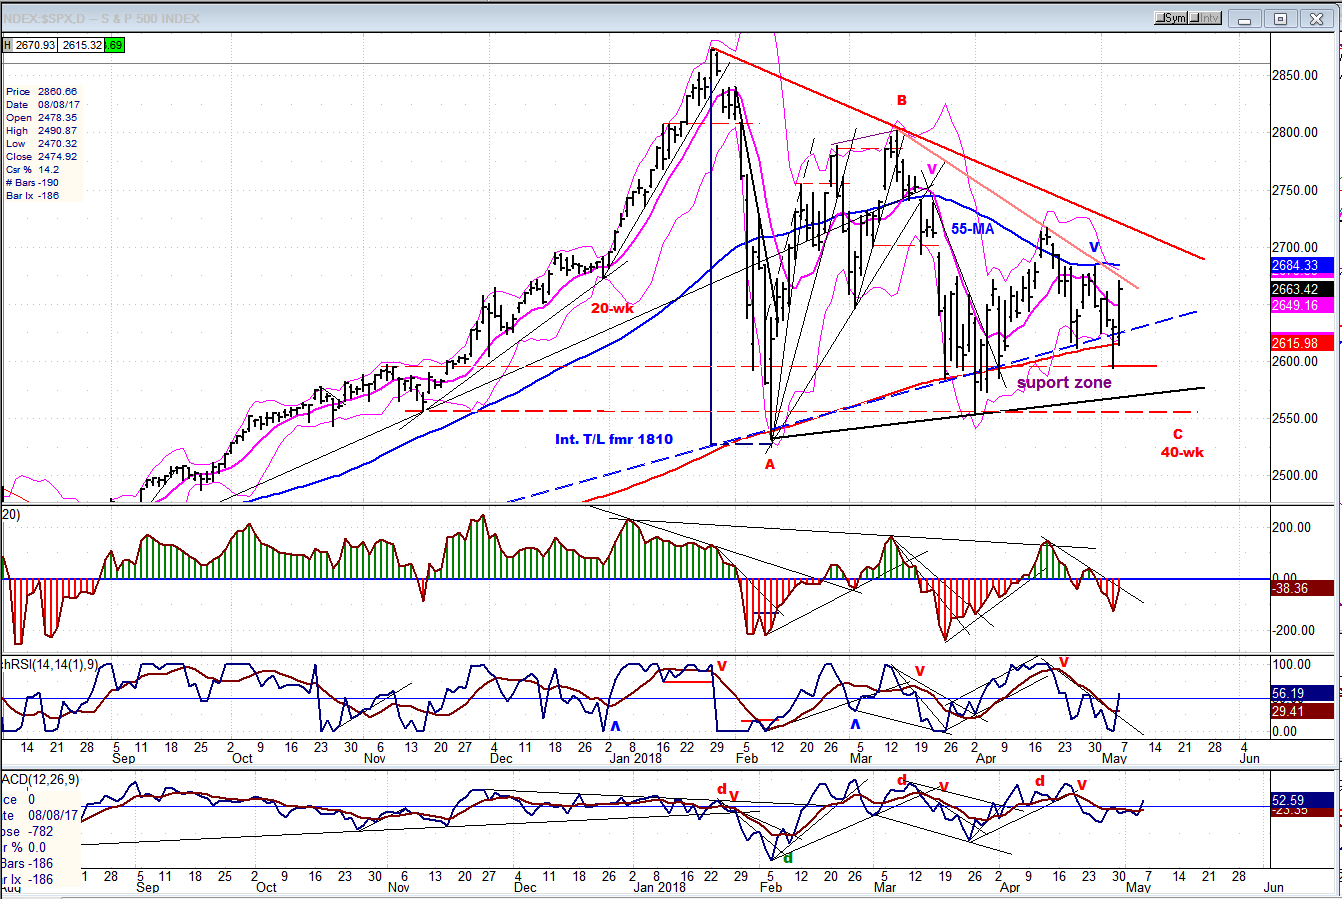
SPX Daily Chart
Last week, I mentioned that price action on the downside had basically been contained by the 200-DMA and recently, by the 55-DMA on the upside. Last Thursday SPX dipped below the 200-DMA for the second time since its 2533 low but, once again, was not able to close below it and rallied sharply on Friday. Also last week, I drew a support zone on the chart represented by two parallel red dashed lines which again proved valid with Thursday’s low finding support on the upper parallel. While these factors have contained previous declines, it is possible that they will prove unable to resist the downward pressure of the final thrust of the 40-wk cycle as it makes its low.
Since the early April low of 2554, the rallies have not been able to reach the primary downtrend line and their tops have formed a secondary downtrend line which has contained prices on three separate occasions. Friday’s strong two-day rebound of 76 points stopped just below it, and the index pulled back eleven points in the last hour. There is a fair chance that the rally from 2695 on Thursday has already topped, but since minor cycle lows are still two or three days away, we could see a little more distribution in this area before rolling over.
It is not clear just how low the final down-thrust of the 40-wk cycle will take us, but this should become more evident after this minor top has given us a reversal, and this information will be passed on to subscribers as soon as it becomes available.
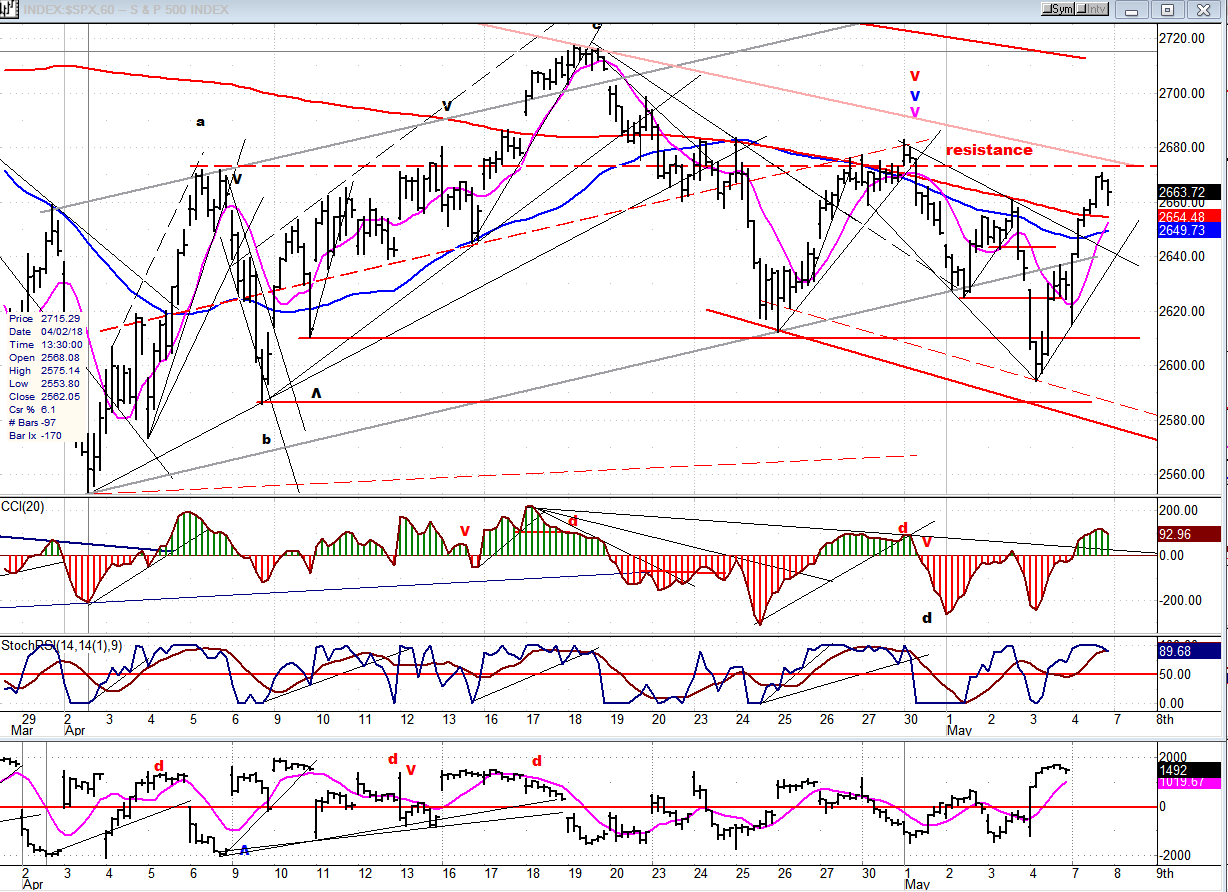
SPX Hourly Chart
When SPX rallied above 2675, it gave hope to the bulls that the correction was over and that the index was on its way to a new high; but it did not stay there long and soon retraced back toward the previous lows. So far, it has found buyers just below 2600; but if the 40-wk cycle still has a couple of weeks to run before bottoming, the odds are pretty good that the final low will be closer to 2553. That will depend on whether the intermediate cycle ends in a climactic flourish, or just a whimper. The next two weeks should give us a little more insight into the shape of the final decline.
There was a strong rally after Thursday’s sharp dip to 2595. I believe that the 45-td cycle was responsible for that low. A similar low has taken place at regular intervals in the past, but it has not caused that much of a ripple unless it was associated with a larger cycle. In this case, it was the 40-wk which added downward pressure.
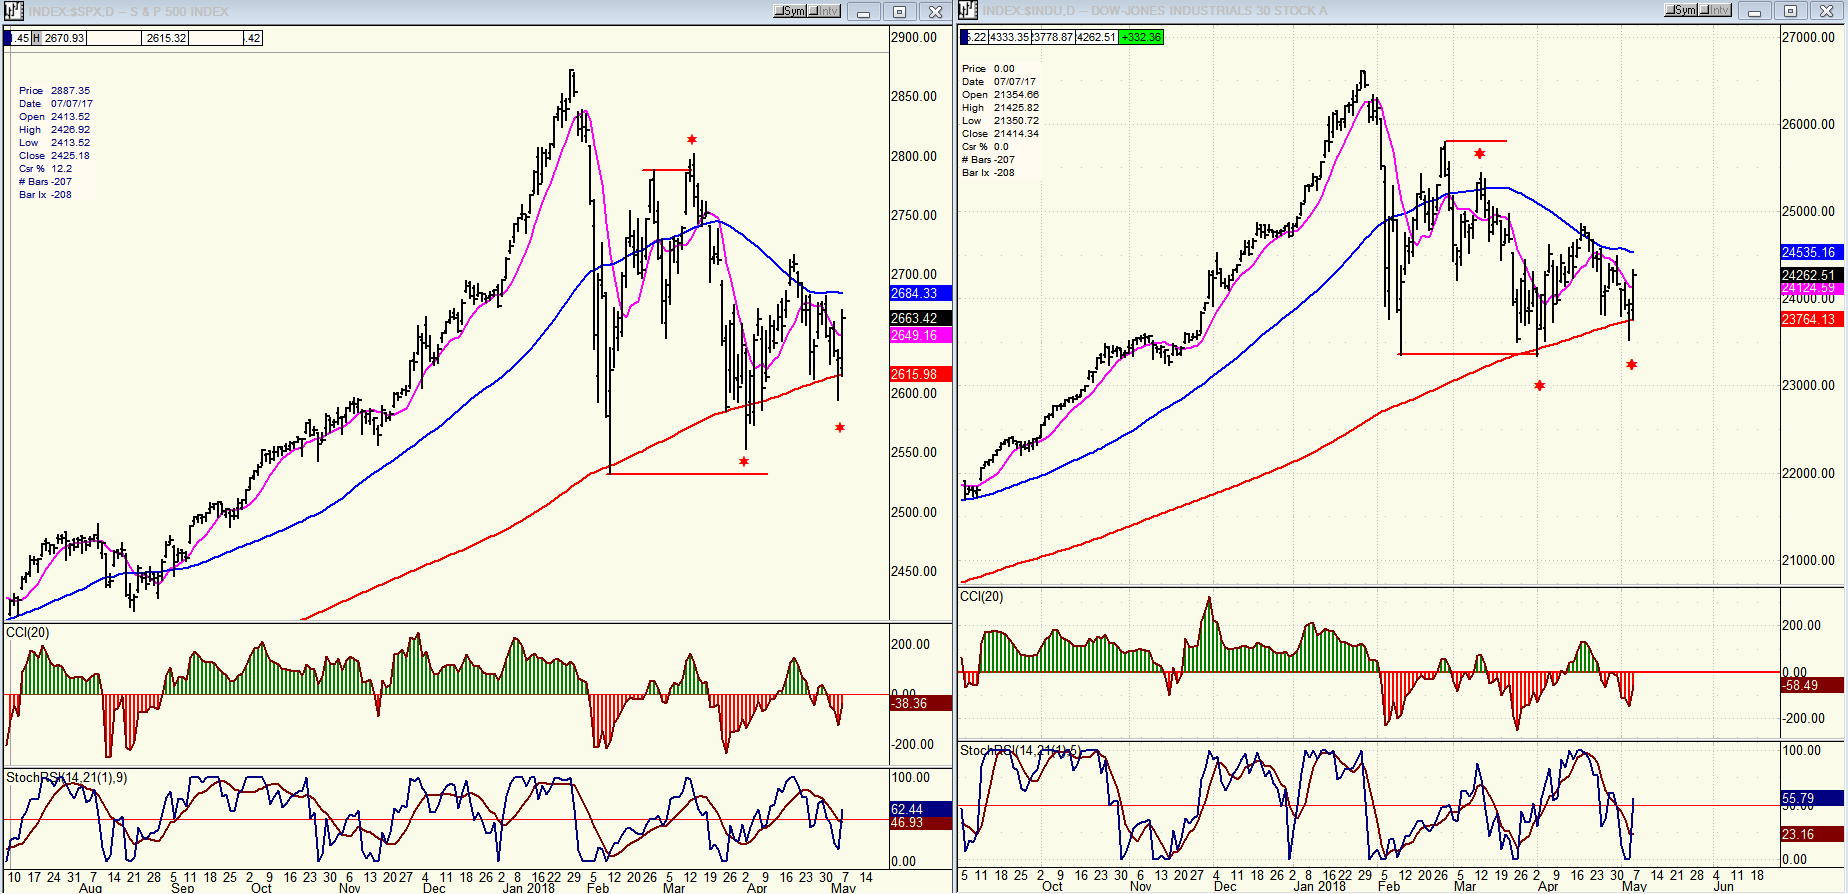
SPX vs. INDU (Daily Charts)
At the beginning of the correction, SPX (left) and the DJIA were in sync. On the first rally from the low, DJIA started to diverge negatively from SPX (*) and this continued with the next low. Now, DJIA has gotten back in sync with SPX. The implication is that when INDU was diverging, it was likely that the correction had farther to go. Now, both indexes being in sync tells us that the end of the correction is near.
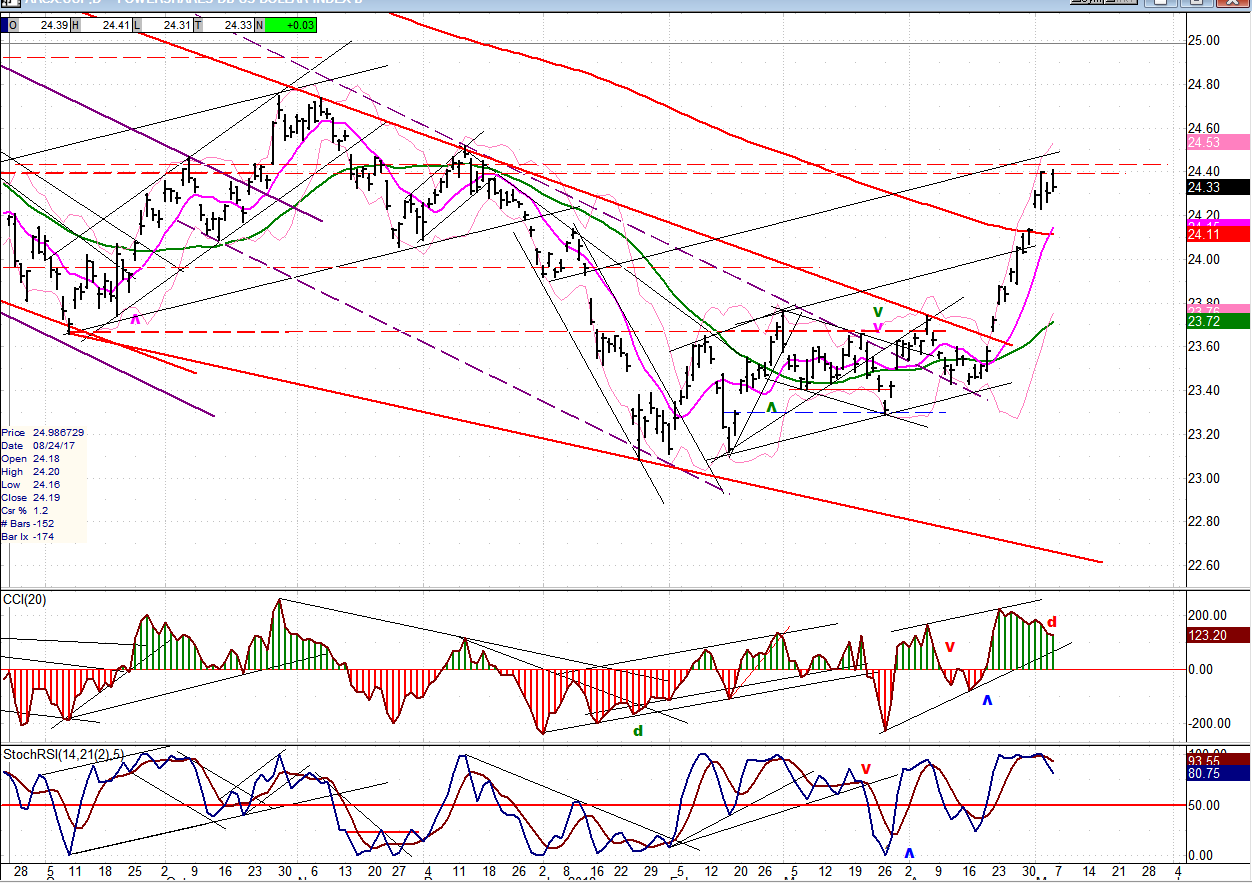
UUP (Dollar ETF) Weekly
UUP has had a good run over the past three weeks, but it is close to being over. The price has reached an overhead resistance level which is going to stop its advance, and this is being confirmed by the indicators which have developed increasing negative divergence. A retracement should find support at 24.00 and, if it continues, at about 23.75.
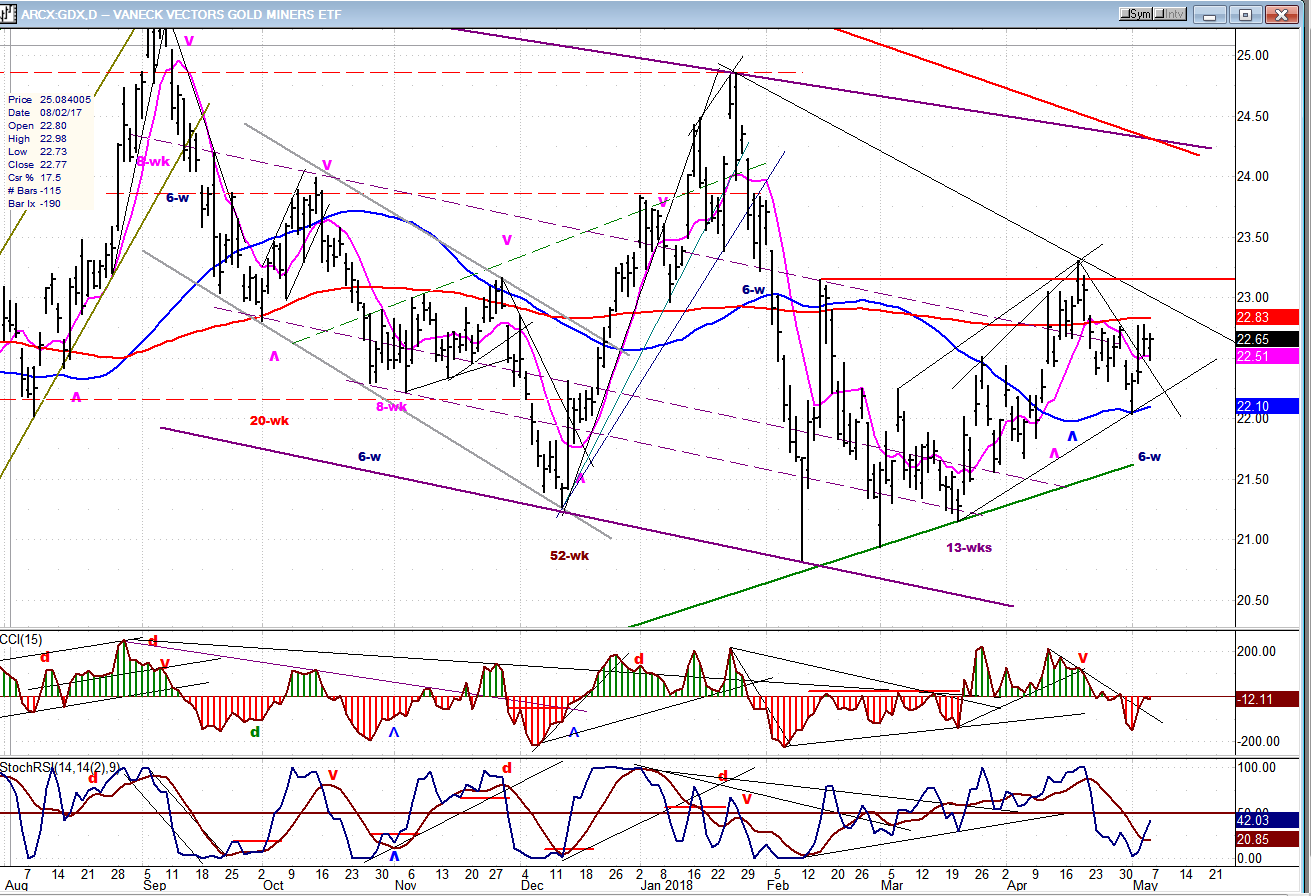
GDX (Gold Miners ETF)
Ever since it ended its correction in February, GDX has been engaged in a measured uptrend which, nevertheless, has bullish implications. This inaction has almost put us to sleep, but we should be wide awake now, because the next time GDX challenges the initial February high of 23.15, it is likely to break-out and quickly run up to about 25.50, and perhaps higher. GDX has most likely been waiting for UUP to stop its advance and to start correcting which, as stated above, appears to be imminent.
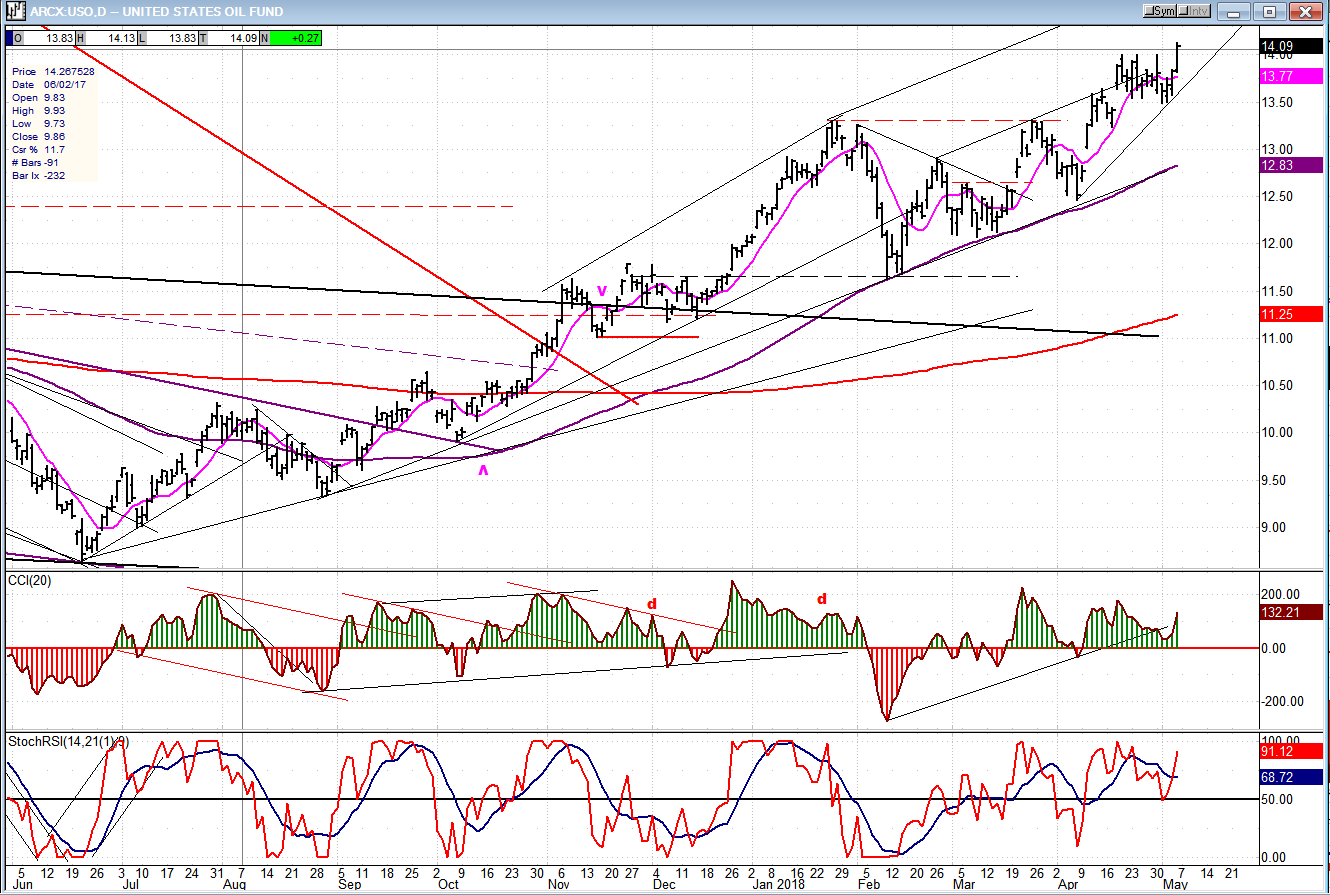
USO (United States Oil Fund)
USO is still bullish and is most likely reaching for its 14.50-15 short-term projection before starting to correct. That correction could take it back to about 11.50-12.00.
Summary
SPX is approaching the end of its correction which is deemed to be in about two weeks. There are two possible targets for the final low: one which would slightly exceed the former low of 1553, and the other which would find support at a higher level.
*********
FREE TRIAL SUBSCRIPTON
With a trial subscription, you will have access to the same information that is given to paid subscribers, but for a limited time period. I think you will find that knowing how far a move can carry is one of the most useful benefits of this service, whether you are a trader or an investor -- especially when this price target is confirmed by reliable indicators which give advance warning of a market top or bottom. Furthermore, cycle analysis adds the all- important time element to the above price projections.
For a FREE 4-week trial, further subscription options, payment plans, and for general information, I encourage you to visit my website at www.marketurningpoints.com.
The above comments about the financial markets are based purely on what I consider to be sound technical analysis principles. They represent my own opinion and are not meant to be construed as trading or investment advice, but are offered as an analytical point of view which might be of interest to those who follow stock market cycles and technical analysis.
share
share
share
share
share

When Andre Gratian was a stock broker years ago, a friend introduced him to technical analysis of the market. Consequently, it is not an exaggeration to say that Andre fell in love with this approach! Ever since then, it has become an increasingly important part of his professional life. Gratian has studied the works of Wyckoff, Edwards & Magee, Edward J. Dewey (cycles) and many others. However, one of my most profitable undertaking has probably been to study Point & Figure charting, which he finds invaluable in analyzing stocks and indices. If he were restricted to one methodology, this is the one that he would choose. This well-rounded background has given him what he feels to be a special insight into the stock market, facilitating the recognition of meaningful patterns and the ‘turning points’ in all trends, whether they be short or long term. Andre feels very comfortable discussing the stock market and passing on meaningful information to others. His subscribers include individuals and money managers throughout the world. Moreover, his Newsletters are currently published on several financial sites, here and abroad.


