Technical Analysis Of The Markets


Current Position of the Market
SPX: Long-term trend – The bull market is continuing with a top expected in the low 3000s.
Intermediate trend – A correction in the intermediate trend should keep prices above the 2680 level.
Analysis of the short-term trend is done on a daily basis with the help of hourly charts. It is an important adjunct to the analysis of daily and weekly charts which discusses the course of longer market trends.
Selling on the News
Market Overview
In recent newsletters I have pointed to negative divergence building up in the various market indices at the daily time frame. This is always suggestive of an approaching correction and one should be on guard for it. On Friday, traders took advantage of some good news to unload their positions. The selling occurred at a logical level in SPX and there is no reason to expect more than a short-term correction at this time, since there is no significant distribution pattern at the top. That does not mean that one could not form over the next few days, signaling that lower prices should then be expected before the index moves to its next higher projection level.
In fact, the damage done to technical indicators in the IWM, NDX and SPX points to something more than a one or two day affair. Also, the minor cycle bottoming on Friday, and responsible for the 40-pont pull-back, far exceeded its normal potential, suggesting that something larger is in play. After a short period of consolidation, I would expect the market to move lower, but with SPX remaining well above its 2691 former correction low.
Chart Analysis (The charts that are shown below are courtesy of QCharts)
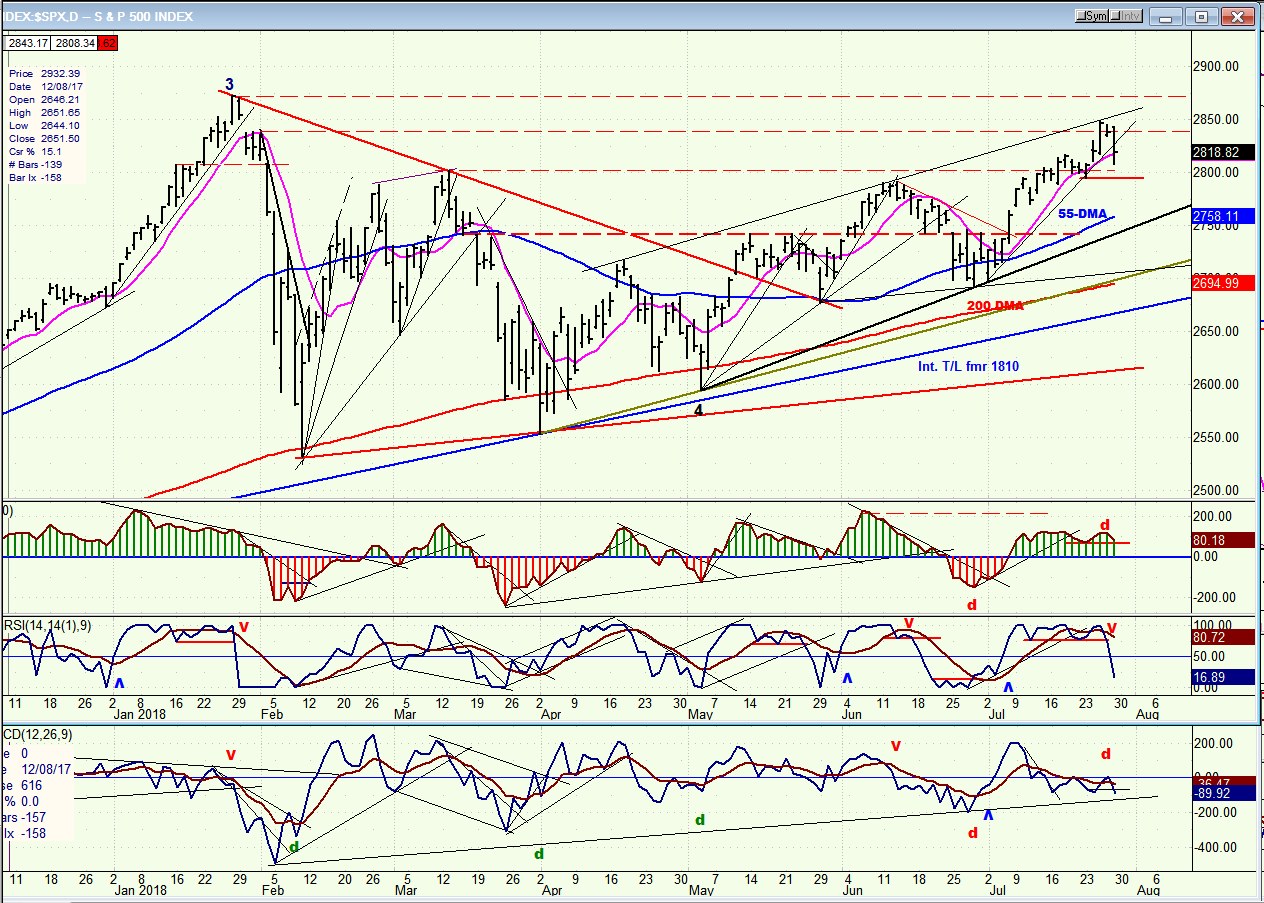
SPX Daily Chart
This past Wednesday, SPX approached the top of its channel and met with resistance. This stopped the advance, and a congestion pattern started to form continuing into the next day. By Friday, it became clear that this was distribution, and the minor cycle due to make its low that day started a pull-back which accelerated after it broke below the 2830 support and the short-term uptrend line from 2691.
The top was marked by a double showing of negative divergence on the CCI and A/Ds, rendering that price level even more prone to become a short-term top. With the count produced by the overhead distribution pattern having been essentially satisfied with Friday’s decline, and the minor cycle having made its low, one would expect some sort of rebound to take place as long as prices hold above the horizontal red line. But a rebound is all we can reasonably expect at this time. The damage done to the daily indicators, especially to those of the IWM and NDX, but also to the SPX, will take a little while to repair and this will most likely be accomplished when positive divergence returns after a new low has been struck.
Whether or not this is something more than just a short-term correction can be decided after we determine if the next rally is an extension of this uptrend, or if it only creates additional distribution for a larger, subsequent correction.
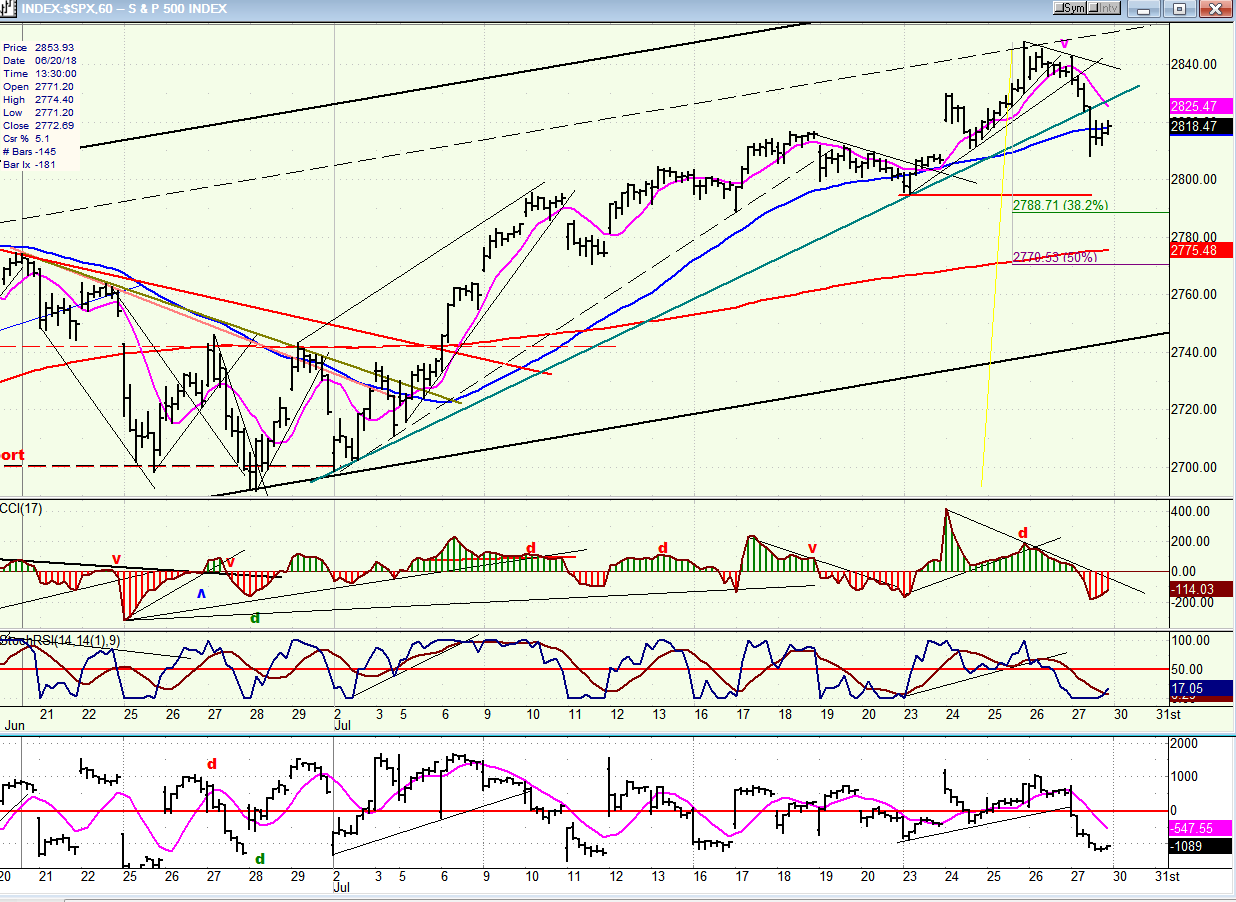
SPX Hourly Chart
The hourly chart shows that the index did not quite make it to the top of the channel, but found resistance at a parallel line. In any case, it had reached its count and was ready to correct. Shortly after making its high, it started to break some minor trend lines and could not stop when it reached the primary one from the 2691 low, thereby confirming that it had started to correct that previous uptrend. Besides having divergence showing at the daily indicator level, divergence was clearly showing at the hourly level as well, reinforcing the view that we were about to get a reversal.
I have marked the .382 and .50 Fibonacci retracement points on the chart. A pull back to one of those levels (2789 & 2770) would be normal. Since both are below the red trend line drawn from the last short-term low, it’s very likely that it will be broken before the correction is over. So far, there has not been enough congestion formed to give us a count for a decline to those levels. Therefore, we can expect a rebound from the current 2809 low point (or from slightly lower) before the decline resumes.
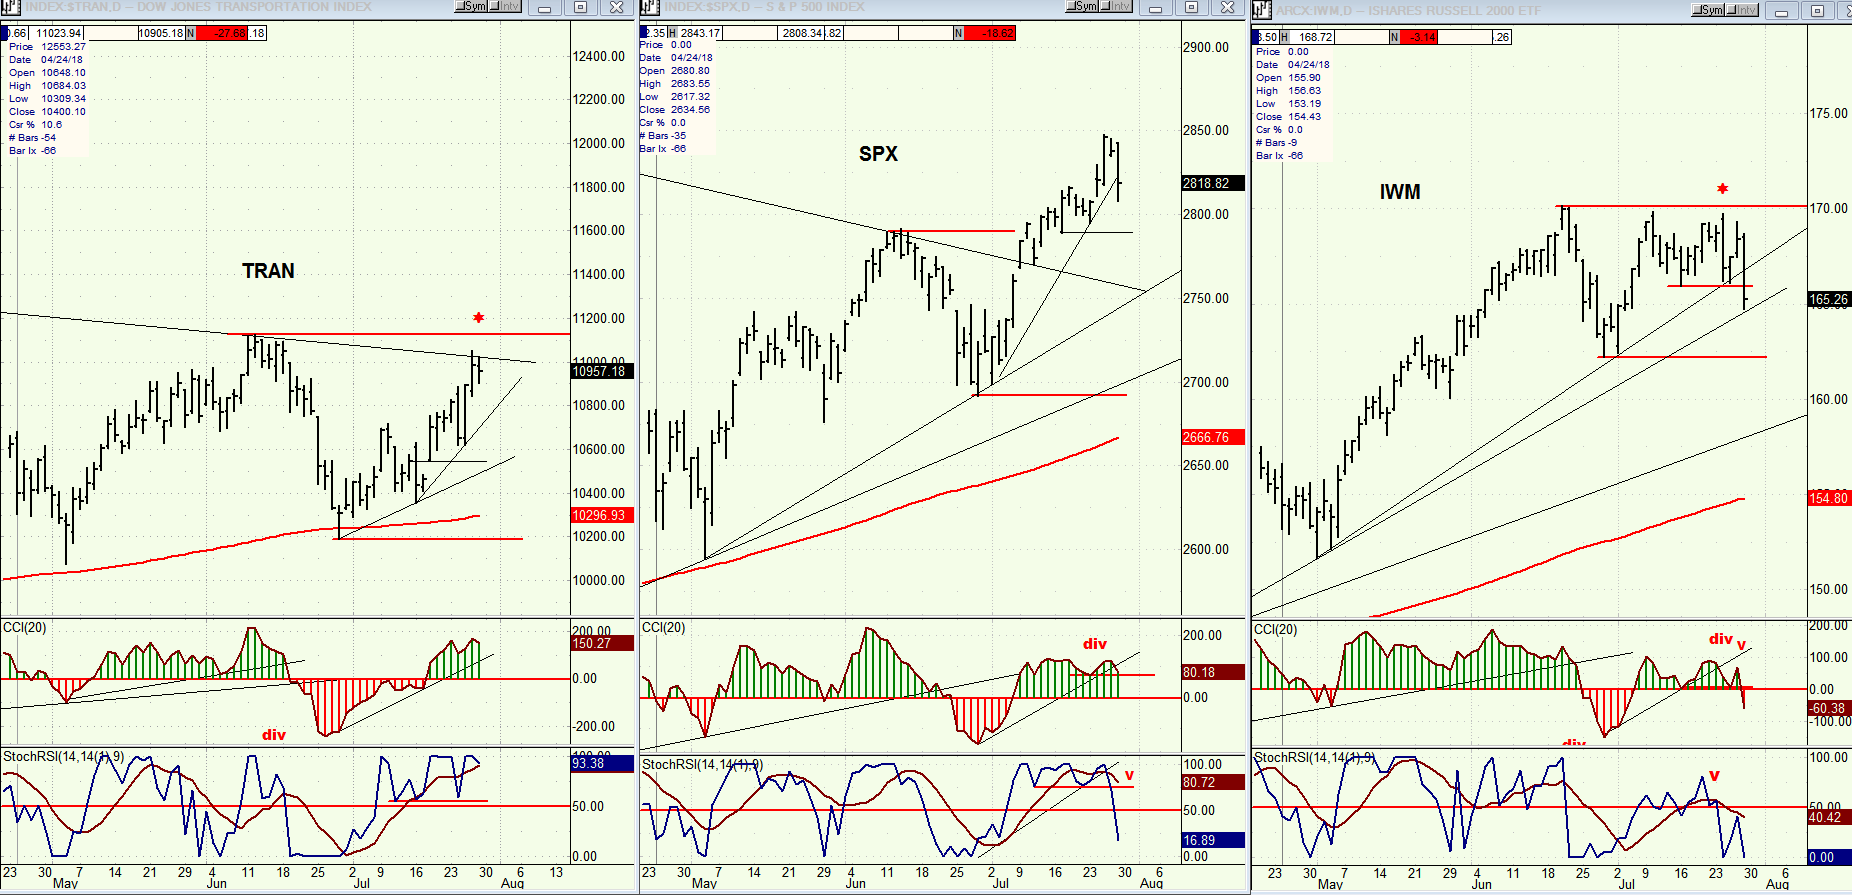
TRAN,SPX, IWM (Daily)
This was another reason for concern that a correction was due. Both the TRAN and IWM are proven leading indicators. TRAN has been lagging SPX for some time, but recently, IWM made it clear that it had stopped going up while SPX, fueled by a Nasdaq frenzy, continued to move higher. It is normal for such disparity to be adjusted with a correction in SPX and this is probably what is happening. P&F suggests that IWM is ready to adjust down to at least 160. That, and a correction in tech stocks which comprise the NDX should be another reason for SPX to follow suit.
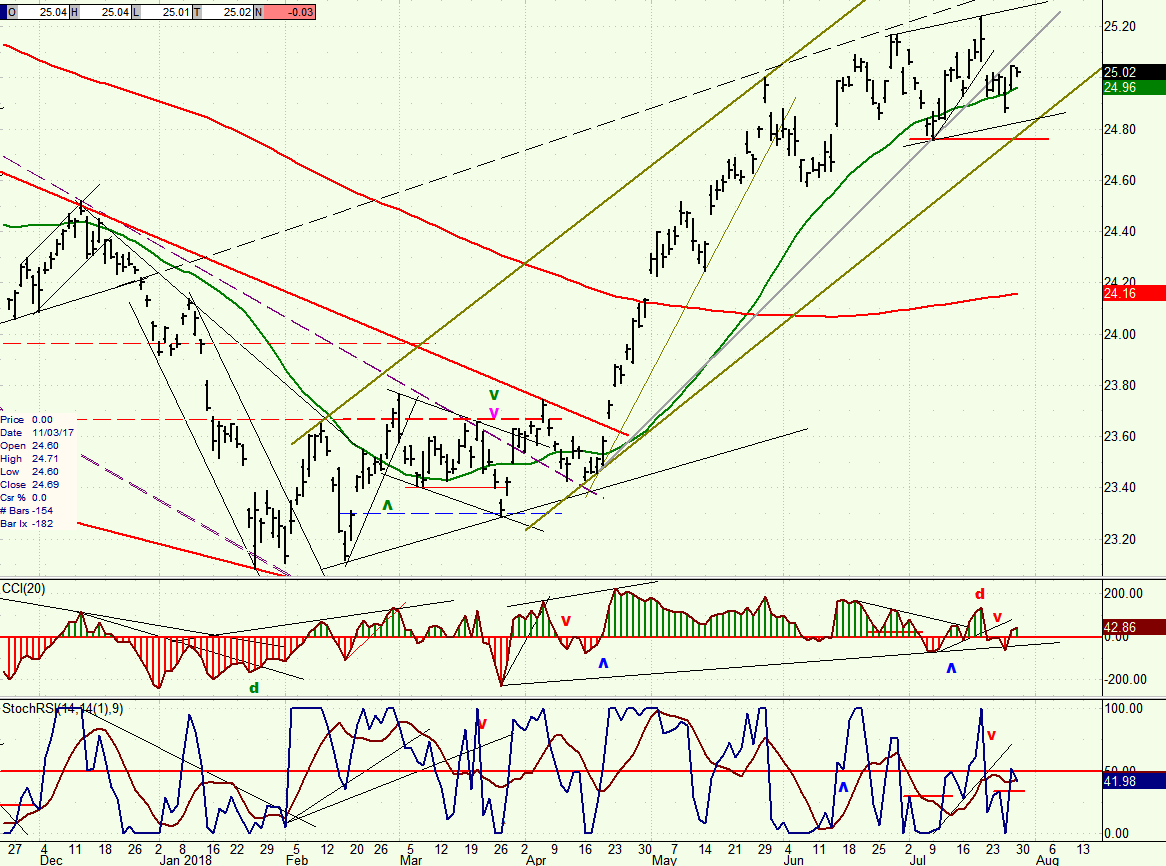
UUP (Dollar ETF) Weekly
UUP continues to act as if it has started a consolidation, and perhaps a correction. The index closely follows the green 34-DMA. It has rested on it for a week without being able to push itself away, as it did in early July. Time is of the essence and it will soon have to make decision. If it should break below, the next show of weakness would be to move outside of its up-channel. Even if it does, its downside risk may be limited to 24.50 or slightly lower, for the time being.
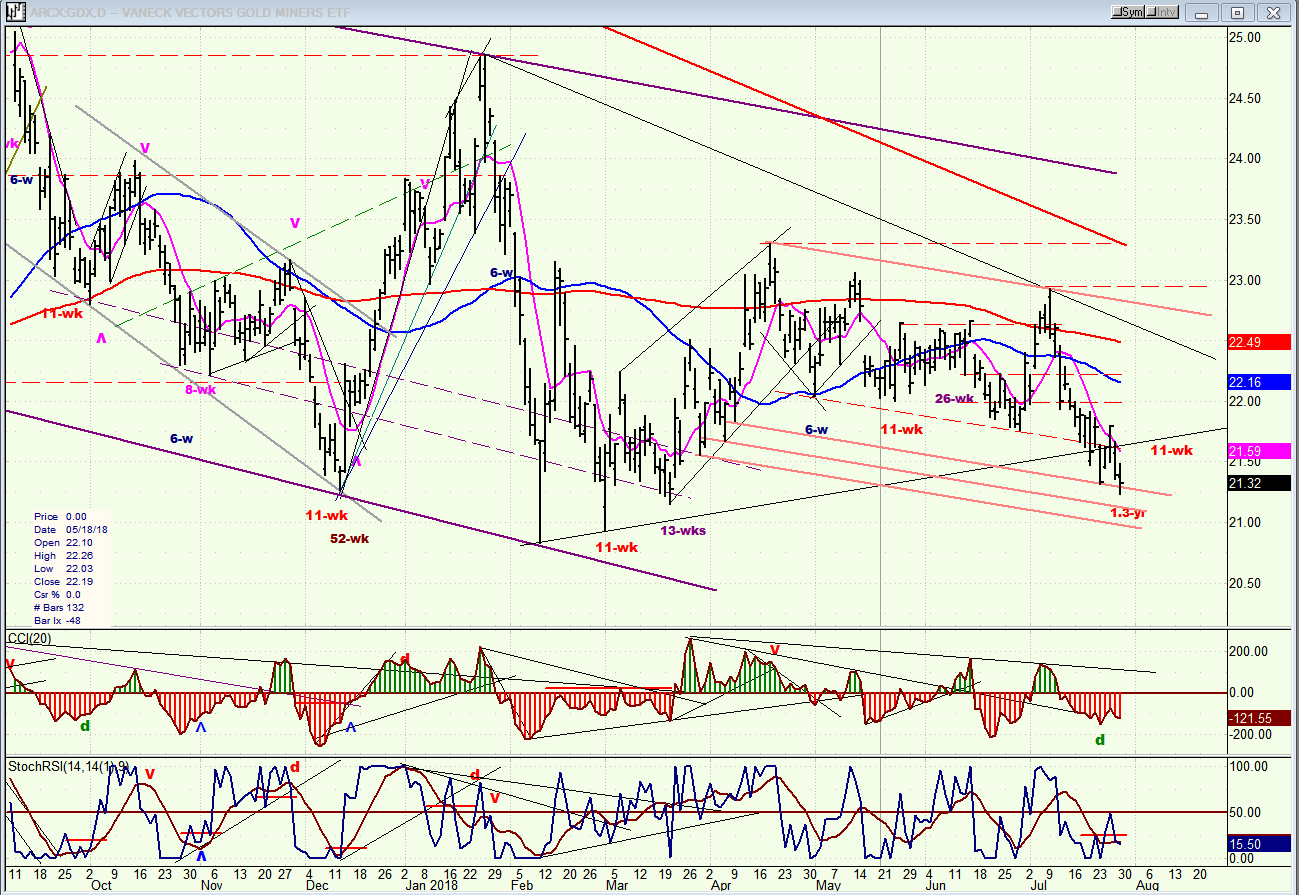
GDX (Gold Miners ETF)
Currently, GDX has a close tie to UUP. Although GDX looks sold out (on Friday a new low was made on a few hundred shares which were quickly bought) and ready for a rebound, the extent of any rally from here will be limited by a reluctant correction in UUP.
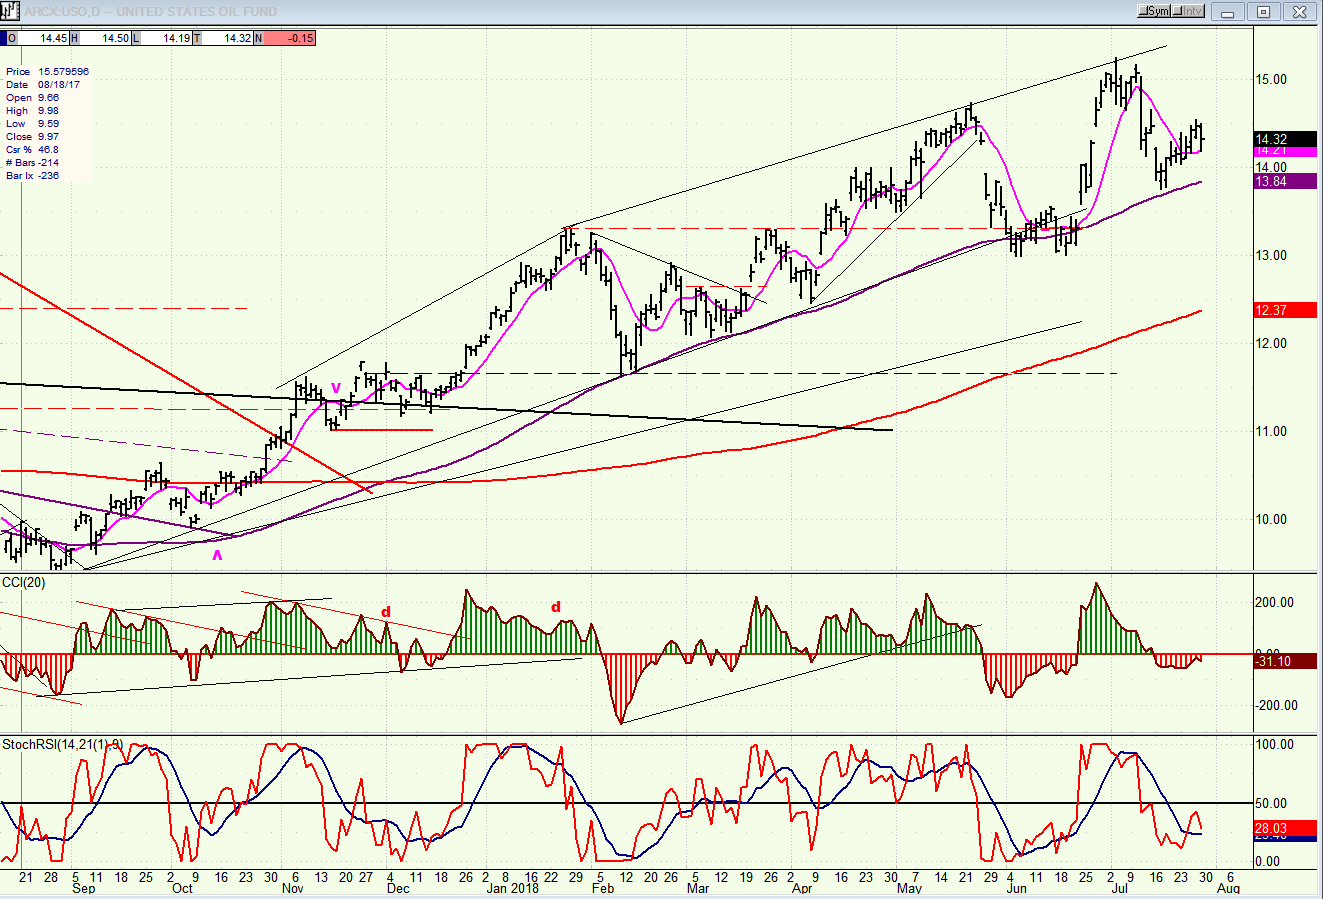
USO (United States Oil Fund)
USO looks as if it has started a correction. It has consistantly relied on its 89-DMA for support and if it breaks it, it would be susceptible to a move down to about 12.50.
Summary
The warning signs that SPX was ready to correct are coming to fruition, and Friday’s pull-back has caused enough short-term technical damage to suggest that it may take about a week for it to be repaired.
FREE TRIAL SUBSCRIPTON
With a trial subscription, you will have access to the same information that is given to paid subscribers, but for a limited time period. I think you will find that knowing how far a move can carry is one of the most useful benefits of this service, whether you are a trader or an investor -- especially when this price target is confirmed by reliable indicators which give advance warning of a market top or bottom. Furthermore, cycle analysis adds the all- important time element to the above price projections.
For a FREE 4-week trial, further subscription options, payment plans, and for general information, I encourage you to visit my website at www.marketurningpoints.com.
The above comments about the financial markets are based purely on what I consider to be sound technical analysis principles. They represent my own opinion and are not meant to be construed as trading or investment advice, but are offered as an analytical point of view which might be of interest to those who follow stock market cycles and technical analysis.
*********

When Andre Gratian was a stock broker years ago, a friend introduced him to technical analysis of the market. Consequently, it is not an exaggeration to say that Andre fell in love with this approach! Ever since then, it has become an increasingly important part of his professional life. Gratian has studied the works of Wyckoff, Edwards & Magee, Edward J. Dewey (cycles) and many others. However, one of my most profitable undertaking has probably been to study Point & Figure charting, which he finds invaluable in analyzing stocks and indices. If he were restricted to one methodology, this is the one that he would choose. This well-rounded background has given him what he feels to be a special insight into the stock market, facilitating the recognition of meaningful patterns and the ‘turning points’ in all trends, whether they be short or long term. Andre feels very comfortable discussing the stock market and passing on meaningful information to others. His subscribers include individuals and money managers throughout the world. Moreover, his Newsletters are currently published on several financial sites, here and abroad.


