Technical Analysis Of The Markets
 share
share
 share
share
 share
share
 share
share
 share
share
Current Position of the Market
SPX: Long-term trend – The bull market is continuing with a top expected in the low 3000s.
Intermediate trend – Limited uptrend
Analysis of the short-term trend is done on a daily basis with the help of hourly charts. It is an important adjunct to the analysis of daily and weekly charts which discusses the course of longer market trends.
A Sluggish New High
Market Overview
Last Monday, SPX traded up to 2873.93 before reversing. For all the fanfare about achieving a new all-time high, this surpassed the January high by less than a point! The index had a shallow correction for the rest of the week and, on Friday, it made another new high to 2876.16, surpassing the former high of last Monday by less than three points. It should also be said that this level was reached halfway through the session and minor consolidation ensued for the rest of the day instead of pushing ahead aggressively.
NDX tacked on a decent 72-point day, but remains 25-points below its former all-time high which was reached on 7/25, and IWM, which made a new all-time high when it broke out of a 5-week consolidation phase four days ago, did make a new high, but only by a fraction. As for DJIA, although it had a 133-point day, it is still a laggard index by a fairly wide margin.
It is important to point out that the volume is drying up; even in the indexes that are making new all-time highs. The last time I checked my TA-101 manual, this is considered bearish. So what’s going on? Well, for one thing, September and October are considered to be the worst months of the year for stocks, and that can hardly be motivation for traders to buy aggressively. Secondly, there is a 20-wk cycle bottoming in that time frame. And also, since nothing was achieved during the trade talks between US and China and, since Trump’s next move to impose another 200 billion dollars in tariffs on China could be implemented as early as next month, a little caveat seems appropriate.
It does not mean that we can’t go a few points higher, but starting next week, one should start erring on the side of caution instead of heeding the call of bullish sirens.
Chart Analysis (The charts that are shown below are courtesy of QCharts)
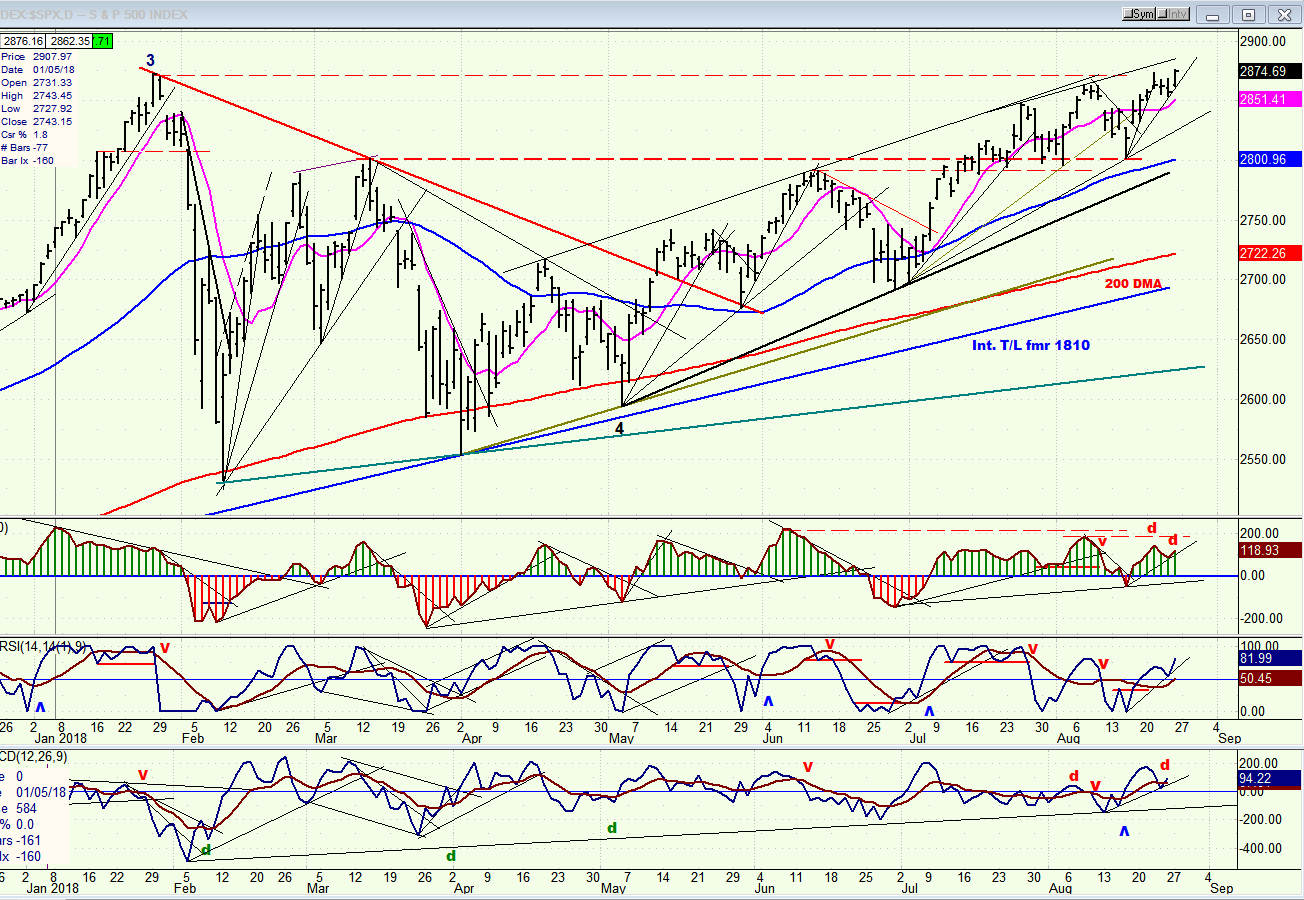
SPX Daily Chart
SPX started an uptrend after the January correction came to an end; and last week a new all-time high was created (twice) – but on much reduced volume. The fact that the index could only scratch out a minimal new high on a drop in volume can hardly be considered bullish and, unless this condition is radically altered in the next few days, a new correction should soon be on the way.
As you can see on the chart, the uptrend is nearing the top channel line which has contained prices ever since it began. Considering the conditions under which we are again approaching it, we should not expect a dramatic move through the top, which would be required in order to change the market mood. Add to this the profuse negative divergence which appears in the bottom oscillators, and the fact that we are days away from entering the most bearish period of the year for stocks, there is little more to say. Only the most hardened perma-bulls can remain optimistic under these conditions.
Still, “it ain’t over ‘til it’s over!” So, let’s see how much more of the grind materializes over the next few days. The last consolidation which took place above 2855 this past week promises a few more points on the upside, so let’s not rush the market. For a confirmed reversal, we would need to break the short-term trend line from 2802, followed by a move below 2854 on negative breadth. And, to made sure that the incipient decline has legs, all daily oscillators should turn negative as well. Incidentally, negative divergence is not confined to the daily indicators. It is beginning to show up in the weekly ones as well.
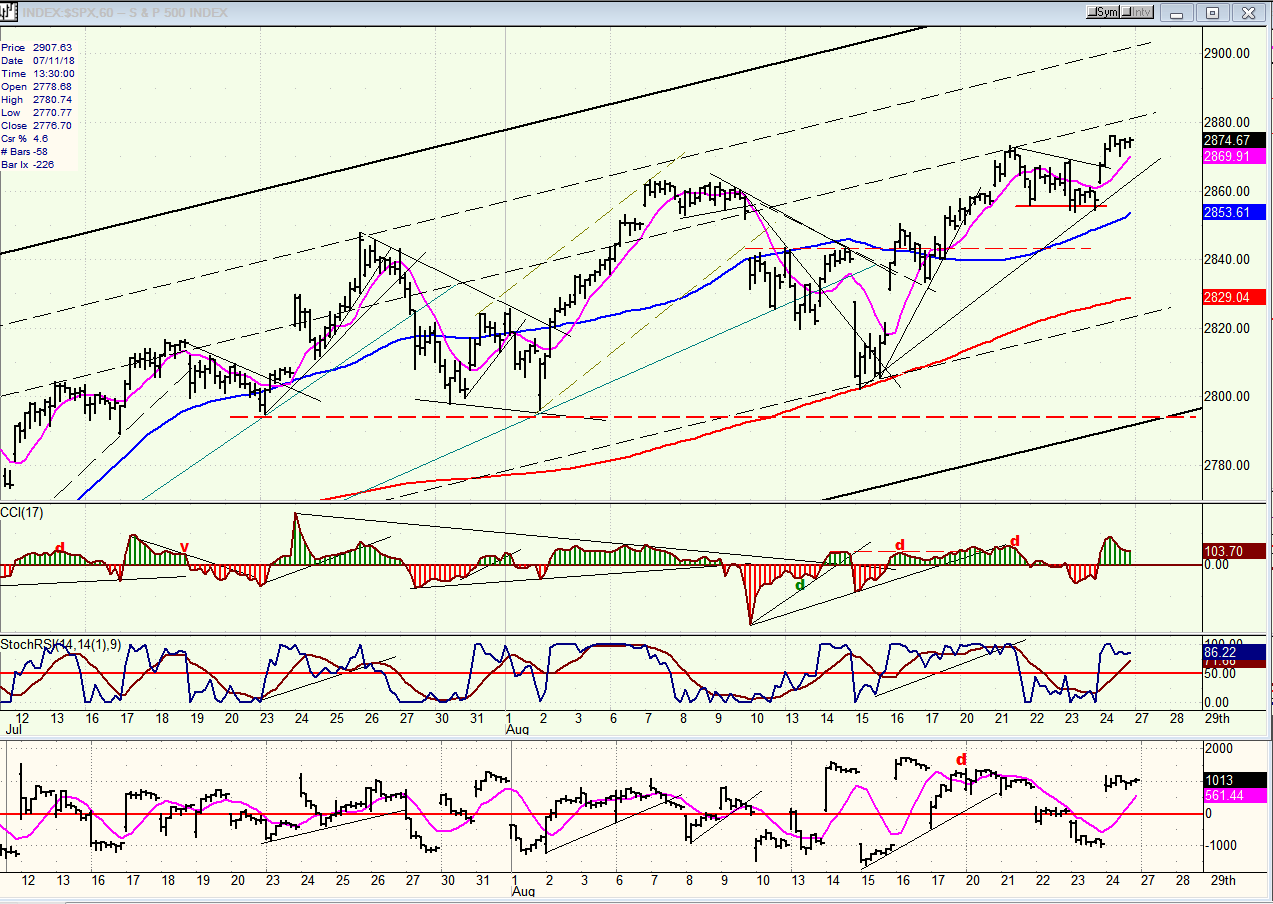
SPX Hourly Chart
The hourly chart gives us a different perspective. On it, SPX is not nearing the top of the channel (which is the heavy line at the top), but a parallel to that top line which is also expected to provide resistance (if not that one, then the next dashed line above). For a reversal to occur, shortly afterward the index would have to break below the minor uptrend line and continue below 2853 and lower.
Since the 20-wk cycle is expected to make its low at some time between late September and mid-October, if the correction did last into that time frame, one would have to assume that the 2800 level would stand a good chance of being broken. And, if so, we can get some idea of the decline’s extent based on the amount of distribution that will have been created above 2800.
I am not saying that this is exactly how things will progress over the next month or so but, based on the current market action, and assuming that the 20-wk cycle low is only four to six weeks away, that would be a pretty logical scenario to entertain.
The oscillators at the bottom of the chart do not look ready to issue a sell signal, and that allows for price to move a little higher before it reverses.
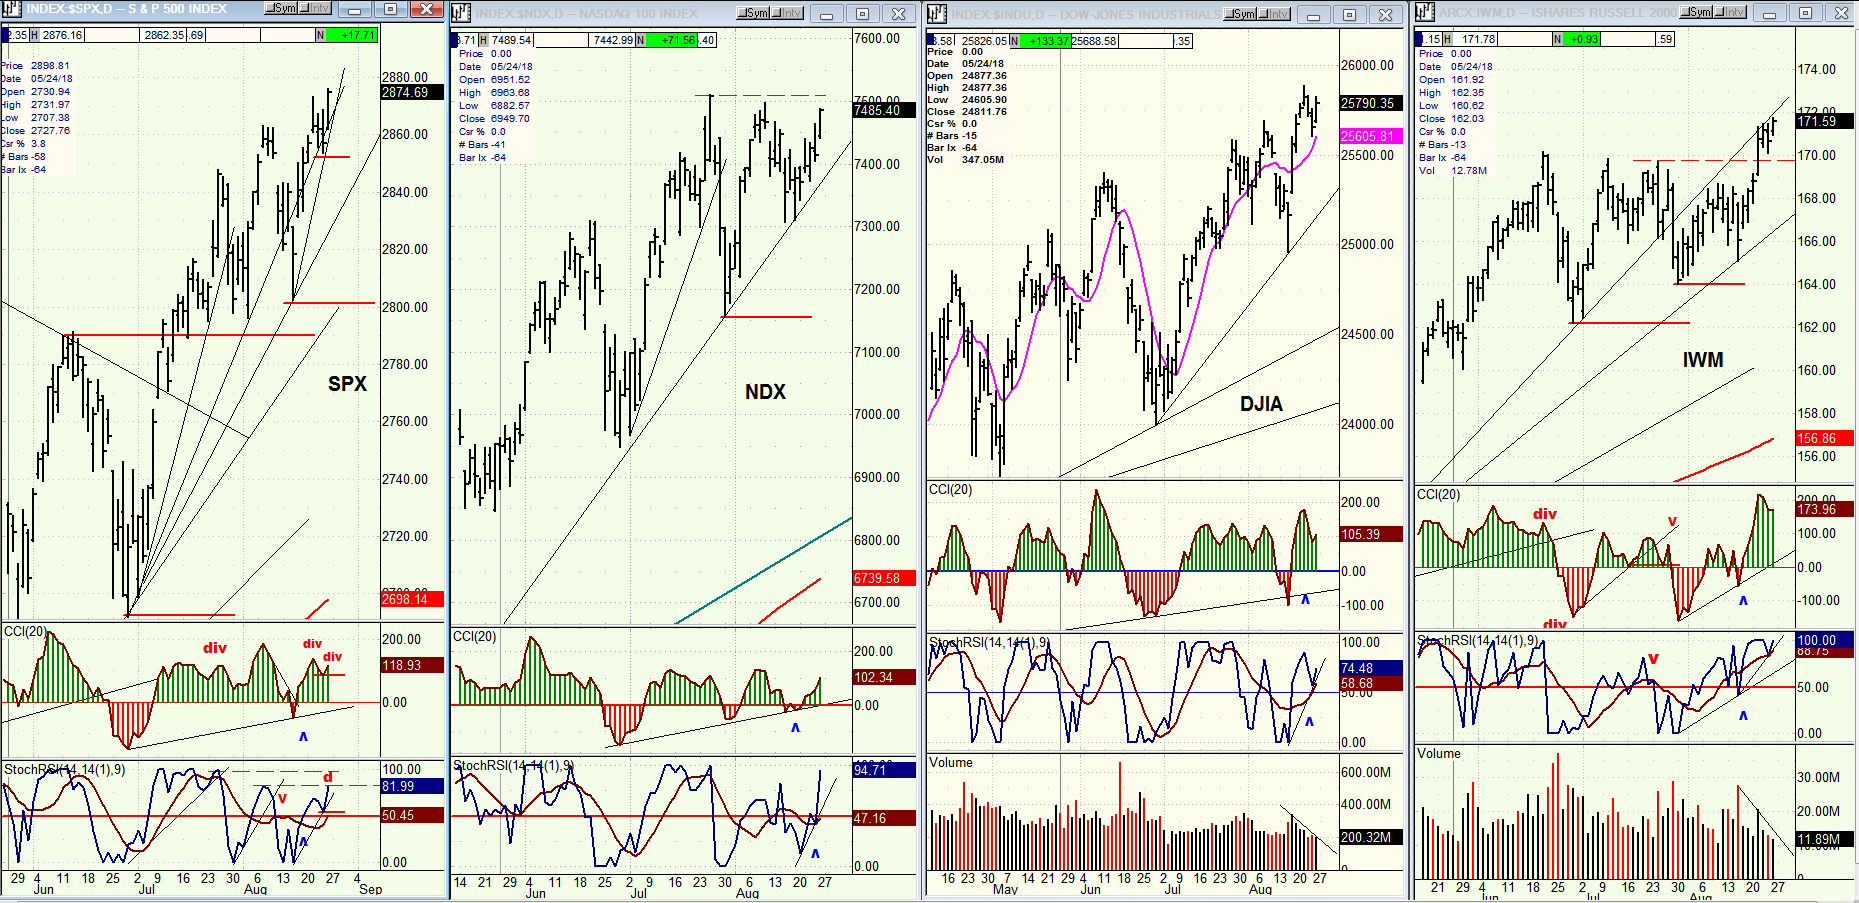
SPX, NDX, IWM (Daily)
I have added DJIA to get a better idea of how these principal maket components relate to one another over the short term. Keep in mind that since January, only two of them, SPX and IWM have made a new all-time high. The DJIA is the biggest laggard and it was also the only index which did not surpass Monday’s high on Friday while NDX, which was the first to make a new all-time high has now fallen behind the others, near-term. This lack of short-term coherence is probably not a big deal as long as all four are still essentially in an uptrend. But what is, is the volume pattern (which could only be provided for the last two). Notice how it has been falling over the past few days. This is of particular concern in IWM which is historically one of the most reliable market leaders. It was the first to make a new all-time high, but it has not been able to really follow through this past week, and now the volume is dropping off sharply.
We’ll give the market a little more time and with each day, it should become more and more revealing. If what I just pointed out has any meaning, market weakness should materialize over the near-term.
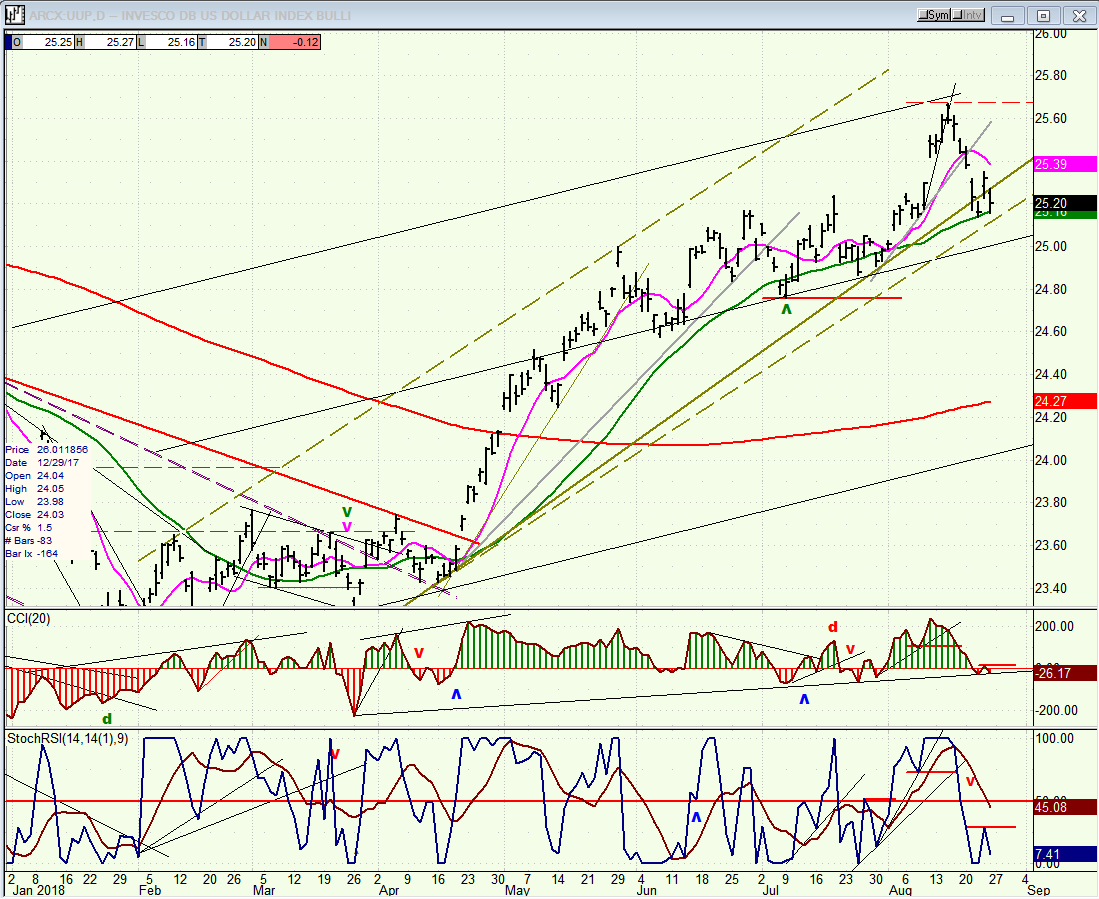
UUP (Dollar ETF) Daily
UUP reversed soon after reaching its 25.50 projection. Whether or not this is a short-term correction, the initial pull-back may be limited to about 25.00, after which the index will either consolidate to go higher, or go sideways for a while before starting a bigger downtrend.
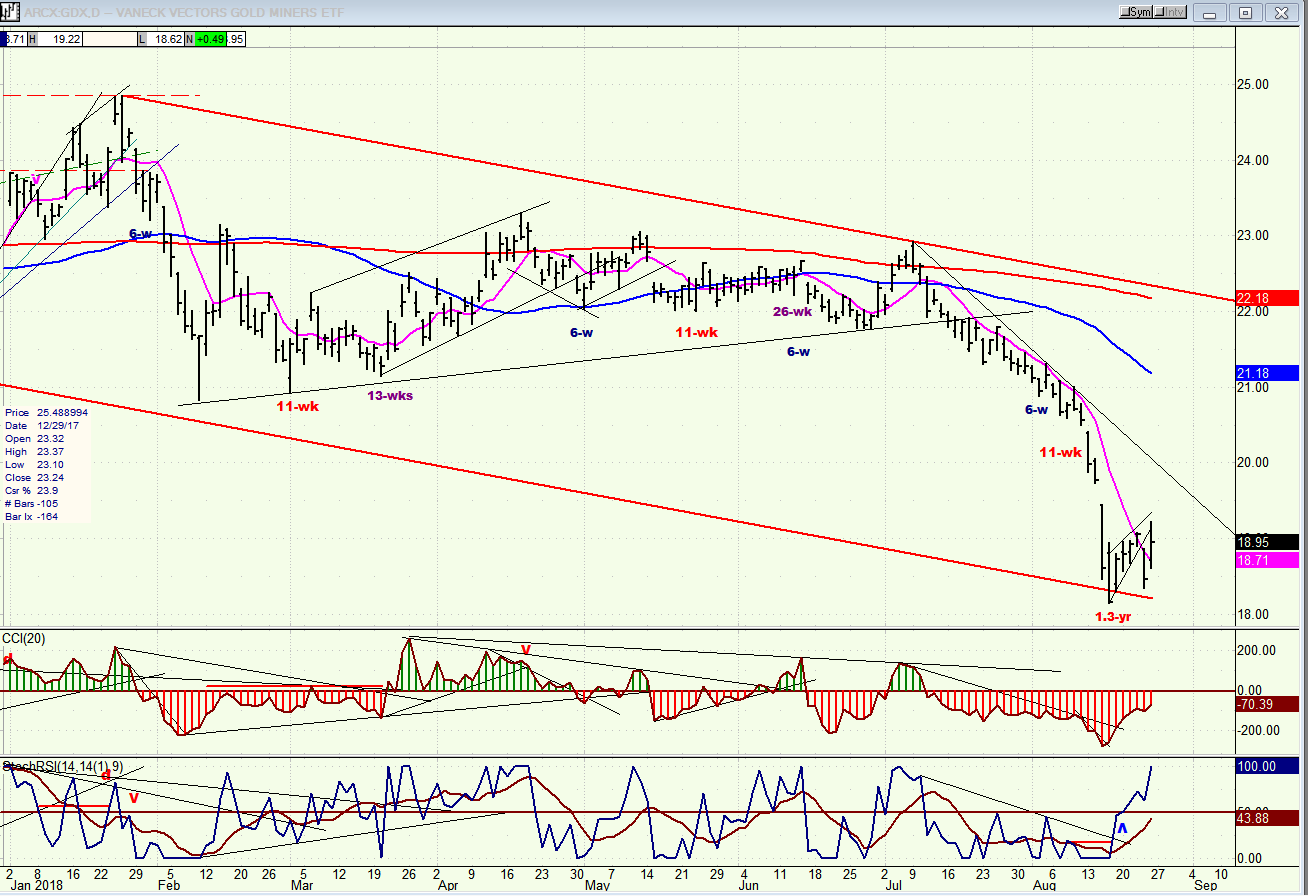
GDX (Gold Miners ETF)
GDX found support at the bottom of a large channel at the level of its 10/16 52-wk low. It may have to do some work in this area before it is capable of making much of a recovery and, in any case, its action will still essentially follow that of UUP’s (but in reverse!).
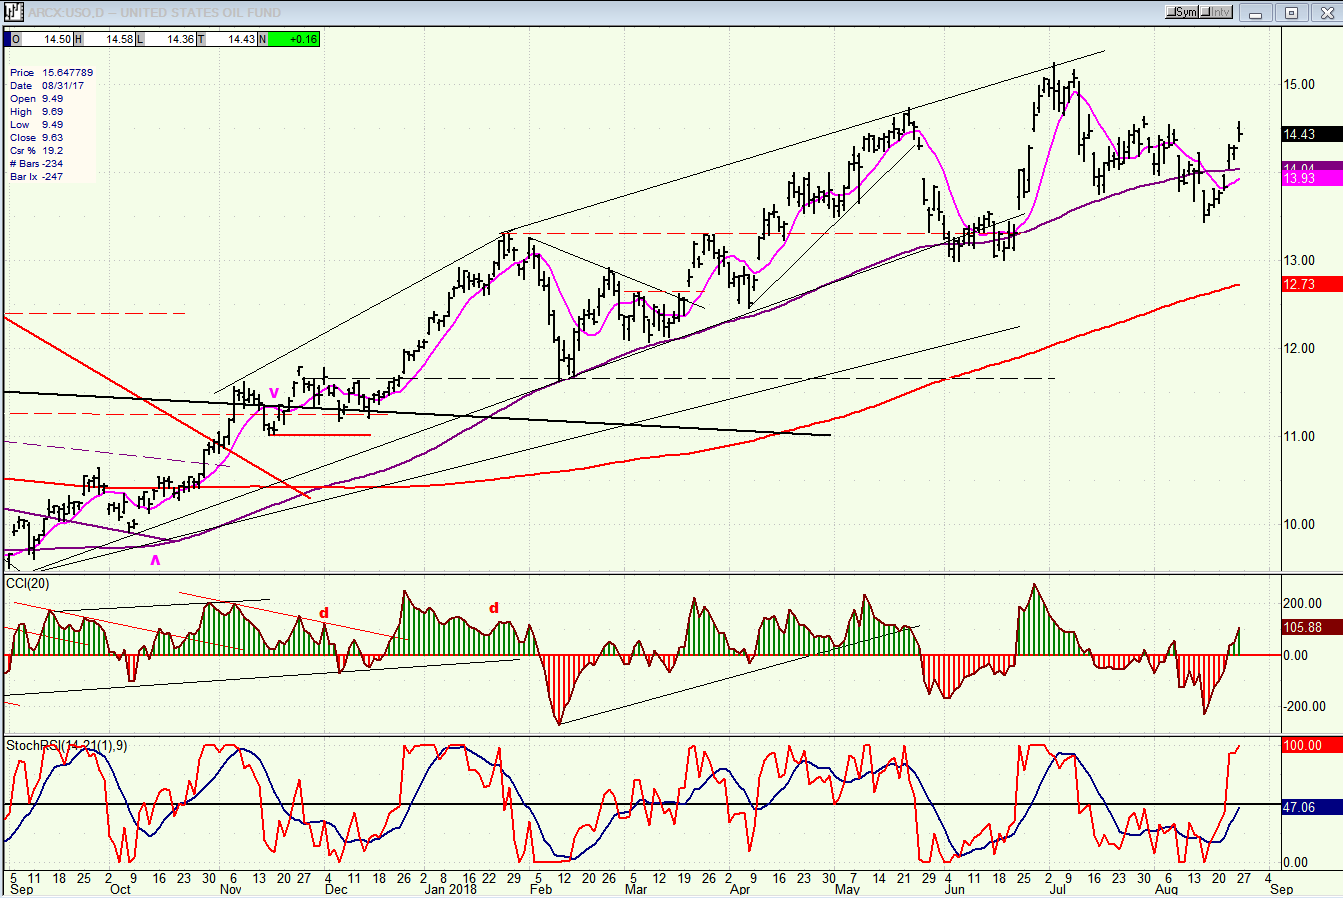
USO (United States Oil Fund)
USO had a good bounce over the past few days but is unlikely to embark on a continuation of its longer-term uptrend without additional consolidation which should at least retest its recent low.
Summary
On Friday, SPX made another new all-time high, surpassing past Monday’s by less than three points on sharply diminishing volume. This lack of upside momentum combined with low volume as the index is making all-time highs is not bullish. Unless the action improves quickly, this is more likely to be the sign of a market top rather than that of a strong advance, and it could signify that traders are not intending to chase prices much higher as we enter the two worst months of the year for stocks.
A reversal at this time would not necessarily be considered the top of the bull market.
*********
FREE TRIAL SUBSCRIPTON
With a trial subscription, you will have access to the same information that is given to paid subscribers, but for a limited time period. I think you will find that knowing how far a move can carry is one of the most useful benefits of this service, whether you are a trader or an investor -- especially when this price target is confirmed by reliable indicators which give advance warning of a market top or bottom. Furthermore, cycle analysis adds the all- important time element to the above price projections.
For a FREE 4-week trial, further subscription options, payment plans, and for general information, I encourage you to visit my website at www.marketurningpoints.com.
The above comments about the financial markets are based purely on what I consider to be sound technical analysis principles. They
represent my own opinion and are not meant to be construed as trading or investment advice, but are offered as an analytical point of view
which might be of interest to those who follow stock market cycles and technical analysis.
share
share
share
share
share

When Andre Gratian was a stock broker years ago, a friend introduced him to technical analysis of the market. Consequently, it is not an exaggeration to say that Andre fell in love with this approach! Ever since then, it has become an increasingly important part of his professional life. Gratian has studied the works of Wyckoff, Edwards & Magee, Edward J. Dewey (cycles) and many others. However, one of my most profitable undertaking has probably been to study Point & Figure charting, which he finds invaluable in analyzing stocks and indices. If he were restricted to one methodology, this is the one that he would choose. This well-rounded background has given him what he feels to be a special insight into the stock market, facilitating the recognition of meaningful patterns and the ‘turning points’ in all trends, whether they be short or long term. Andre feels very comfortable discussing the stock market and passing on meaningful information to others. His subscribers include individuals and money managers throughout the world. Moreover, his Newsletters are currently published on several financial sites, here and abroad.


