Technical Analysis Of The Markets
 share
share
 share
share
 share
share
 share
share
 share
share
Gold
Short-Term Update:
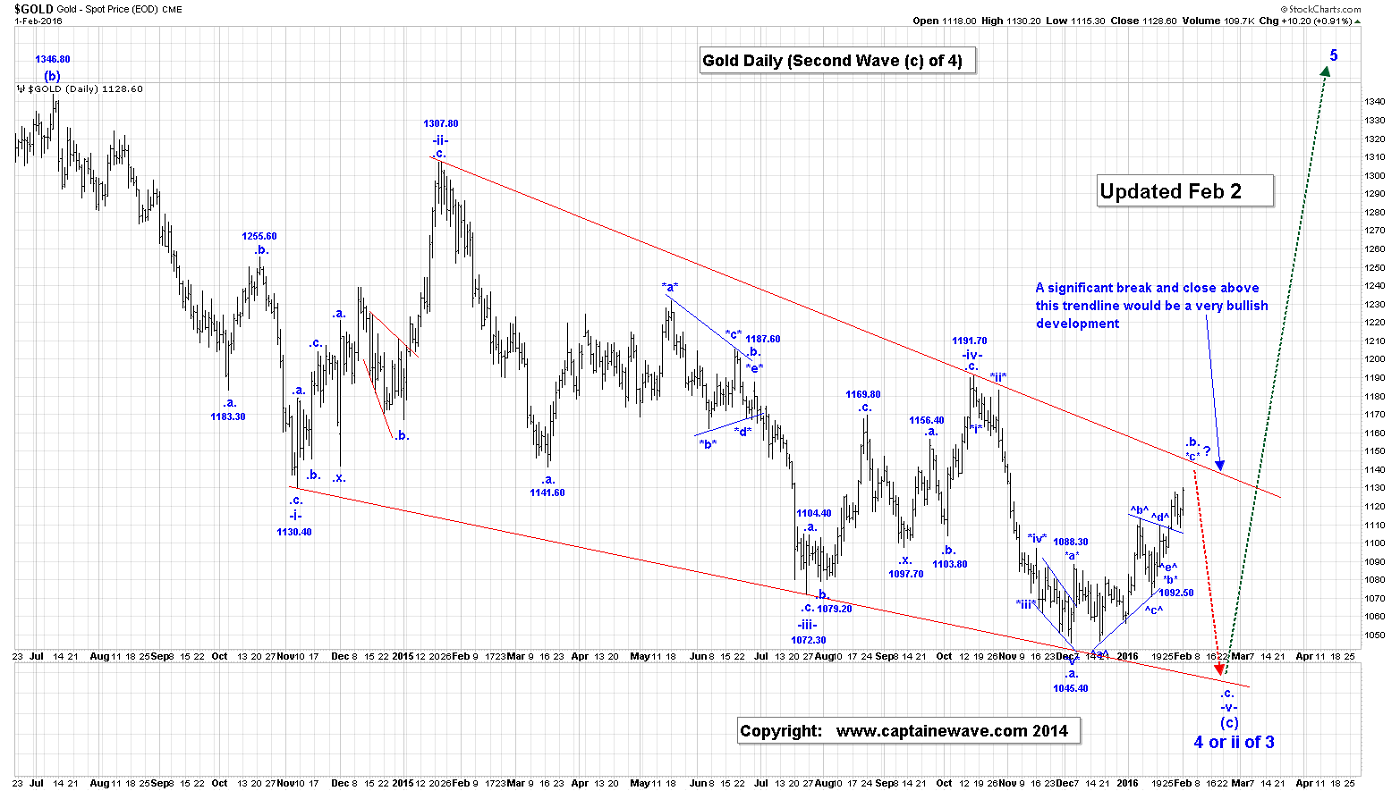
Gold made a slightly higher high in the overnight session, reaching 1130.80, at the time that this Post was being written. There is no change to what we said in our last End of Day Post, as we expect further gains in wave ^iii^ of *c*. We have mainly repeated our last Post below:
"It appears that wave *c* is still alive and our next target of around 1135.00 is now back in focus. Our updated count for wave *c* is:
^i^ = 1128.00;
^ii^ = 1108.80, if complete;
^iii^ rally is underway.
A drop back to the 1108.80 low, NOW, would suggest that wave ^ii^ did NOT end at the 1108.80 low and is becoming more complex.
Our current projections and retracements are repeated below:
“With wave *b* being complete at the 1092.60 low, we can provide projections for the end of wave *c*, as follows:
*c* = *a* = 1135.40;
*c* = 1.618*a* = 1061.90. We doubt this will happen as this type of rally would break the upper red trend line on the attached Daily Gold Chart, which would eliminate the current diagonal triangle formation.
Retracements for the end of wave .b. are:
50% = 1118.60;
61.8% = 1135.80.
Our current count for wave .b. is:
*a* = 1088.30;
*b* triangle = 1092.60;
*c* = 1129.30, if complete, although we have higher projections shown above, for end of all of wave .b.
Longer-Term Update
Watch for the completion of wave .b. and the start of wave .c. lower, which has minimum target of the wave .a. low which is 1045.60. Only a clean break of the down trend line connecting 1307.80 and 1191.70, would suggest that much more bullish things are happening in this market.
Active Trading Positions: Long 20 positions, with puts at 1085.00!
Crude Oil
Short-Term Update:
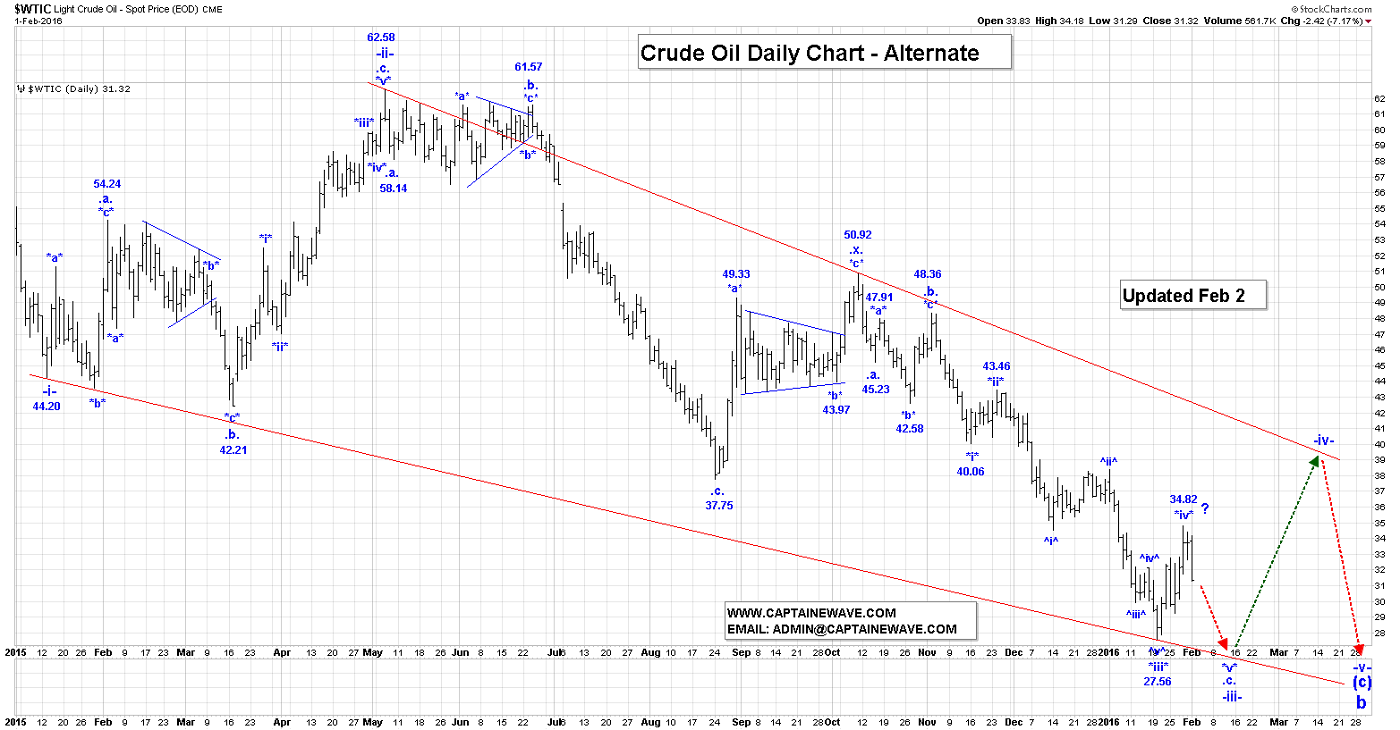
Crude moved lower in the overnight session, reaching 30.40, at the time that this Post was being written. As the attached Daily Crude Chart indicates, we cannot rule out the possibility that all of wave *iv* of -iii- is now complete at the 34.82 high, although it could still be possible that wave *iv* is becoming more complex or even a triangle.
If wave *iv* is complete then we are now falling in wave *v*, which has a minimum target of 27.56. This last drop in crude will complete all of wave -iii-, and will be followed by a rally that could see crude prices reach the $39/40 level or our upper red trend line that is shown on the chart.
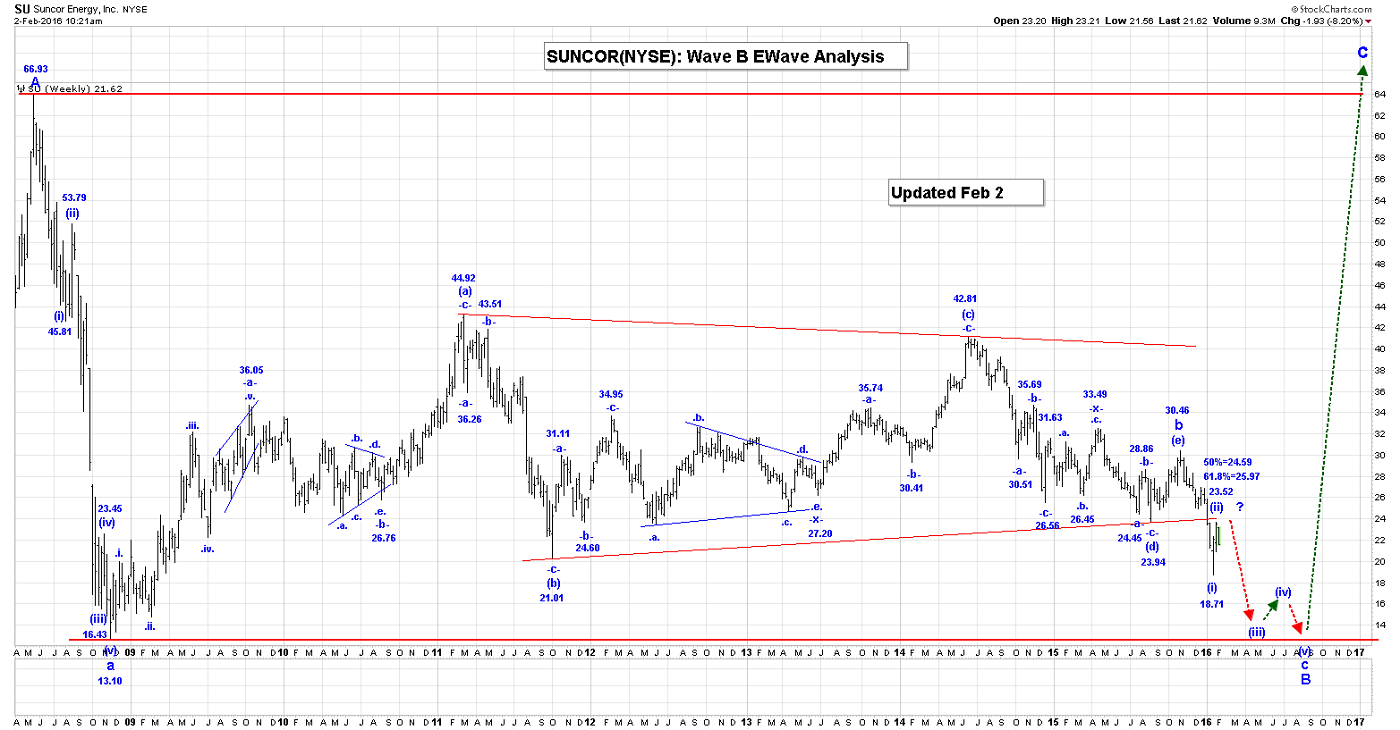
In Suncor, we are waiting for the end of wave (ii) of c of B.
Long-Term Update:
Wave *iv* is crude may now be over at the 34.82 high and if that is true then we should now be falling in wave *v*, to complete all of wave -iii-.
We have decided to exit all of our current crude positions.
Active Trading Positions: Exited all positions and are now flat!
S&P500
Short-Term Update
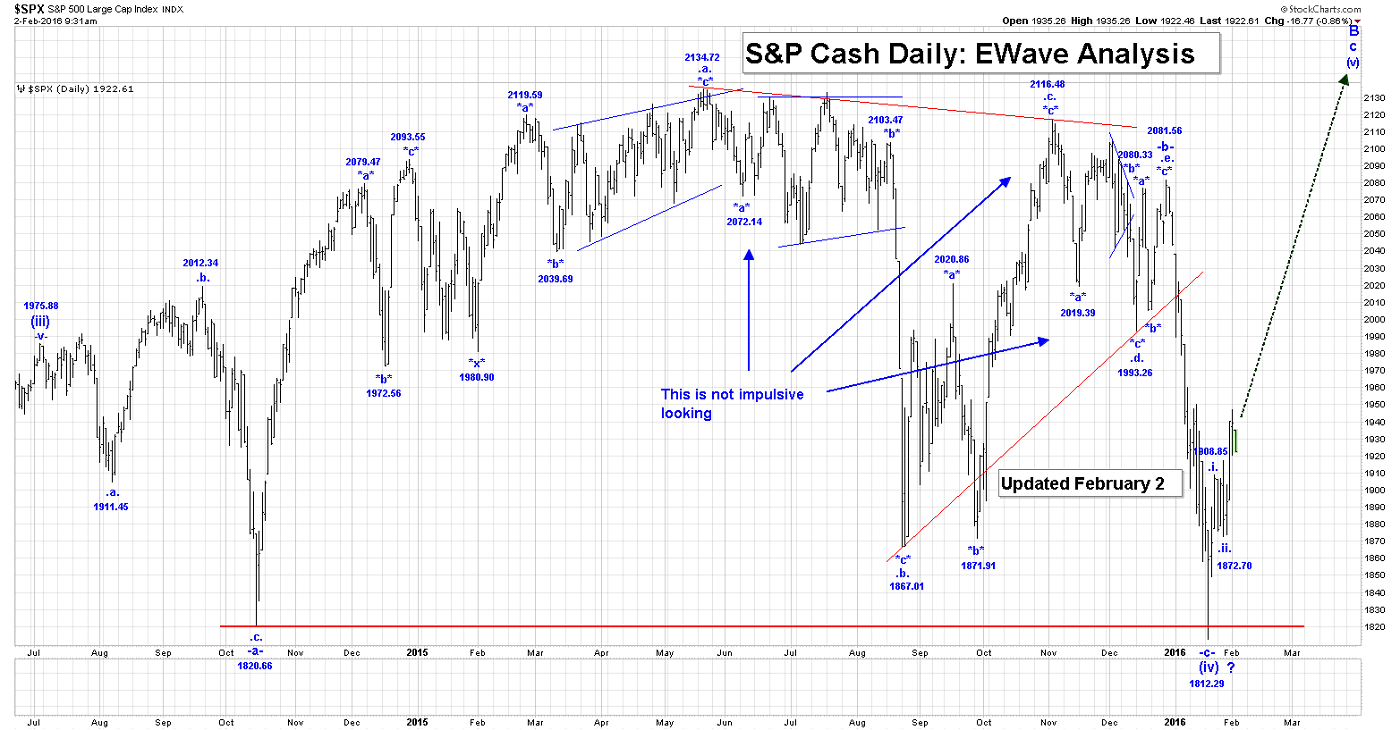
The S&P Futures were down about 13 points, in the overnight session, at the time that this Post was being written. We believe that we are rallying in an incomplete wave .iii., and therefore expect higher prices after this current correction ends.
Projections for the end of wave .iii. are:
.iii.= .i. = 1969.26;
.iii. = 1.618.i. = 2028.93
It is very important that that this current rally become impulsive, for if it become corrective (ie: only a 3 wave rally), then the S&P has topped in some kind of failure at the 2100/2150 level and this market is heading significantly lower.
Long-Term Update:
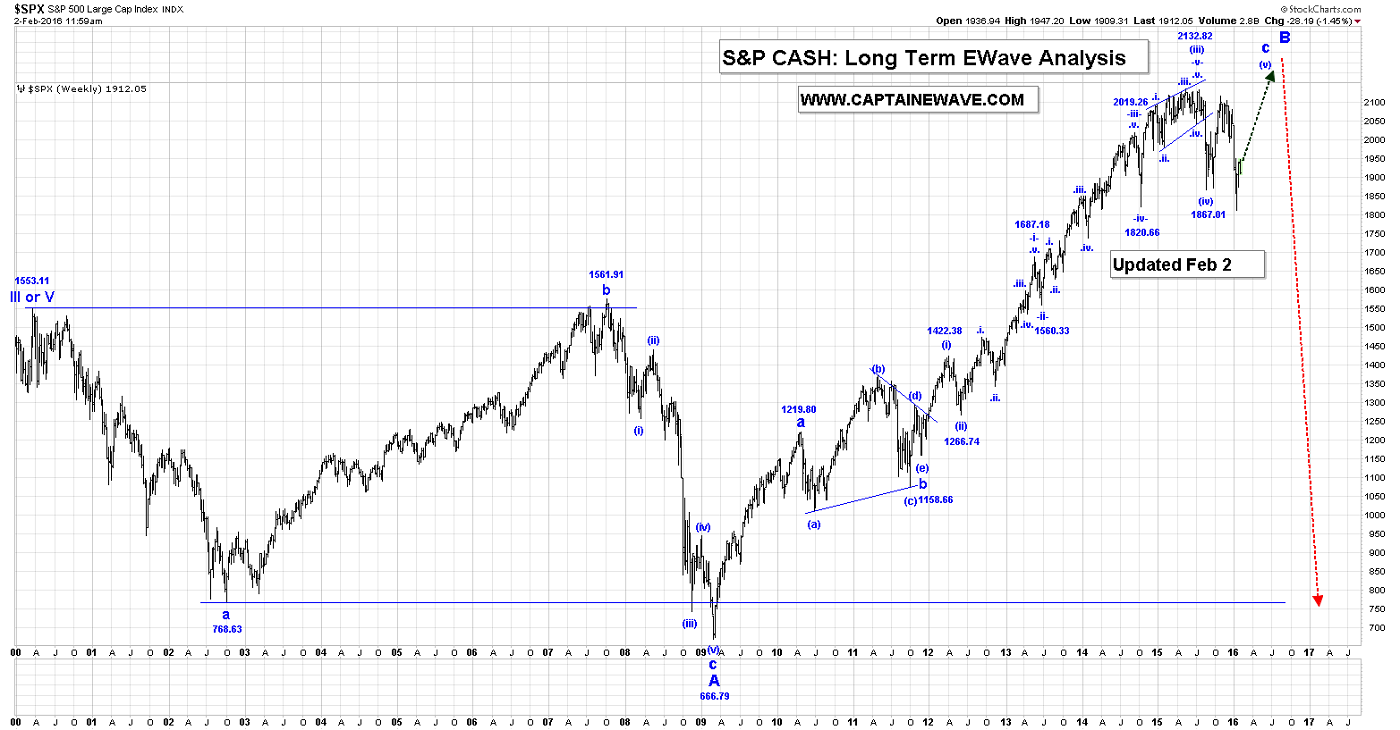
We are moving higher in wave -i- of (v), with wave (v) having an ultimate target of at least the all-time high of 2134.72.
Active Trading Positions: Flat!
USDX
Short-Term Update:
The USDX reached a low of 98.89, in the overnight session, at the time that this Post was being written. If our current triangle option is still valid then this drop should still be part of wave *e* of .iv.
Our updated count for all of the wave .iv. triangle formation is:
*a* = 97.21;
*b* = 99.89, if complete;
*c* = 98.45, if complete;
*d* = 99.88; if complete;
*e* = 98.89, if complete all of the wave .iv, triangle. Wave *e* cannot drop below the wave *c* low of 98.45, for this triangle formation to remain valid.
If our wave .iv. triangle is now complete, then we should expect a wave .v. rally to be the next big event, with a minimum target of 100.71.
It could also be possible that wave *b* is still underway and that our current triangle formation is expanding.
The other option for wave .iv. is:
*a* = 97.21;
*b* = 99.89, if complete;
*c* drop now to at least the 97.21 low to complete all of wave .iv.
Long-Term Trading Update:
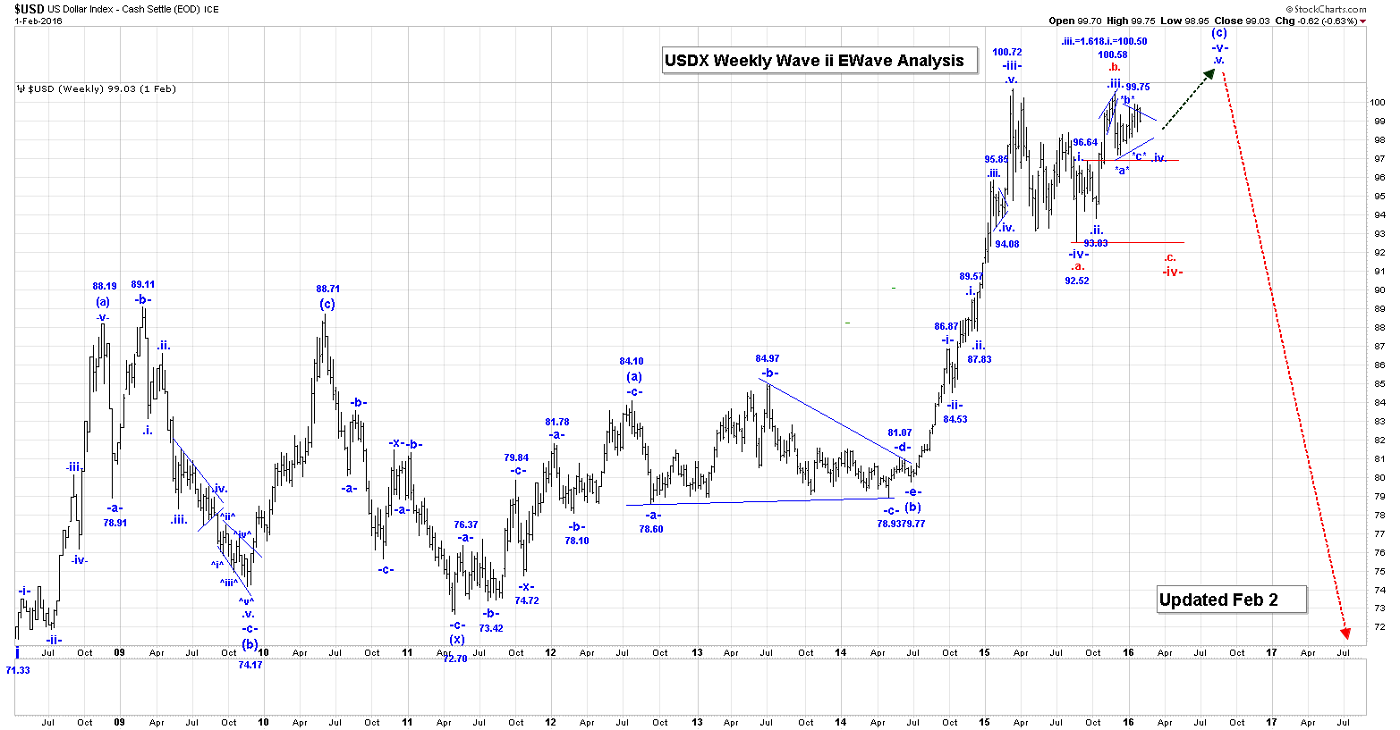
Our current count for all of wave -v- is:
.i. = 96.64;
.ii. = 93.83;
.iii. = 100.58;
.iv. = 98.89, if complete;
.v. rally is next at least the 100.71, wave -iii- high.
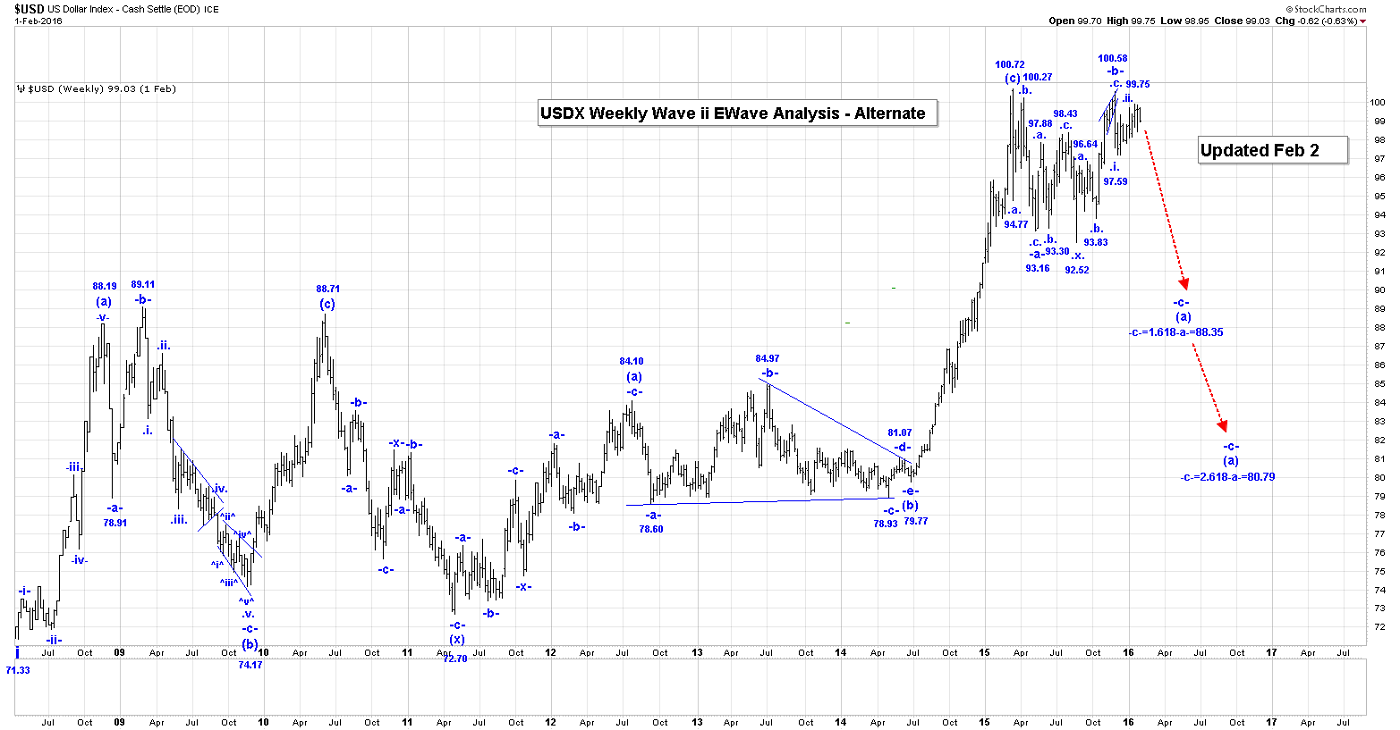
The other much more bearish count is shown on the Weekly USDX (Alternate) Chart. In this our second (a), (b), (c) pattern from the wave i low of 71.33, ended at 100.72 and we are now falling in another 3 wave pattern.
Within this 3 wave pattern we are working on wave -c-, with projections of 88.35 and 80.79.
All of our alternate counts will become valid if we drop below the 96.64 high.
Active Trading Positions: We are short, risking to 99.90!
NATGAS
Short-Term Update:
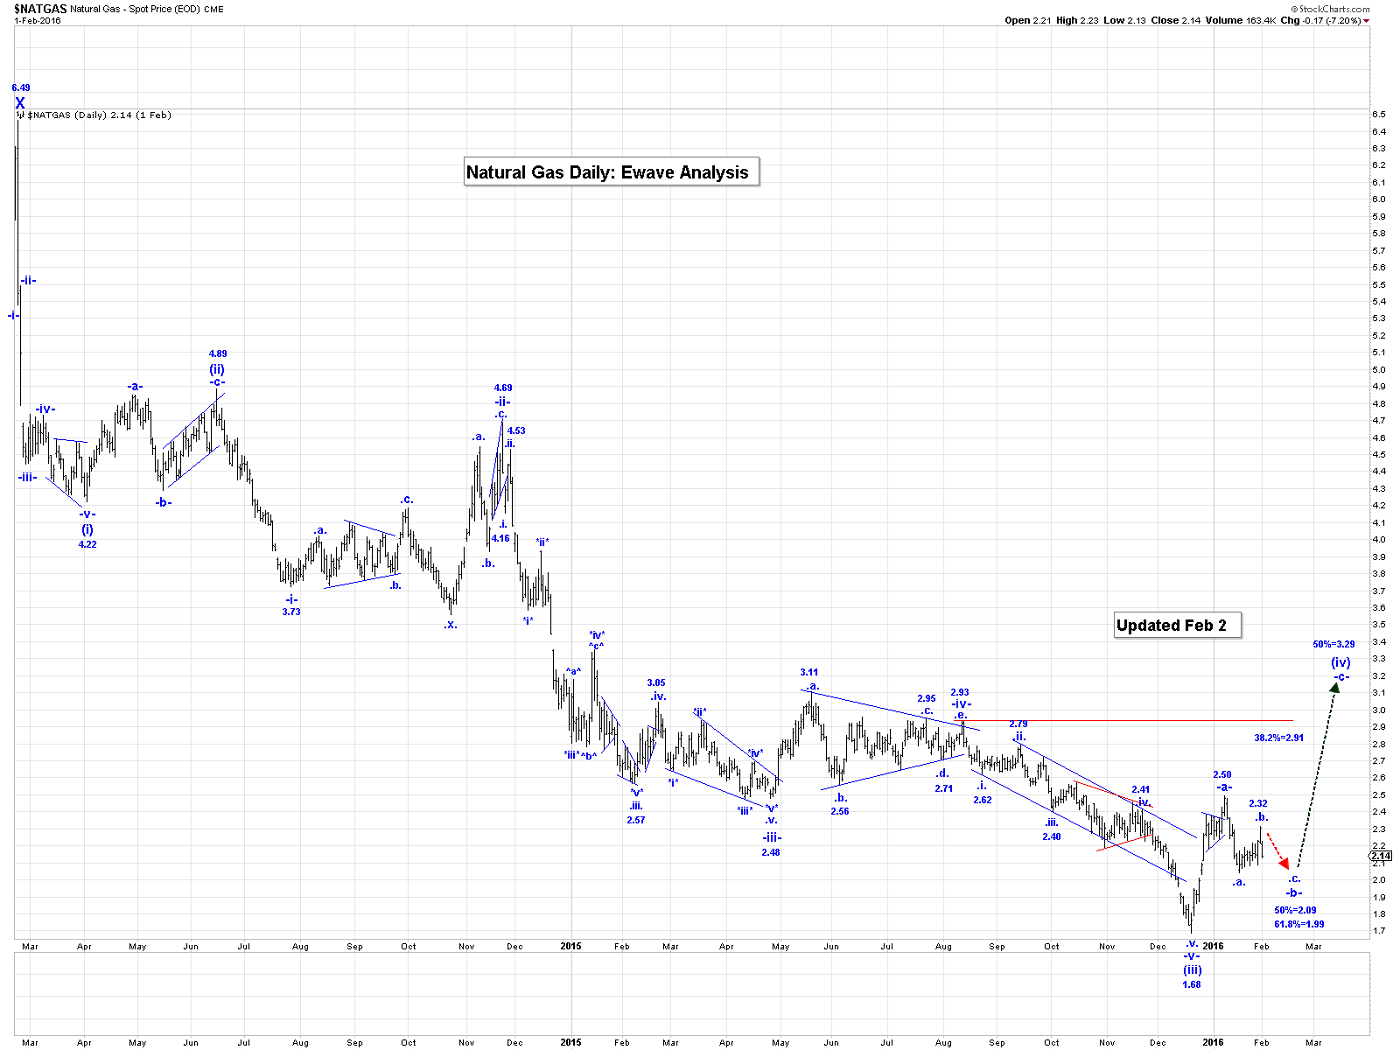
NG continued to drop in the overnight session, reaching 2.085 at the time that this Post was being written. It still possible that we are in our second wave *b* of -b-, but the depth of this drop is getting a little concerning for that to be the correct count.
We did suggest the other option was that all of wave -b- was complete at the 2.315 high and in that case we would now be dropping in wave .c.. Our minimum target for wave .c. is the wave .a. low of 2.045.
We have cancelled our sell stops at 2.32 and have added a buy stop at 2.04, and we want to be long for the wave -c- rally.
Our retracement levels for all of wave .b. are:
50% = 2.271;
61.8% = 2.324
We will give this market a bit more time for our current count, but the idea that all of wave -b- is complete at the 2.315 high and that we are now falling in wave .c. of -b- is likely what this market is now doing.
Our updated current count for all of wave .b. is:
*a* = 2.170;
*b* triangle:
^a^ = 2.069;
^b^ = 2.189;
^c^ = 2.082;
^d^ = 2.171;
^e^ = 2.129;
*c* = 2.214;
*x*:
^a^ = 2.115;
^b^ = 2.211;
^c^ = 2.099;
*a* = 2.315;
*b* =2.085, if complete;
*c* rally is next to at least the 2.315 high.
Retracement levels for the end of wave -b- are:
50% = 2.089;
61.8% = 1.993.
Long-Term Trading Update:
Our retracement levels for all of wave (iv):
38.2% = 2.91;
50% = 3.29.
For the time being we will assume that wave (iv) is a simple -a-, -b-, -c- pattern, and within that count we have:
-a- = 2.494;
-b-:
.a. = 2.045, if complete;
.b. = 2.315, if complete, with the detailed count above;
.c. drop to at least the wave .a. low of 2.045, to complete all of wave -b-;
-c- rally to at least the wave -a- high, but more likely to our 38.2%/50% retracement zone shown above.
Active Trading Positions: We plan to buy 5 at 2.04, risking to 1.90!
HUI/GDX and Selected Gold Stocks
Short-Term Update:
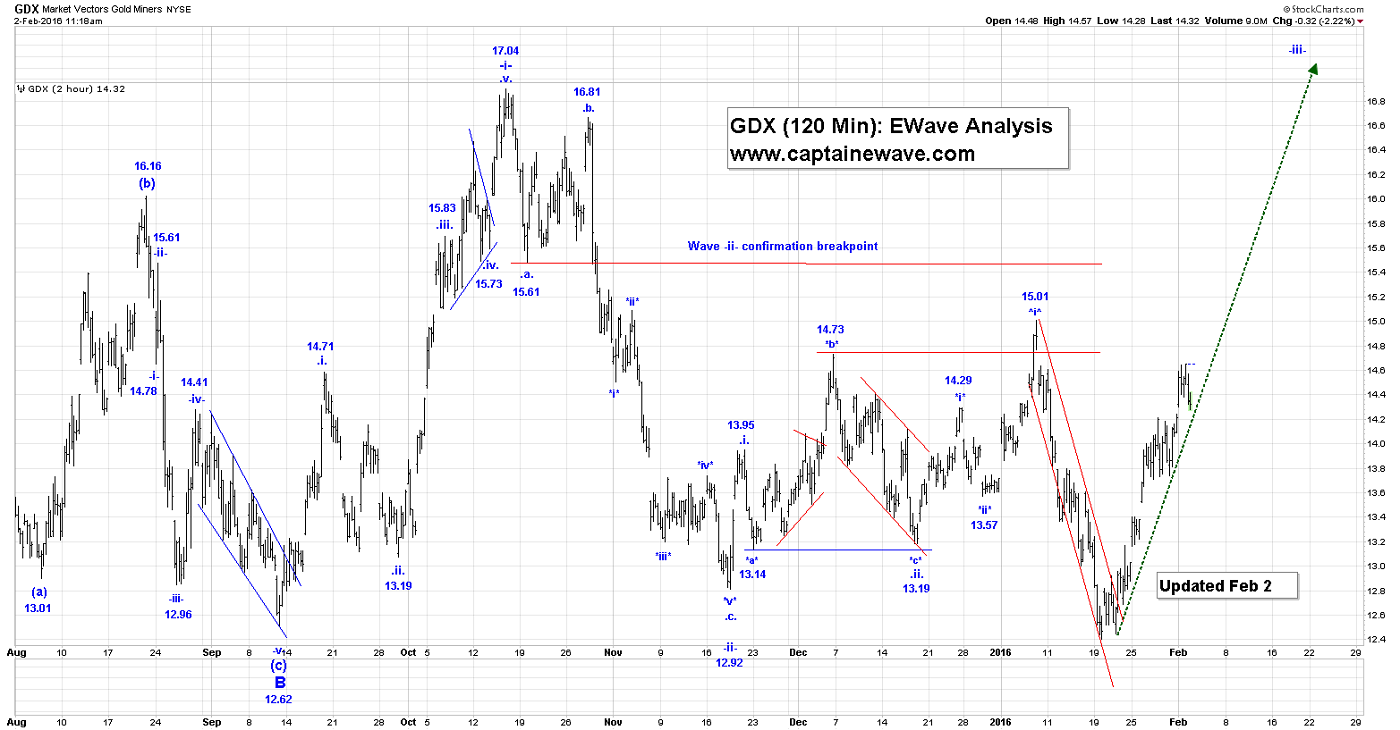
The GDX was higher yesterday, along with gold, reaching 14.65. On the Intraday Chart, the rally from 12.40 to the current high of 14.65 is looking impulsive.
As we indicated in our last End of Week Post, we now believe that all of wave is complete at the 12.40 low.
We will provide an EWave count for this exciting impulsive sequence coming out of the 12.40 low, in the days ahead!
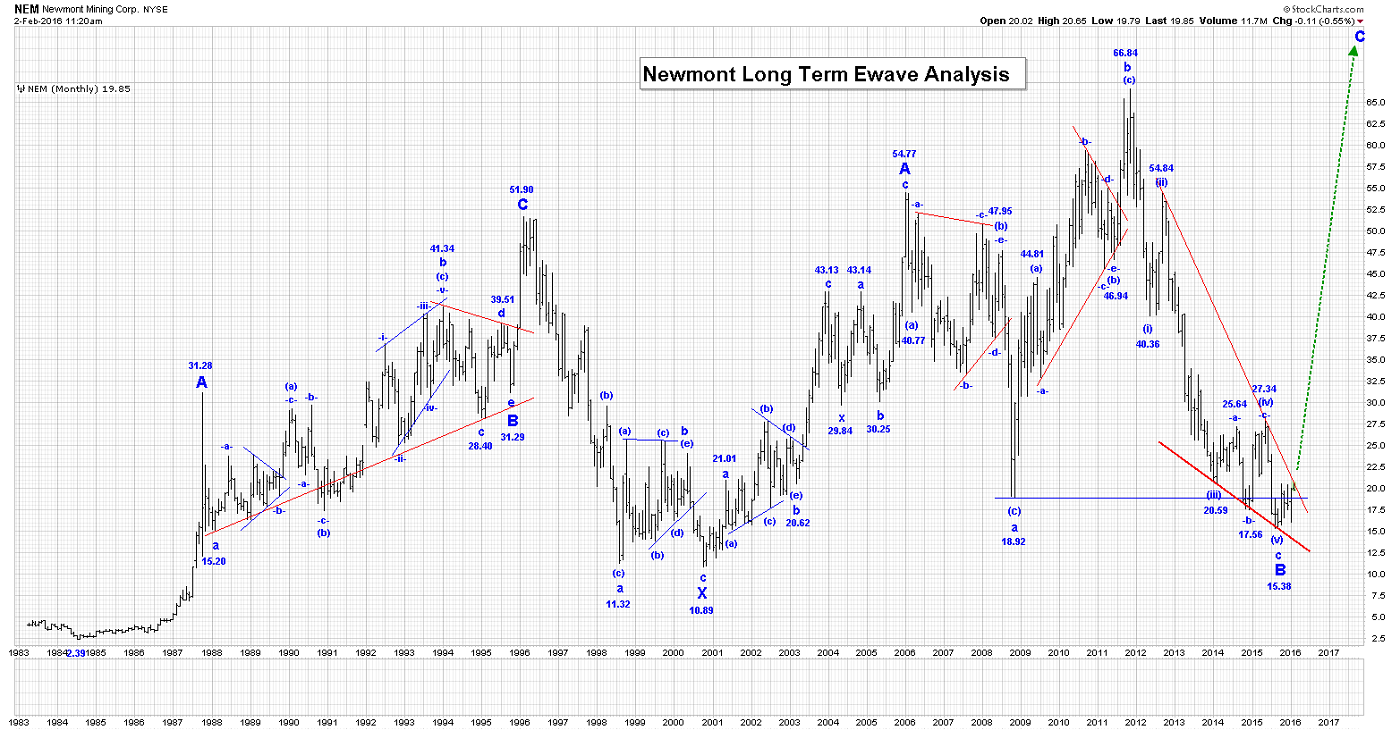
This long term chart for Newmont shows it on the verge of staging a historic upside breakout, ushering in the much-awaited and all-powerful C wave higher!
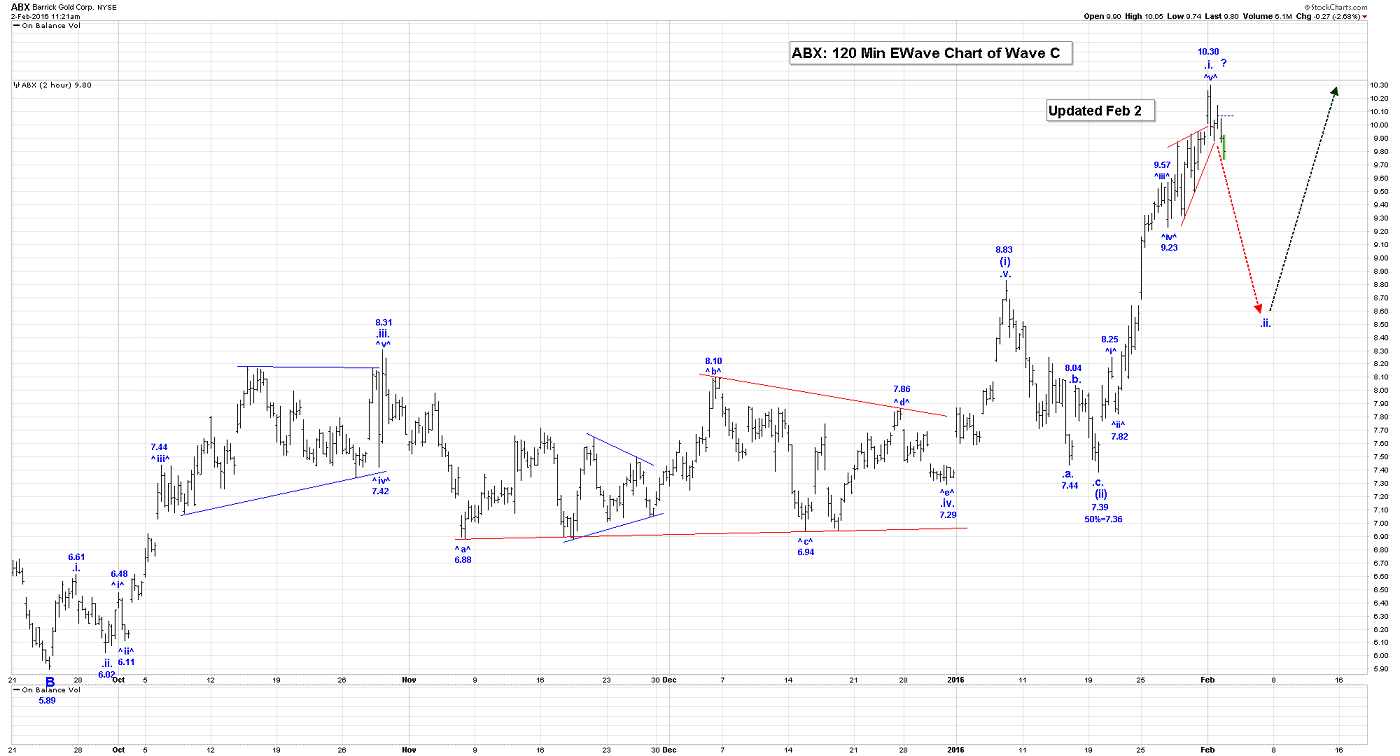
In terms of ABX, it appears that all of wave .i. of (iii) is complete at the high of 10.30, as shown on the attached 120 Min ABX Chart. If that is the case then we should now expect ABX to drop in wave .ii. and retrace between 50 to 61.8% of the entire wave .i. rally. Once we are sure that wave .i. is complete we will provide those retracement levels.
Kinross continued higher yesterday, and it is looking more like all of wave B may be over in that stock at the 1.31 low.
Long-Term Update:
Wave B may now be completed in the HUI, GDX and XAU, and we now only need to see a decidedly break of the associated major down trend lines in all of these markets to confirm that idea.
We plan to add to all of our current selected gold stocks holdings. Kinross may be the only gold stock that could still drop to its wave a low of 1.07, and even that is becoming less likely!
Active Trading Positions: We are long and will now be adding to the GDX, ABX, KGC, NEM, CRJ, and TSX:XGD with no stops!
********
Email: [email protected]
Website: www.captainewave.com
Risk: CAPTAINEWAVE.COM IS AN IMPERSONAL ADVISORY SERVICE. AND THEREFORE, NO CONSIDERATION CAN OR IS MADE TOWARD YOUR FINANCIAL CIRCUMSTANCES. ALL MATERIAL PRESENTED WITHIN CAPTAINEWAVE.COM IS NOT TO BE REGARDED AS INVESTMENT ADVICE, BUT FOR GENERAL INFORMATIONAL PURPOSES ONLY. TRADING STOCKS DOES INVOLVE RISK, SO CAUTION MUST ALWAYS BE UTILIZED. WE CANNOT GUARANTEE PROFITS OR FREEDOM FROM LOSS. YOU ASSUME THE ENTIRE COST AND RISK OF ANY TRADING YOU CHOOSE TO UNDERTAKE. YOU ALSO AGREE TO BEAR COMPLETE RESPONSIBILITY FOR YOUR INVESTMENT RESEARCH AND DECISIONS AND ACKNOWLEDGE THAT CAPTAINEWAVE.COM HAS NOT AND WILL NOT MAKE ANY SPECIFIC RECOMMENDATIONS OR GIVE ADVICE TO YOU OR ANY OF ITS CLIENTS UPON WHICH THEY SHOULD RELY. CAPTAINEWAVE.COM SUGGESTS THAT THE CLIENT/MEMBER TEST ALL INFORMATION AND TRADING METHODOLOGIES PROVIDED AT OUR SITE THROUGH PAPER TRADING OR SOME OTHER FORM OF TESTING. CAPTAINEWAVE.COM, ITS OWNERS, OR ITS REPRESENTATIVES ARE NOT REGISTERED AS SECURITIES BROKER-DEALERS OR INVESTMENT ADVISORS EITHER WITH THE U.S. SECURITIES AND EXCHANGE COMMISSION OR WITH ANY STATE SECURITIES REGULATORY AUTHORITY. WE RECOMMEND CONSULTING WITH A REGISTERED INVESTMENT ADVISOR, BROKER-DEALER, AND/OR FINANCIAL ADVISOR. IF YOU CHOOSE TO INVEST WITH OR WITHOUT SEEKING ADVICE FROM SUCH AN ADVISOR OR ENTITY, THEN ANY CONSEQUENCES RESULTING FROM YOUR INVESTMENTS ARE YOUR SOLE RESPONSIBILITY.
ALL INFORMATION POSTED IS BELIEVED TO COME FROM RELIABLE SOURCES. CAPTAINEWAVE.COM DOES NOT WARRANT THE ACCURACY, CORRECTNESS, OR COMPLETENESS OF INFORMATION AVAILABLE FROM ITS SERVICE AND THEREFORE WILL NOT BE LIABLE FOR ANY LOSS INCURRED. DUE TO THE ELECTRONIC NATURE OF THE INTERNET, THE CAPTAINEWAVE.COM WEBSITE, ITS E-MAIL & DISTRIBUTION SERVICES AND ANY OTHER SUCH "ALERTS" COULD FAIL AT ANY GIVEN TIME. CAPTAINEWAVE.COM WILL NOT BE RESPONSIBLE FOR UNAVAILABILITY OF USE OF ITS WEBSITE, NOR UNDELIVERED E-MAILS, OR "ALERTS" DUE TO INTERNET BANDWIDTH PROBLEMS, EQUIPMENT FAILURE, OR ACTS OF GOD. CAPTAINEWAVE.COM DOES NOT WARRANT THAT THE TRANSMISSION OF E-MAILS, OR ANY "ALERT" WILL BE UNINTERRUPTED OR ERROR-FREE. CAPTAINEWAVE.COM WILL NOT BE LIABLE FOR THE ACTS OR OMISSIONS OF ANY THIRD PARTY WITH REGARDS TO CAPTAINEWAVE.COM DELAY OR NON-DELIVERY OF THE CAPTAINEWAVE.COM NIGHTLY EMAILS OR "ALERTS". FURTHER, WE DO NOT RECEIVE ANY FORM OF PAYMENT OR OTHER COMPENSATION FOR PUBLISHING INFORMATION, NEWS, RESEARCH OR ANY OTHER MATERIAL CONCERNING ANY SECURITIES ON OUR SITE OR PUBLISH ANY INFORMATION ON OUR SITE THAT IS INTENDED TO AFFECT OR INFLUENCE THE VALUE OF SECURITIES.
THERE IS NO GUARANTEE PAST PERFORMANCE WILL BE INDICATIVE OF FUTURE RESULTS. NO ASSURANCE CAN BE GIVEN THAT THE RECOMMENDATIONS OF CAPTAINEWAVE.COM WILL BE PROFITABLE OR WILL NOT BE SUBJECT TO LOSSES. ALL CLIENTS SHOULD UNDERSTAND THAT THE RESULTS OF A PARTICULAR PERIOD WILL NOT NECESSARILY BE INDICATIVE OF RESULTS IN FUTURE PERIODS. THE RESULTS LISTED AT THIS WEBSITE ARE BASED ON HYPOTHETICAL TRADES. PLAINLY SPEAKING, THESE TRADES WERE NOT ACTUALLY EXECUTED. HYPOTHETICAL OR SIMULATED PERFORMANCE RESULTS HAVE CERTAIN INHERENT LIMITATIONS. UNLIKE AN ACTUAL PERFORMANCE RECORD, SIMULATED TRADES DO NOT REPRESENT ACTUAL TRADING. ALSO, SINCE THE TRADES HAVE NOT ACTUALLY BEEN EXECUTED, THE RESULTS MAY HAVE OVER OR UNDER COMPENSATED FOR THE IMPACT, IF ANY, OF CERTAIN MARKET FACTORS SUCH AS LACK OF LIQUIDITY. YOU MAY HAVE DONE BETTER OR WORSE THAN THE RESULTS PORTRAYED. NO REPRESENTATION IS BEING MADE THAT ANY ACCOUNT WILL OR IS LIKELY TO ACHIEVE PROFITS OR LOSSES SIMILAR TO THOSE SHOWN. NO INDEPENDENT PARTY HAS AUDITED THE HYPOTHETICAL PERFORMANCE CONTAINED AT THIS WEBSITE, NOR HAS ANY INDEPENDENT PARTY UNDERTAKEN TO CONFIRM THAT THEY REFLECT THE TRADING METHOD UNDER THE ASSUMPTIONS OR CONDITIONS SPECIFIED HEREAFTER. WHILE THE RESULTS PRESENTED AT THIS WEBSITE ARE BASED UPON CERTAIN ASSUMPTIONS BELIEVED TO REFLECT ACTUAL TRADING CONDITIONS, THESE ASSUMPTIONS MAY NOT INCLUDE ALL VARIABLES THAT WILL AFFECT, OR HAVE IN THE PAST AFFECTED, THE EXECUTION OF TRADES INDICATED BY CAPTAINEWAVE.COM. THE HYPOTHETICAL RESULTS ON THIS WEBSITE ARE BASED ON THE ASSUMPTION THAT THE CLIENT BUY AND SELLS THE POSITIONS AT THE OPEN PRICE OF THE STOCK. THE SIMULATION ASSUMES PURCHASE AND SALE PRICES BELIEVED TO BE ATTAINABLE. IN ACTUAL TRADING, PRICES RECEIVED MAY OR MAY NOT BE THE SAME AS THE ASSUMED ORDER PRICES.
share
share
share
share
share


