Technical Analysis Of The Markets


Current Position of the Market
SPX: Long-term trend – The bull market is continuing with a top expected in the low 3000s.
Intermediate trend – Breaking to a new high has only delayed the anticipated correction into mid-October; it has not eliminated its potential.
Analysis of the short-term trend is done on a daily basis with the help of hourly charts. It is an important adjunct to the analysis of daily and weekly charts which discusses the course of longer market trends.
DJIA Makes New High
Market Overview
Last week belonged to the laggard indexes. DJIA and NYA went on a tear with the former rising 739 points from last Monday’s low, and (finally) making a new all-time high in the process. NYA was also strong, but did not make a new high. SPX could not resist this buying surge and made a new all-time high as well by the end of the week. Not so for NDX and IWM, which have now become the laggards.
It’s hard to conceive of the stock market pushing much higher over the near-term without the participation of these two important indexes. Last week, I had expected a correction to start and last into mid-October, but SPX sold off for only one day and reversed. Although it did resist making a new high for a couple of days, the buying pressure behind the DOW was too much, and SPX finally went along on Thursday. It tacked on another 10 points on Friday, but gave it all back by the close. It does have the potential to rise a little higher before making the reversal that I had anticipated last week.
Additional tariffs proposed by the US and China last week turned the market bullish although the opposite had been expected. Nevertheless, if trade war pressure continues to build, we could still get negative action into mid-October. It is likely that next week’s rate hike is probably already baked into prices, but what the Fed chairman says in the Q&A session could also have some negative effect on the market.
Mostly, the market cannot continue to rise significantly without the participation of NDX and IWM, and if the current discrepancy continues, it will be a red flag.
Chart Analysis (The charts that are shown below are courtesy of QCharts)
SPX Daily Chart
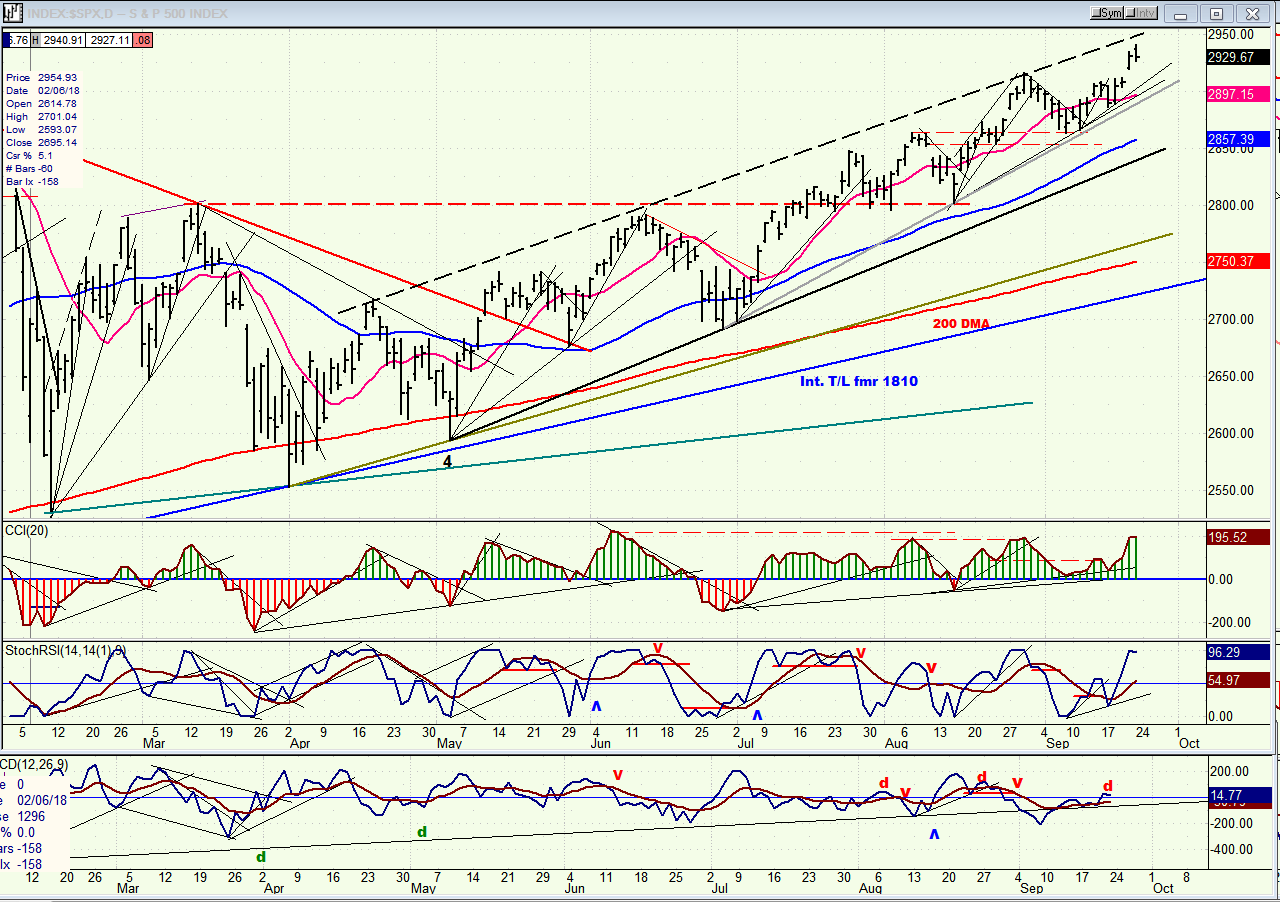
SPX made two attempts at breaking its trend line from 2700, but it held both times and the new surge of buying in DJIA components prevented it from making a third, and decisive, one. How much higher can it go over the near term? It has practically reached the top of the intermediate channel from early May, and Friday’s action showed that there were plenty of sellers at 2940 since, immediately after touching it, a correction began which lasted the entire day and brought prices back down to close on a slightly negative note after wiping out a 10-point gain.
And yet, this may not be the high for this move just yet! If SPX can hold in this range, it is likely to make one more push higher (to 2950?) before starting on the correction which had been anticipated last week. By touching 2920, the index signaled that the previous congestion pattern was a re-accumulation phase (and not distribution) with a potential count to 2950.
Although P&F counts have a high degree of reliability (provided they are taken correctly in the first place) they do not always meet their targets precisely -- which is why we must closely watch the activity around 2940 to determine if it turns out to be the top of the rally.
The oscillators at the bottom of the chart lend support to the higher level because they are not yet showing negative divergence in the momentum section. But the A/D indicator (lowest), which is usually the early bird, is displaying weakness as well as divergence, and this is a warning that the uptrend is getting extended.
SPX hourly chart
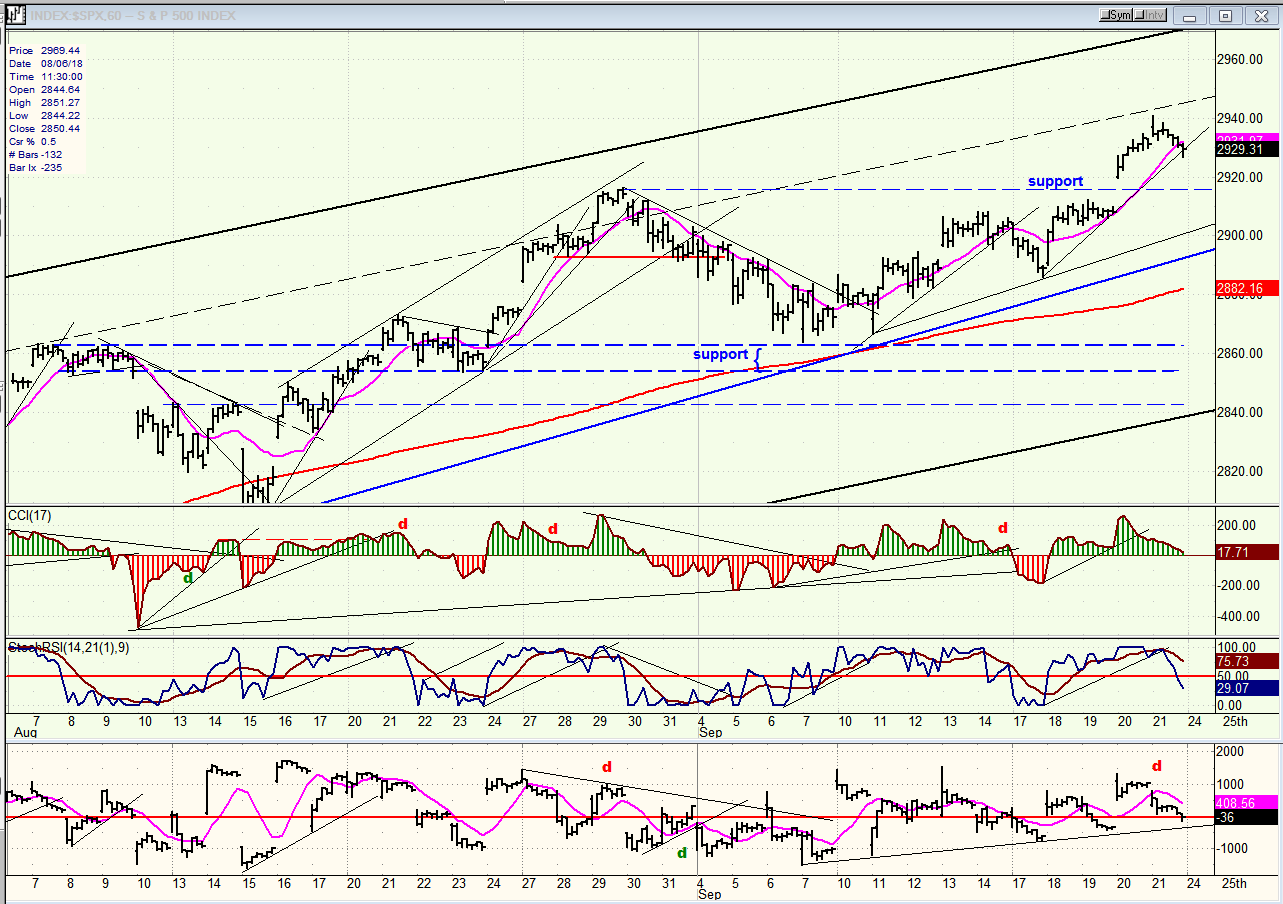
We had some advance warning that SPX would hold the strong support level above 2860, but the odds seemed to indicate that we were making an a-b-c correction pattern, and that after rising to 2908, we would start on the c-wave. That was not to be! Now, the odds are predicting one more high before the top of the move from 2890 is complete.
On Friday, after a gap opening, the first hour of trading immediately ran into resistance at the dashed parallel to the top channel line, and then proceeded to retrace its morning advance (and more) for the rest of the day. There is good support at 2917, but we should not pull back that much over the near-term if we are going to make a new high. On Friday we already retraced .382 of the second minor phase, but a little more may be needed before resuming the uptrend.
If we do make a new high to about 2950+ before ending this rally, and if we are going to retrace into mid-October, we should, at a minimum, test the blue trend line from 2700 and probably break through it slightly in preparation for what could be the final uptrend of the bull market. The lack of participation by NDX and especially IWM will become increasingly worrisome concerning the health of the bull trend if it turns out that they are currently in the process of making their long-term highs.
DJIA, SPX, NDX, IWM (daily)
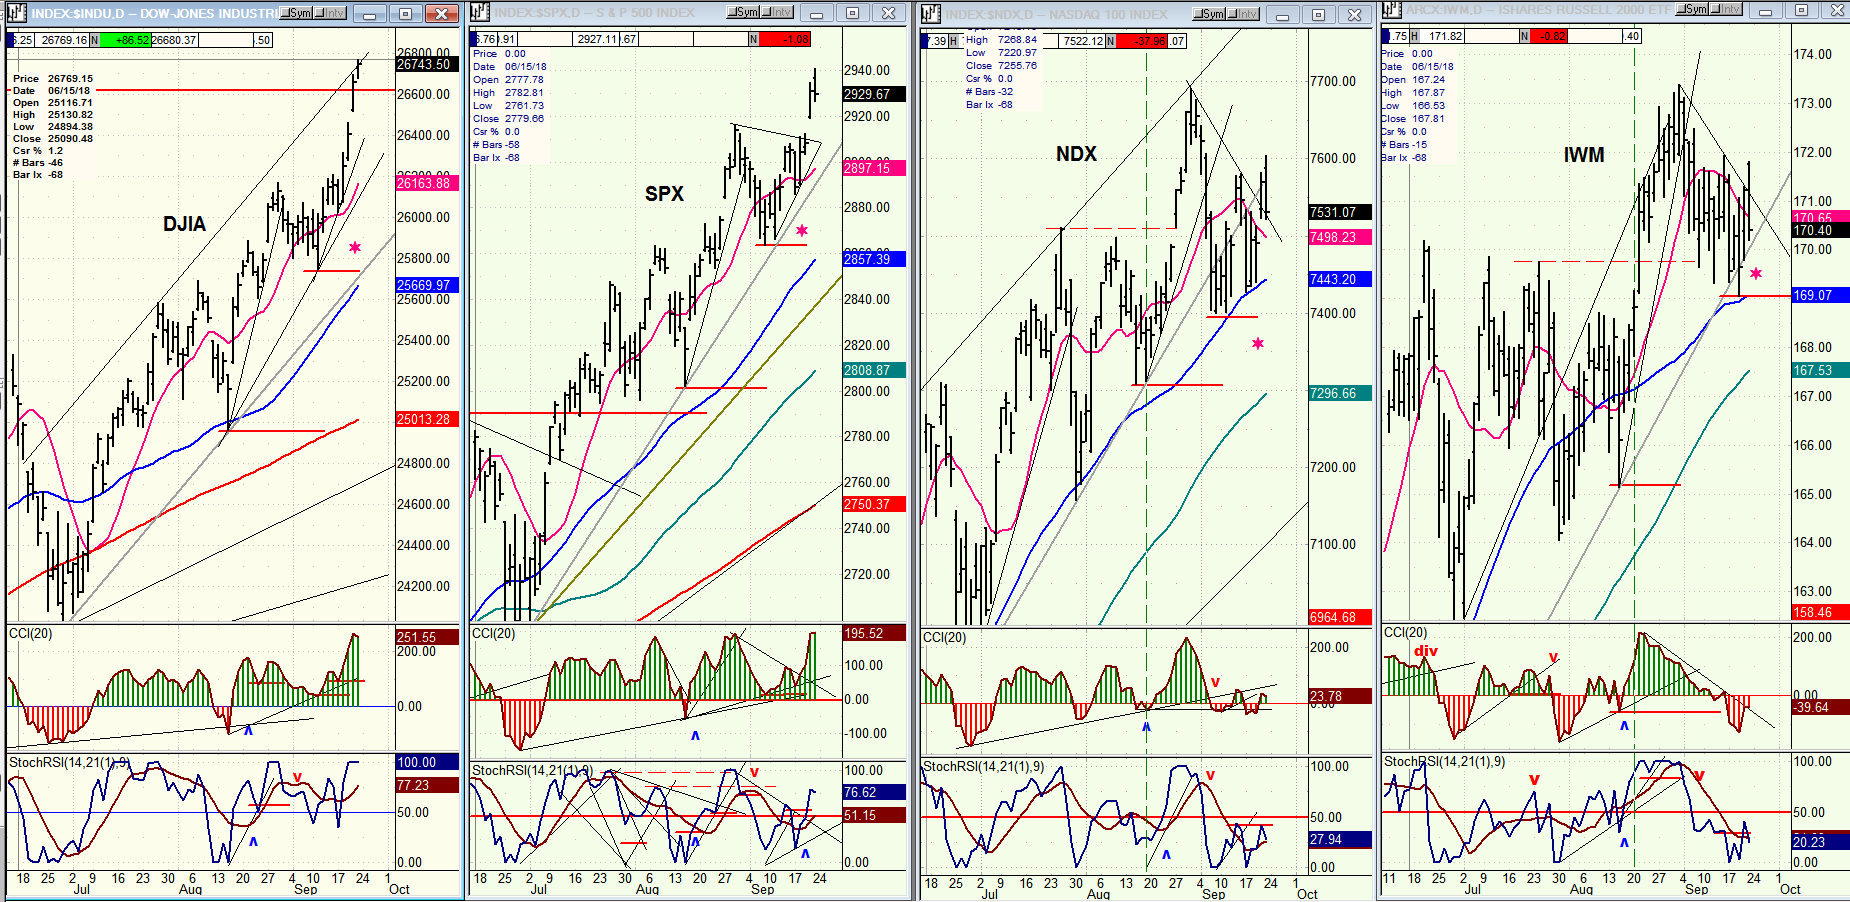
The following indexes are listed from left to right in order of stronger to weaker over the short-term. Last week’s market action catapulted DJIA into first place. SPX, which is influenced by both DJIA and NDX was helped by the former but restrained by the latter and dropped to second position.
The reason for comparing the performance of these four indexes is because I (and others) have found that when IWM begins to lag the rest, it is time to consider the possibility that we are coming to an important top. In 2007, for instance, IWM peaked three months before DJIA. In January of this year, it peaked a few days before and was clearly losing momentum a couple of weeks prior.
This bull market is now nearly 10 years old and it will do no harm to see if IWM continues to, and even increases, its relative weakness to DJIA and SPX over the next few weeks; or if it regains its upside momentum, suggesting that the end of the bull market is not yet in sight.
UUP (dollar ETF) weekly
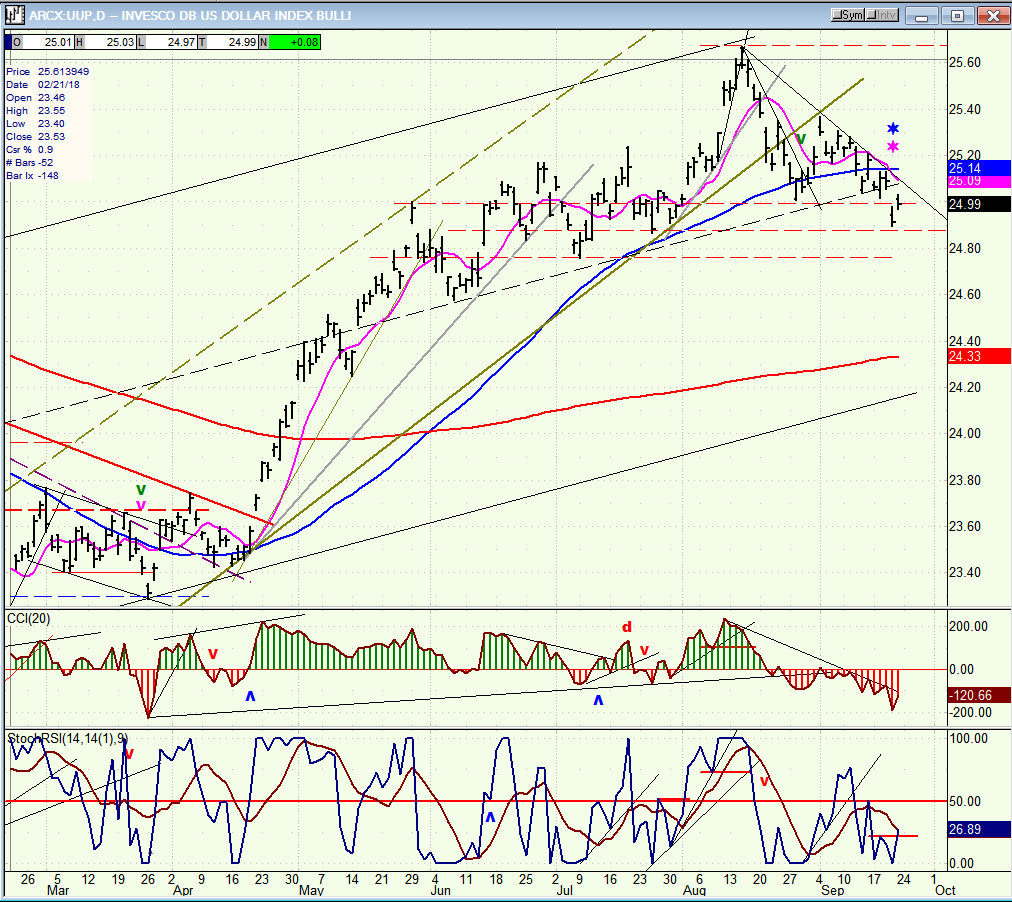
UUP has extended its correction to slightly below 25.00 and this may be all we get for now. The 1/2X P&F chart had given me a projection to 25.50, which was met before the index ended ts rally from 22.50. The logical expectation would be for the index to form a congestion zone of unknown duration in this area which could start with a rebound to 25.50 before seeking a lower price. It could also progress lower before rebounding. We need to allow some time to pass in order to determine what comes next.
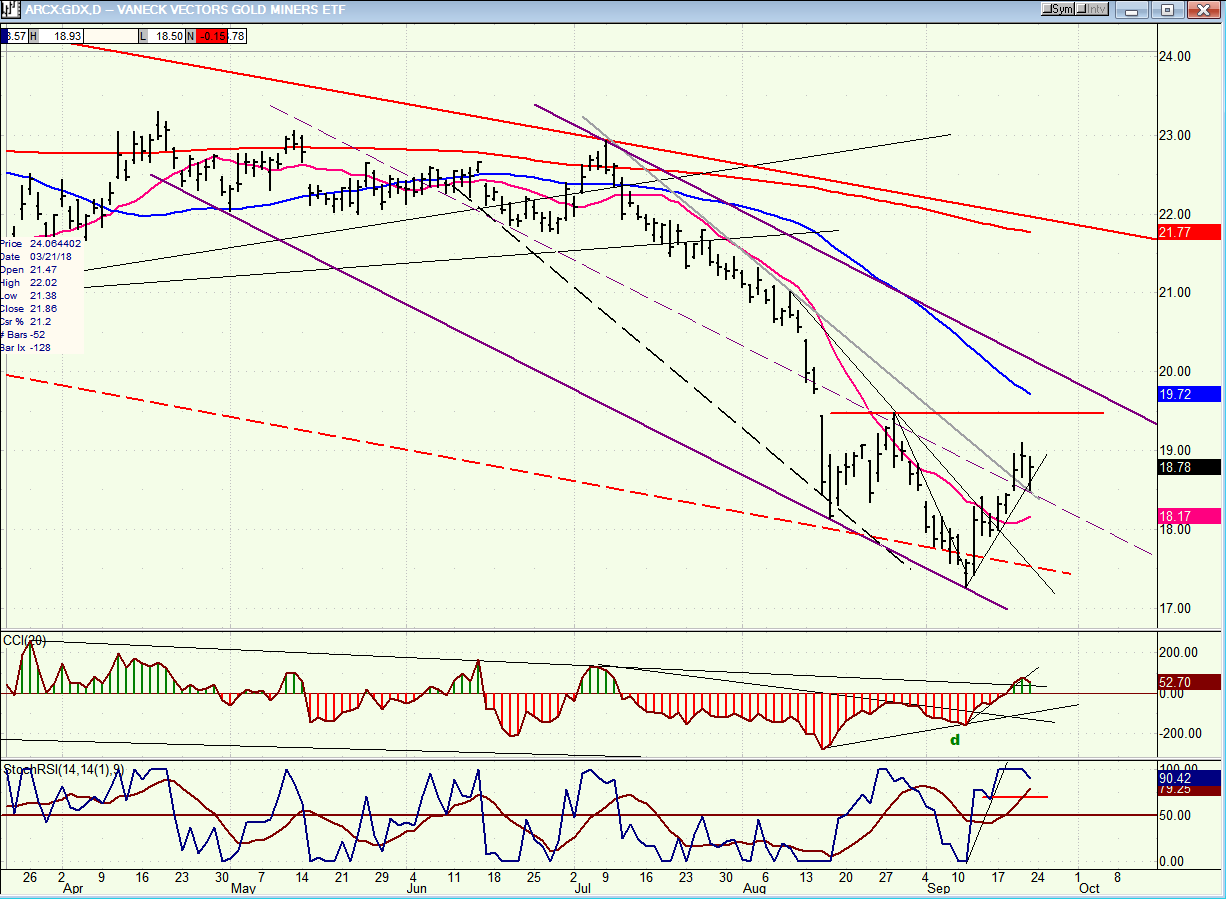
GDX (Gold miners ETF) weekly
Historically, GDX has consistently gone the opposite of UUP, so what the latter does over the near-term will have some bearing on GDX’s behavior. If it chooses to rally once again to 25.50, it would most likely cause GDX to retest its low, which would not be a bad thing since it would further expand the base, which is probably what is needed before we can get much more price appreciation.
As of now, GDX is encased in three channels of various importance. It recently broke out of the smallest one and on Friday back-tested the (thin, black) downtrend line. It has also moved slightly above the mdi-channel (dashed) line of the next larger (purple) channel, and re-tested that line as well. The support provided by both of these lines could help it push a little higher to retest the red horizontal line which is drawn across the top of the last short-term high. A move to 19.50 could be as good as you get over the short-term; especially with the (blue) 50dma ready to meet the price at that level.
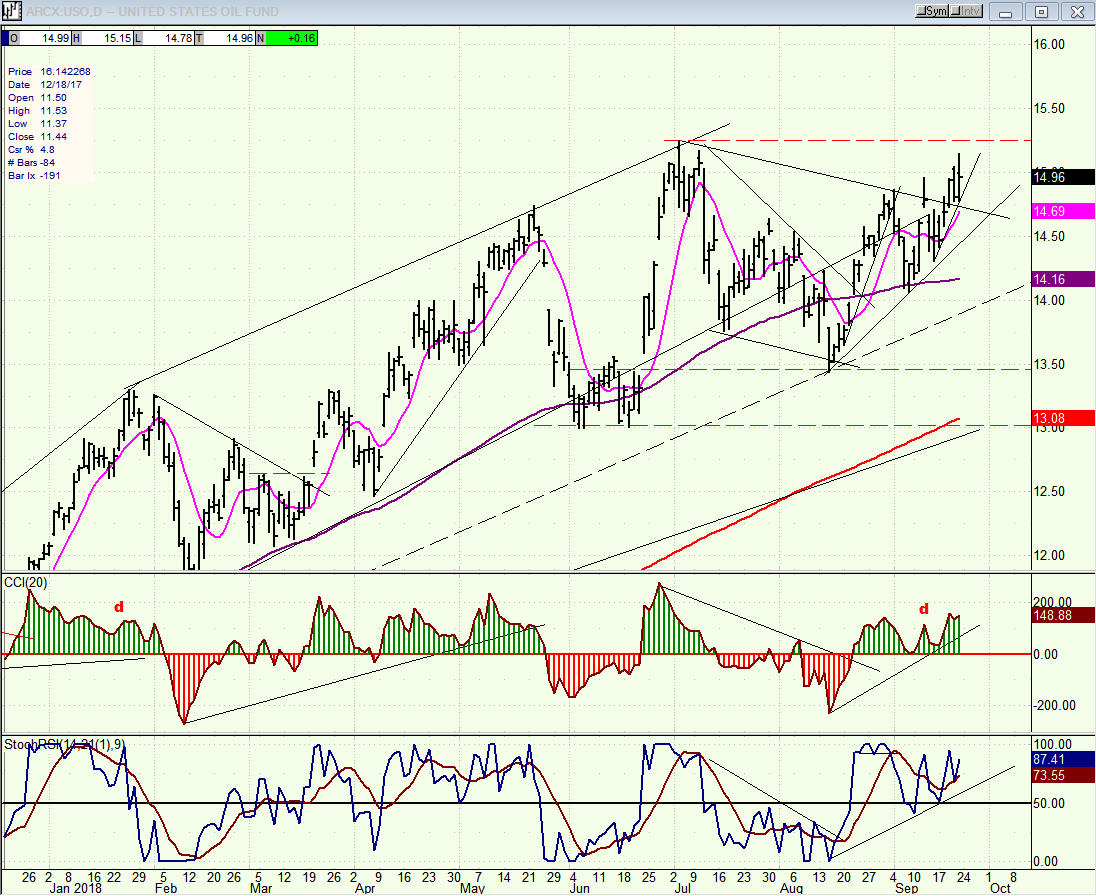
USO (United States Oil Fund)
USO is showing some good strength and is either re-testing its recent recovery high of 15.5 -- in which case there should be some additional consolidation to about 14.00 before breaking out -- or it is ready to move to its next target of 16.50 before a longer correction.
Summary
My call for a correction last week resulted only in a retracement of 20 points in the SPX before another upside reversal occurred which has already taken it to 2940, and may push a little higher before a more severe correction begins.
FREE TRIAL SUBSCRIPTON
With a trial subscription, you will have access to the same information that is given to paid subscribers, but for a limited time period. I think you will find that knowing how far a move can carry is one of the most useful benefits of this service, whether you are a trader or an investor -- especially when this price target is confirmed by reliable indicators which give advance warning of a market top or bottom. Furthermore, cycle analysis adds the all- important time element to the above price projections.
For a FREE 4-week trial, further subscription options, payment plans, and for general information, I encourage you to visit my website at www.marketurningpoints.com.
The above comments about the financial markets are based purely on what I consider to be sound technical analysis principles. They represent my own opinion and are not meant to be construed as trading or investment advice, but are offered as an analytical point of view which might be of interest to those who follow stock market cycles and technical analysis.

When Andre Gratian was a stock broker years ago, a friend introduced him to technical analysis of the market. Consequently, it is not an exaggeration to say that Andre fell in love with this approach! Ever since then, it has become an increasingly important part of his professional life. Gratian has studied the works of Wyckoff, Edwards & Magee, Edward J. Dewey (cycles) and many others. However, one of my most profitable undertaking has probably been to study Point & Figure charting, which he finds invaluable in analyzing stocks and indices. If he were restricted to one methodology, this is the one that he would choose. This well-rounded background has given him what he feels to be a special insight into the stock market, facilitating the recognition of meaningful patterns and the ‘turning points’ in all trends, whether they be short or long term. Andre feels very comfortable discussing the stock market and passing on meaningful information to others. His subscribers include individuals and money managers throughout the world. Moreover, his Newsletters are currently published on several financial sites, here and abroad.


