Technical Analysis Of The Markets


Current Position of the Market
SPX: Long-term trend – Bullish, but correcting within the long-term bull market trend.
Intermediate trend – bearish correction which could retrace as low as 2200 before it is complete
Analysis of the short-term trend is done on a daily basis with the help of hourly charts. It is an important adjunct to the analysis of daily and weekly charts which discusses the course of longer market trends.
New low in store?
Market Overview
Last week, SPX declined over 100 points to a new closing low and is ready to challenge its intra-day low of 2604. DJIA matched it with a loss of 1127 points for the week. But NDX was the worst performer, dropping 340 points for a new correction low. SPX is approaching a support level just above the former low of 2604. Perhaps for this reason, or because of the Thanksgiving holiday, breadth was relatively bullish in the last couple of days. Does that mean that it will hold in this area before staging a good rally?
If selling continues into next week, it will amount to a change of structure with a new low for the A wave (SPX 2545?) before we get the B wave rally. Should this be the case, we are looking at a more protracted bear market in terms of both time and price than was originally estimated. We’ll take another look at the SPX weekly chart to show that a decline of 700+ points is actually the most logical estimate that we can contemplate.
Chart Analysis (The charts that are shown below are courtesy of QCharts)
SPX weekly chart
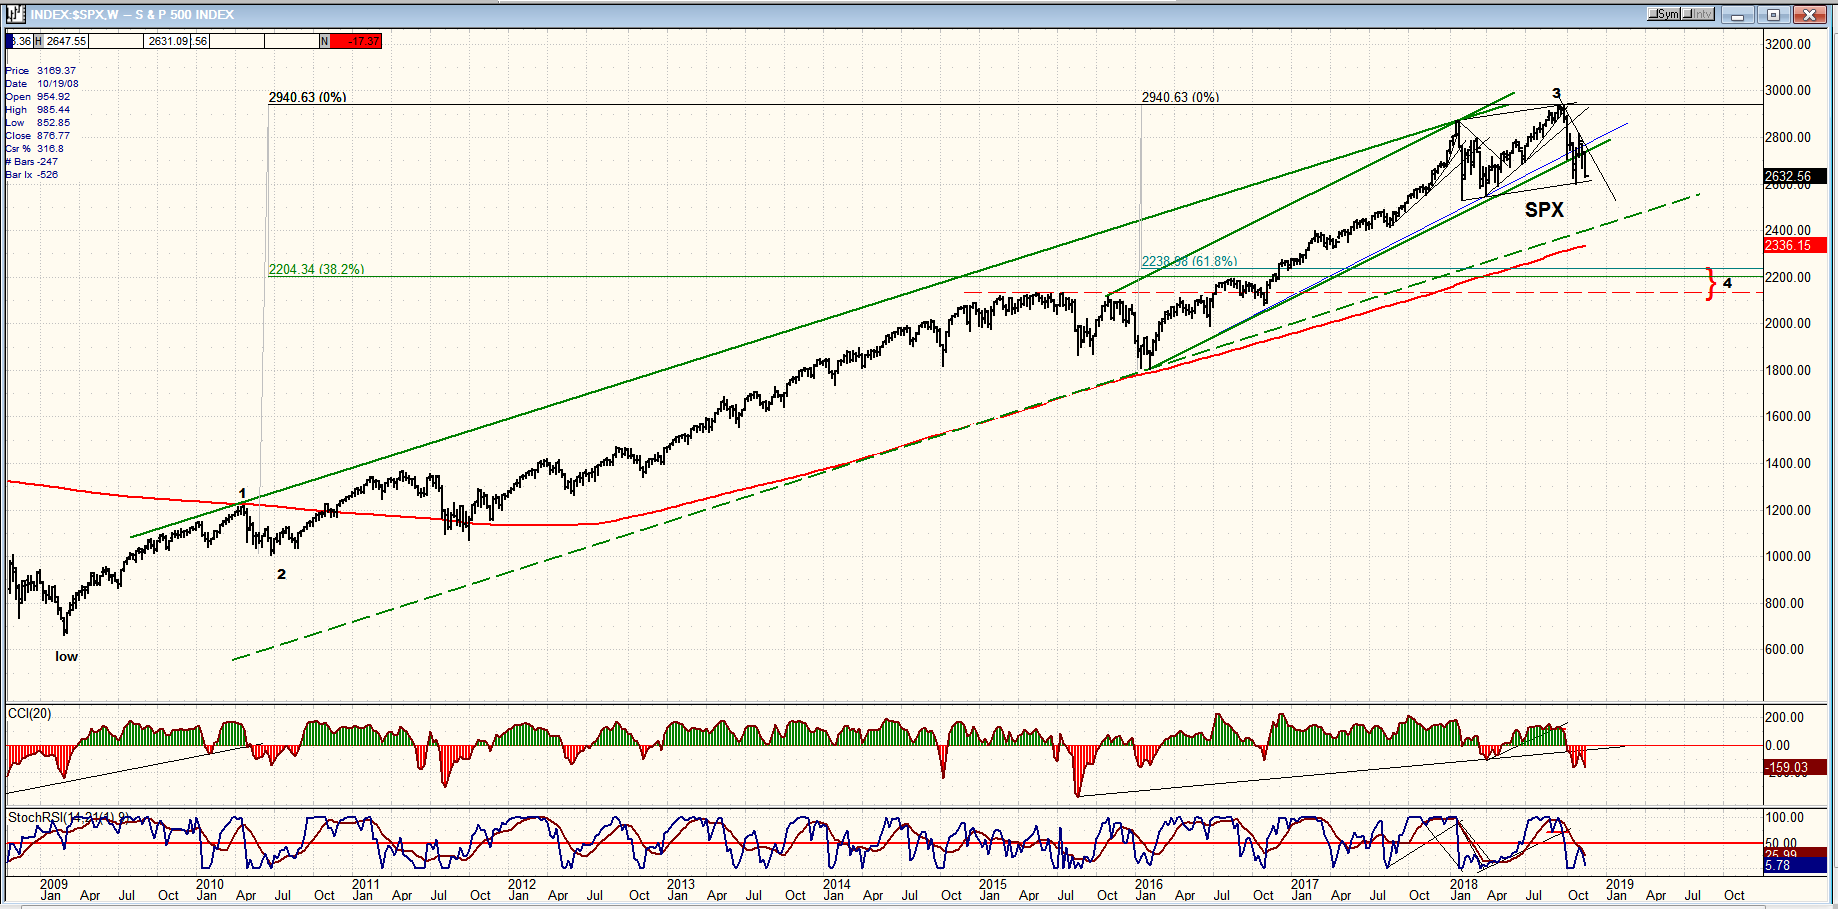
There is a debate (as always) about how long and deep this correction will be. The main purpose of displaying the chart below is to arrive at a potential target for the proposed evolving bear market. With the assist of Elliott Wave theorists, I have labeled the 2941 high of 9/16/18 as the top of wave 3 of the uptrend which started in March of 2009. That wave had its start at 1011 in June 2010 and traveled 1930 points before coming to an end. Since it is normal for a correction to retrace anywhere from .382 to .618 of the previous wave, the minimum retracement we could expect from this uptrend should be down to about 2204, as shown on the chart. This retracement would measure 737 points, and it would correspond to a good support level, as you can see on the chart. But there is even better support below at the 2015 high of 2135, and since .382 is, after all, normally a minimum degree of retracement, it is not inconceivable that the expected bear market would end up measuring a little over 800 points before it is complete.
There is another factor which tends to support a potential retracement into that price area. It has to do with the wave which started at 1810 and concluded at 2941. This is the uptrend that I had originally considered when looking for a correction potential. In this case, a .618 correction of that distance would take the index back down to about 2240, which is a close match for the .382 retracement of the entire wave 3.
Of course, we must first break substantially below the February low of 2533 before we can say that we have started a major correction. If the projection presented in the Market Overview is correct, it may be a while before we can do this since we would first come close (2545) but remain above, have a substantial rally, and only then be in a position to break below that February low. This could take well into the new year to accomplish.
SPX daily chart
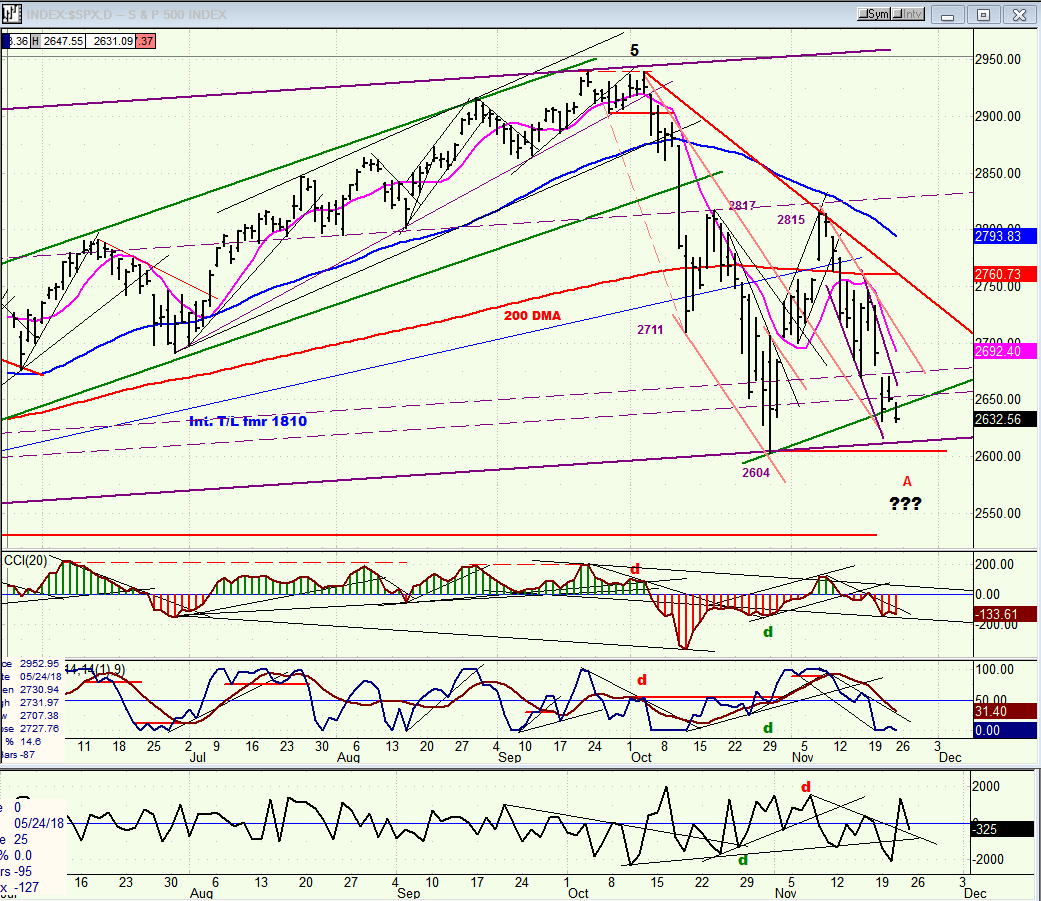
Originally, it was thought that the low of 2604 was the low of Wave A, as there is a clear a-b-c retracement to that level. But the continued weakness beyond 2671 suggests that corrective wave A has not yet made its low, and is likely to extend beyond 2604. The bottom trend line of the lateral channel is providing good support just above 2600, so we will have to see whether the index can hold that level. Last week’s market performance, which included a close at the week’s low, does not hold the promise that it will. If not, a logical low for A would be around 2545.
After A completes, we should start on B, which has the potential of reaching back to the vicinity of 1815. And then, we’ll have to deal with C! Those who favor a short and shallow correction believe that the completion of wave C will signal the end of the bear market. However, if the “logical” projections that were presented on the weekly chart (above) have any value, it’s unlikely that a completion of wave C would come anywhere near the levels discussed. The truth of the matter is that we can only make an educated guess based on historical precedents, as to how this correction will unfold and when it will come to an end. What we can do is to follow it closely and see if it continues to match our assumptions. If not, then we must look for a different scenario.
There is nothing in the indicators that suggests that the correction from 2815 is over. Based on P&F/Fibonacci, there are two targets that stand out: 2585-2570, and 2545.
SPX hourly chart
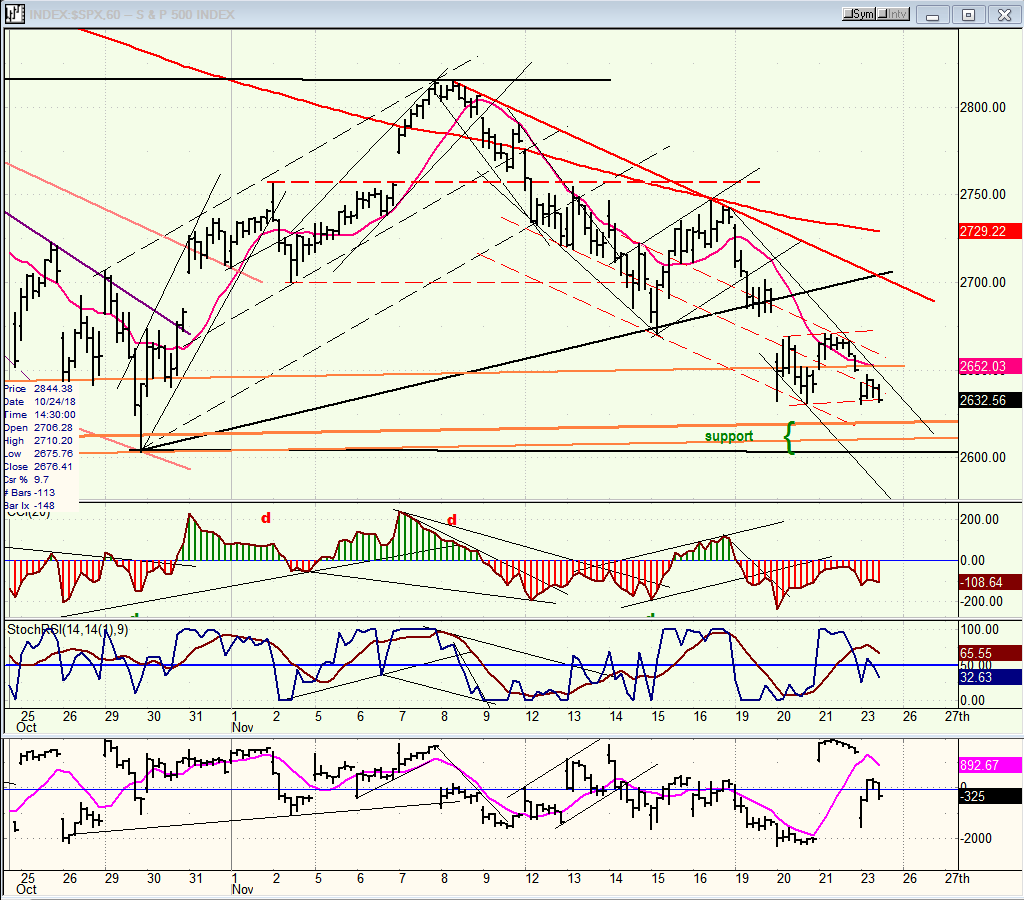
The hourly chart also looks negative. After losing 17 points in Friday’s shortened session, SPX closed on the low of the day and appears ready to challenge the band of support that lies just above 2600. It’s the last obstacle standing between the former low and a potential extension down to 2545 to complete the A wave. Although there is some mild positive divergence in the indicators, it could be quickly erased by a drop below 2600. Monday’s action should throw some light on what the index will do over the short-term.
Encouraging news for the bulls – at least temporarily -- is that, from wherever this decline makes its low, there should be a good rally (in fhe form of wave B) which will retrace a good portion of the entire decline from 2941.
DJIA, SPX, IWM, NDX (daily)
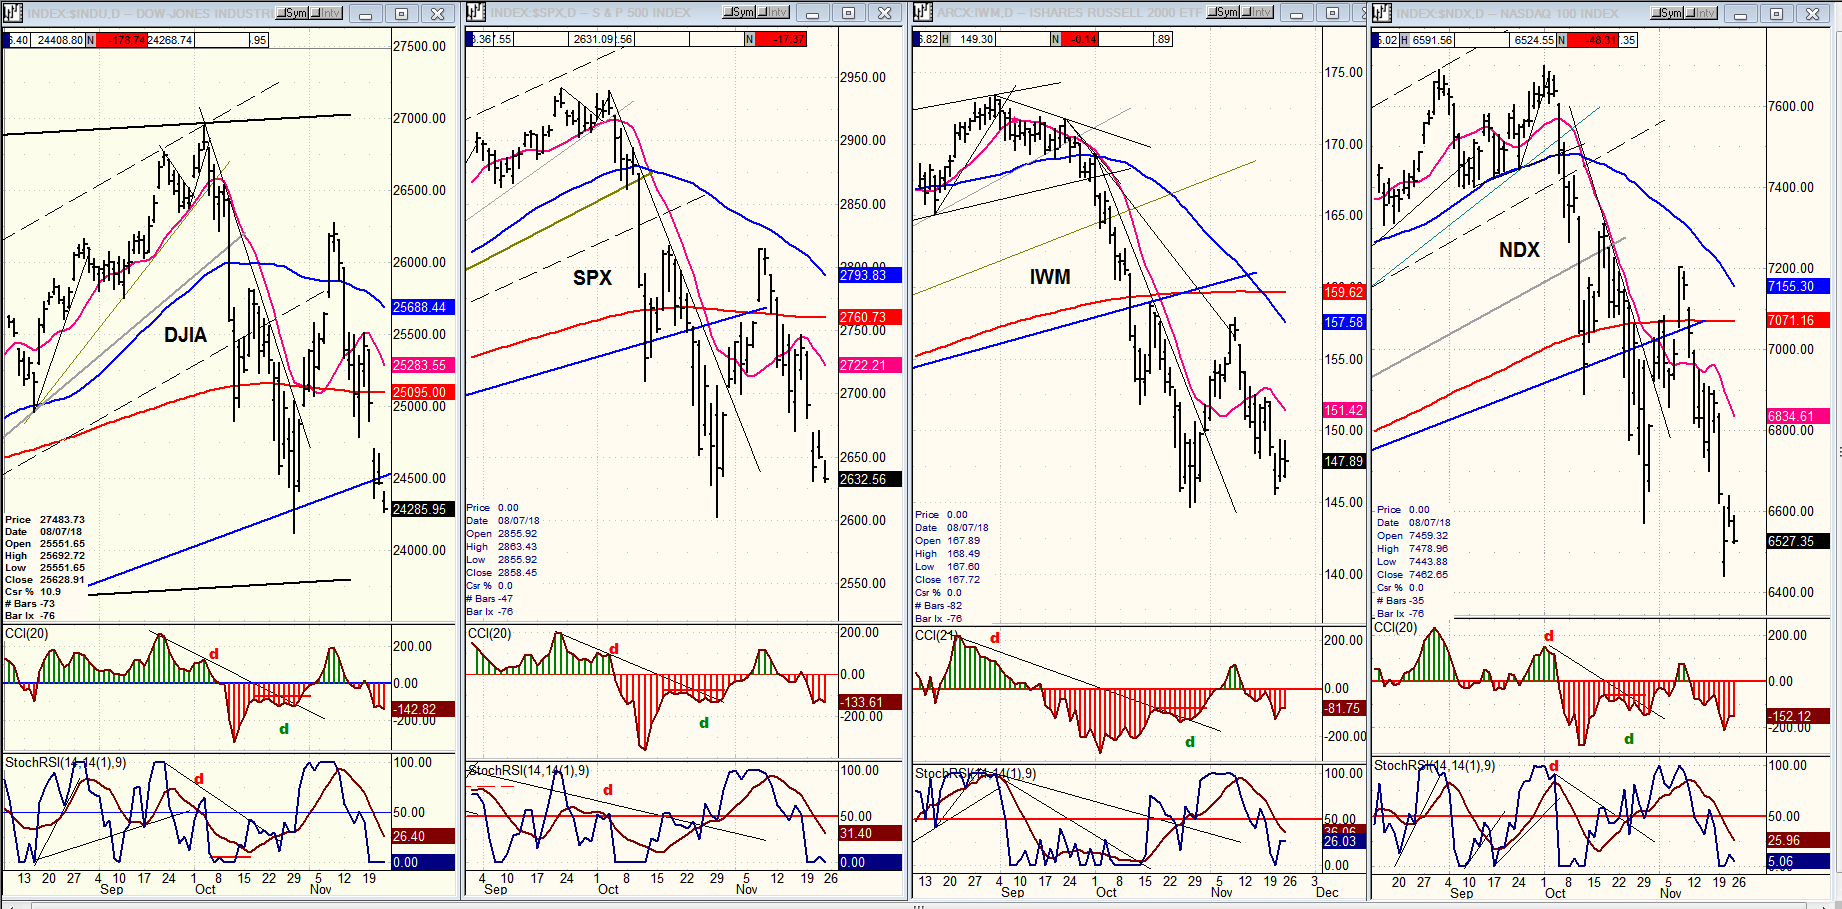
There has been a change in the relative order of weakness with NDX outdoing IWM as the worst performer since the correction started. It also seems as if DJIA, which clearly outperformed the other three, has caught up with them and no longer stands out. The first sign that weakness is subsiding will be when the bottom indicator (SRSI) in all four indexes turns up with the two lines crossing. Then, when the top oscillator (CCI) becomes green, we should at least be back in a short-term uptrend. Watch for IWM to take the lead!
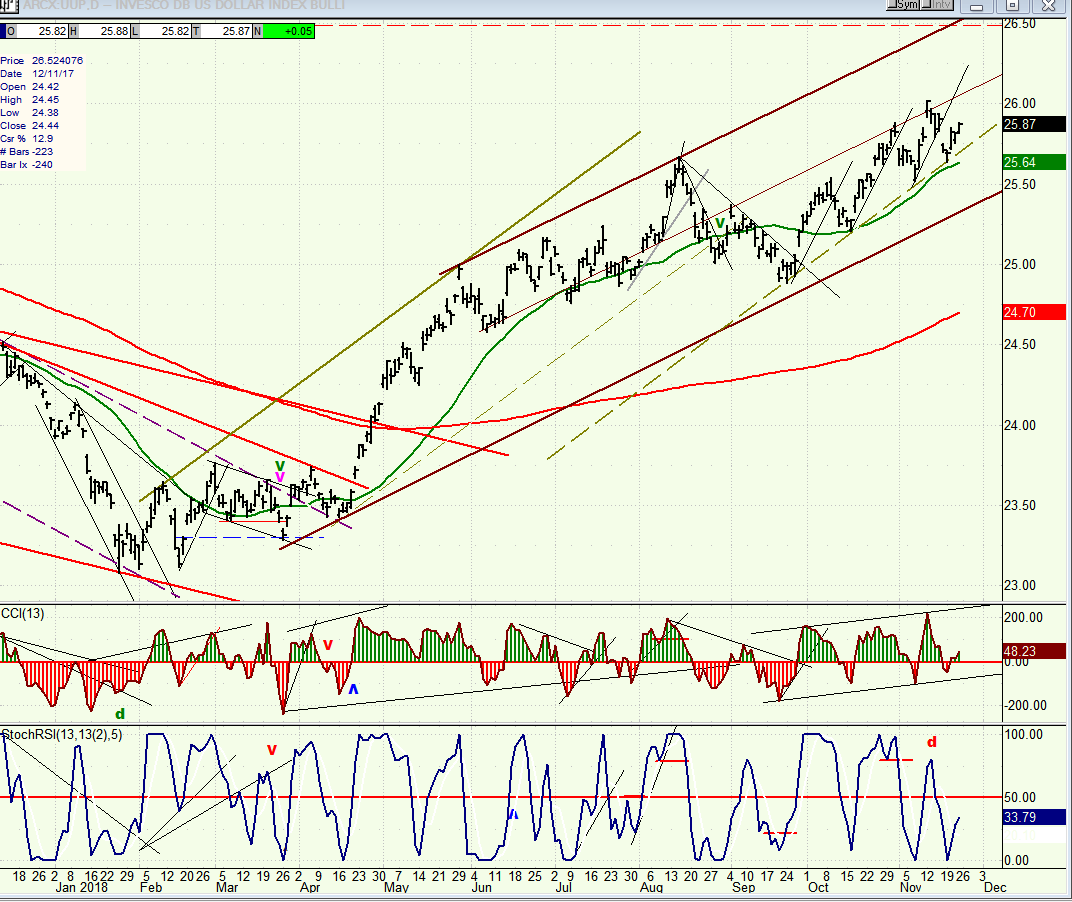
UUP (dollar ETF) daily
After a brief and shallow correction, UUP has resumed its uptrend and made a new high. As long as the price remains above the green 34-MA, the uptrend should continue. Even if it breaks below, the index should not suffer a very deep correction until it starts to trade outside of its lower channel line.
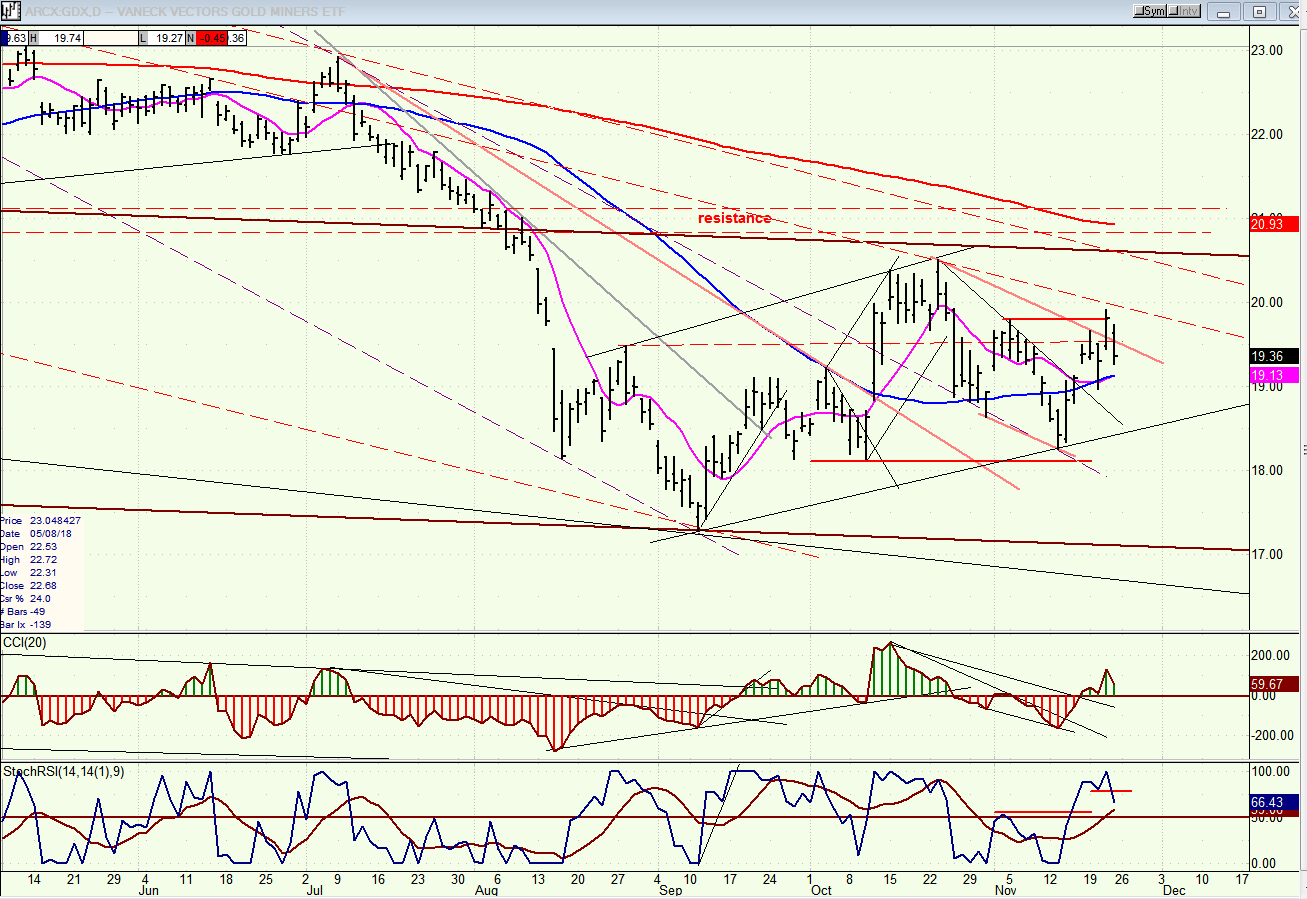
GDX (Gold miners ETF) daily
GDX made an attempt at breaking out of its short-term downtrend, but Friday’s deep pull-back does not bode well for a rally extension. The index continues to be at the mercy of UUP and, as long as the latter does not begin a significant retracement, sustained strength cannot be expected of GDX. With two important cycles scheduled to make their lows around the first of the year, GDX may have to wait until they bottom to start a good uptrend.
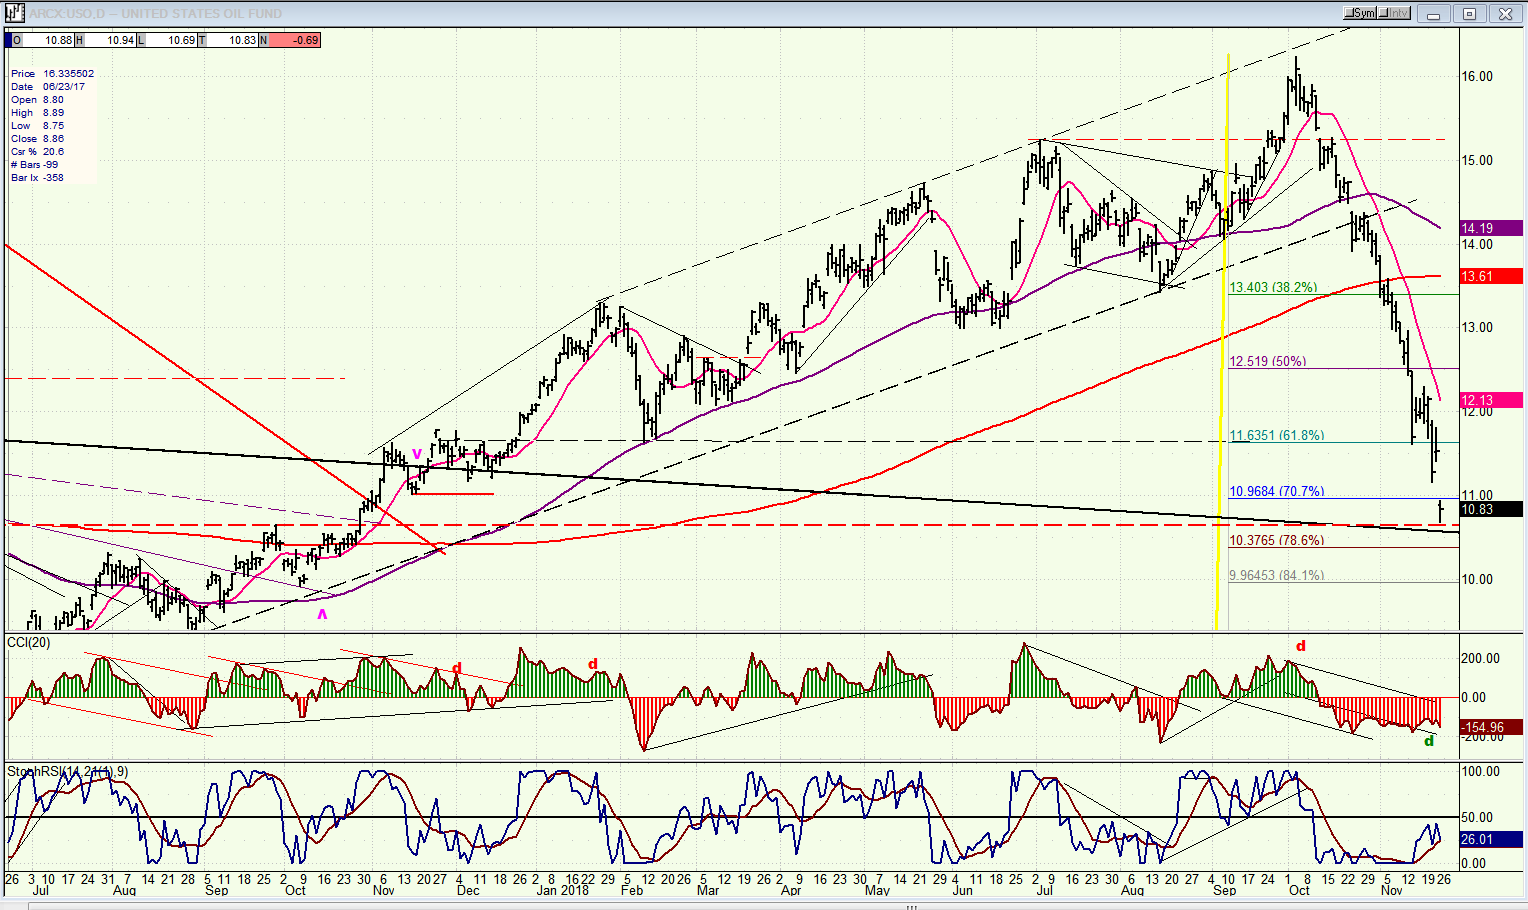
USO (United States Oil Fund) daily
USO has retraced about seventy-five percent of its advance in a fraction of the time that it took to complete it. Although it may finally find support in this area, it should not be expected to turn on a dime, but rather to spend some time building a base.
Summary
SPX is making a structural change in the first leg of its correction. Instead of having ended its A wave at 2604, it now looks as if it will not complete it until (based on P&F/Fibonacci projections) it declines down to about 2545. Only then, will it be ready to start on the B wave. However, if normal corrective parameters prevail, it will take more than a simple A-B-C structure to complete the intermediate decline which started from 2941.
FREE TRIAL SUBSCRIPTON
With a trial subscription, you will have access to the same information that is given to paid subscribers, but for a limited time period. I think you will find that knowing how far a move can carry is one of the most useful benefits of this service, whether you are a trader or an investor -- especially when this price target is confirmed by reliable indicators which give advance warning of a market top or bottom. Furthermore, cycle analysis adds the all- important time element to the above price projections.
For a FREE 4-week trial, further subscription options, payment plans, and for general information, I encourage you to visit my website at www.marketurningpoints.com.
The above comments about the financial markets are based purely on what I consider to be sound technical analysis principles. They represent my own opinion and are not meant to be construed as trading or investment advice, but are offered as an analytical point of view which might be of interest to those who follow stock market cycles and technical analysis.

When Andre Gratian was a stock broker years ago, a friend introduced him to technical analysis of the market. Consequently, it is not an exaggeration to say that Andre fell in love with this approach! Ever since then, it has become an increasingly important part of his professional life. Gratian has studied the works of Wyckoff, Edwards & Magee, Edward J. Dewey (cycles) and many others. However, one of my most profitable undertaking has probably been to study Point & Figure charting, which he finds invaluable in analyzing stocks and indices. If he were restricted to one methodology, this is the one that he would choose. This well-rounded background has given him what he feels to be a special insight into the stock market, facilitating the recognition of meaningful patterns and the ‘turning points’ in all trends, whether they be short or long term. Andre feels very comfortable discussing the stock market and passing on meaningful information to others. His subscribers include individuals and money managers throughout the world. Moreover, his Newsletters are currently published on several financial sites, here and abroad.


