Technical Analysis Of The Markets


Current Position of the Market
SPX: Long-term trend – Is the long-term trend resuming? Is this a B-wave? Too early to tell!
Intermediate trend – Initial rally is likely coming to an end.
Analysis of the short-term trend is done on a daily basis with the help of hourly charts. It is an important adjunct to the analysis of daily and weekly charts which discusses the course of longer market trends.
Trade Optimism Continues
Market Overview
Optimism re-surfaced on Thursday with authoritative opinions being expressed that the US-China trade talks have a good chance “for a win/win outcome”. This was undoubtedly responsible for picking up a flagging SPX and causing it to close with a new daily and weekly high. Signs of weakness were confined to breadth continuing to be less and less supportive of price, and a slight increase in the negative divergence in the daily momentum indicators.
A small congestion level which has a potential count for about a 50-point correction also formed last week, but this possibility can be eradicated by the index moving only a few points higher. We did close outside of the daily uptrend line and end of week action could be construed as a retracement toward the broken trend line; but this trend line has already been re-adjusted and will have to be again if we make a new high. Everything considered, it would take at least a daily close below 2764 before we could even hope to have a reversal of the trend.
In addition, only the faintest trace of relative weakness can be observed in the IWM at the hourly level which, like everything else mentioned above, can disappear instantly if we have a positive opening on Monday morning.
In conclusion, we’ll have to wait until next week to see if firmer signs of a rally top materialize.
Chart Analysis (The charts that are shown below are courtesy of QCharts)
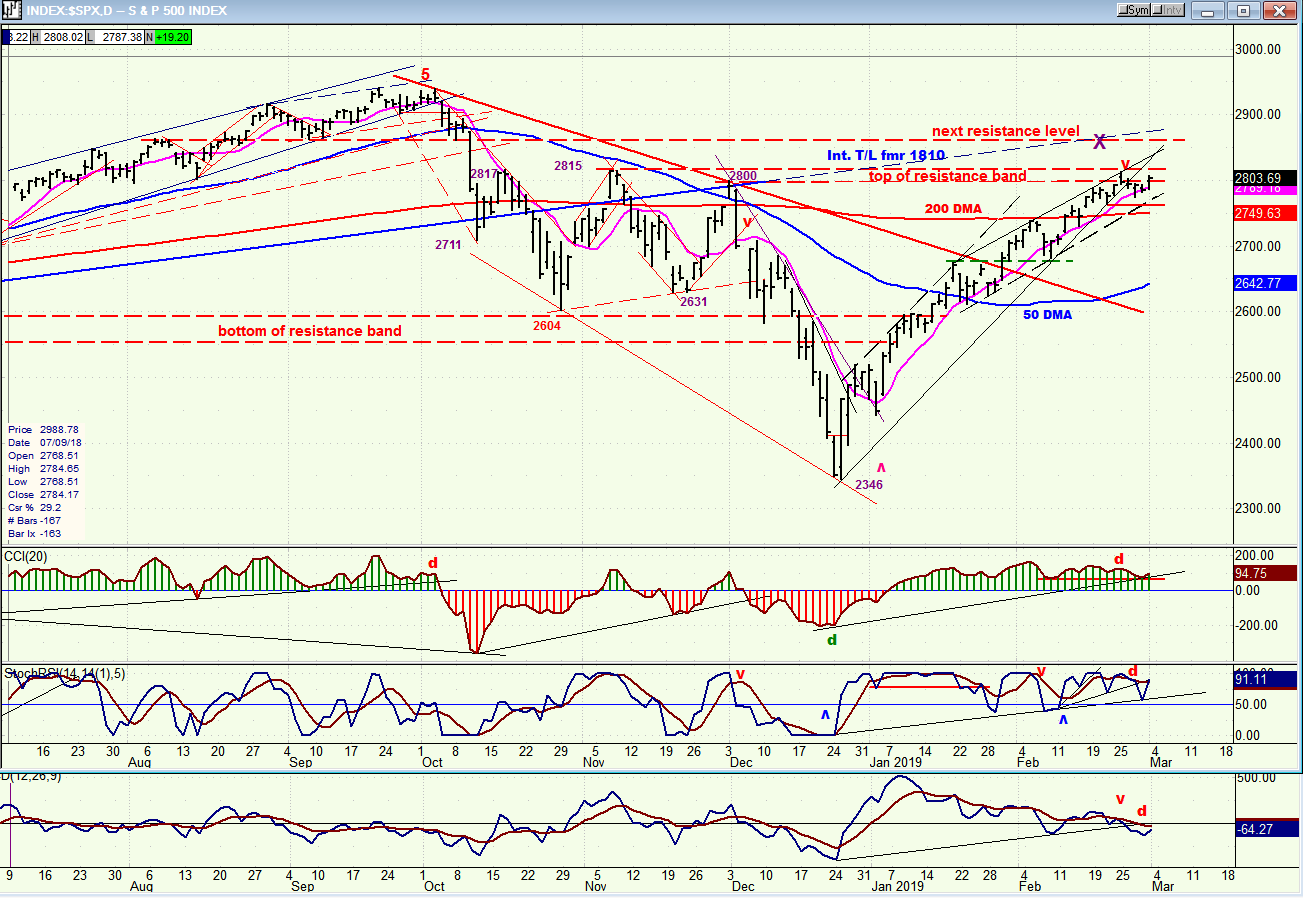
SPX daily chart
Let’s start by looking at the oscillators, because this is always where the first signs of a reversal appear. At the highs, the progression toward the end of a trend is nearly always from the bottom one to the top one, and it looks as if that process has already started since the bottom oscillator (A/Ds) has already gone negative. The top two (momentum) have turned down after showing negative divergence, but have remained positive. They will have to become negative before a reversal of the trend has taken place, and the top one is normally the last one to do so.
Next, we can see that the index remains above all the moving averages. We can’t even consider a turn until the shortest one (9-DMA) has been crossed on the downside. Notice that it has contained all (closing) pull-backs since the low was established. At the top of the market (9/16 to 9/30/18), the intermediate loss of upside momentum had brought the 9 and 50 MAs close together so that when the reversal occurred, the 50-DMA only supported price for three days before it also gave way. Now, when we reverse, we could initially find support at about the 200-DMA and, if we go lower right away, the blue MA is likely to give us additional support.
But, in any case, that won’t be for a while. Right now, we are looking for an end to the rally, and last week we did break a three-point trend line (an event which could be significant) although its angle is still fairly steep and it may have to be redrawn again. Our best bet to halt the rally is the resistance which exists up to 2815 and which has already been tested. If we go beyond, it could trigger stops and create a final climactic spurt in the advance, followed by an immediate reversal (emphasis on could).
We can go on speculating, but it won’t be over ‘till it’s over, and it will be obvious!
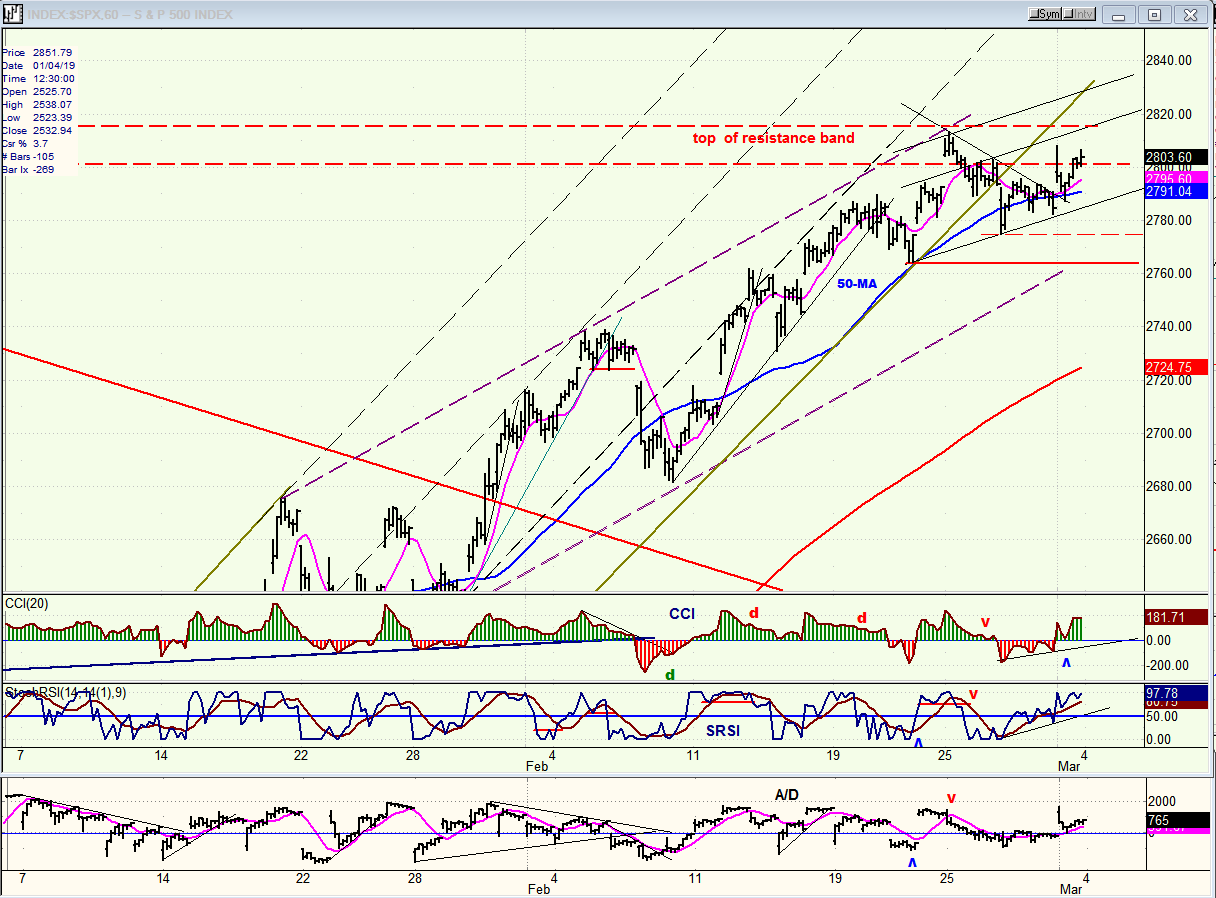
SPX hourly chart
Trends always start at the smallest price denomination, so we should see a reversal take shape on the hourly chart before we see one on the daily chart. Friday’s price pattern is non-committal. We held the former short-term low of 2765.13 and started a minor up-move which stayed below Tuesday’s high of 2813.49. If we refrain from exceeding last Tuesday’s high on Monday, and start a move which takes us below the dashed line (2775.13), there is a good chance that a reversal is in the making, especially if we continue and break and close below 2764.78. To get this started, all we have to do is to close below the blue 50-hr MA on an hourly basis; and this may trigger enough follow-through selling to take us below the below the dashed red line.
All the hourly oscillators did close in the green on Friday, so they would have to turn down almost right away to start a decline.
Staying in the trading range for another day or two before turning lower would be beneficial, since it would create more distribution which would add to the extent of the initial decline.
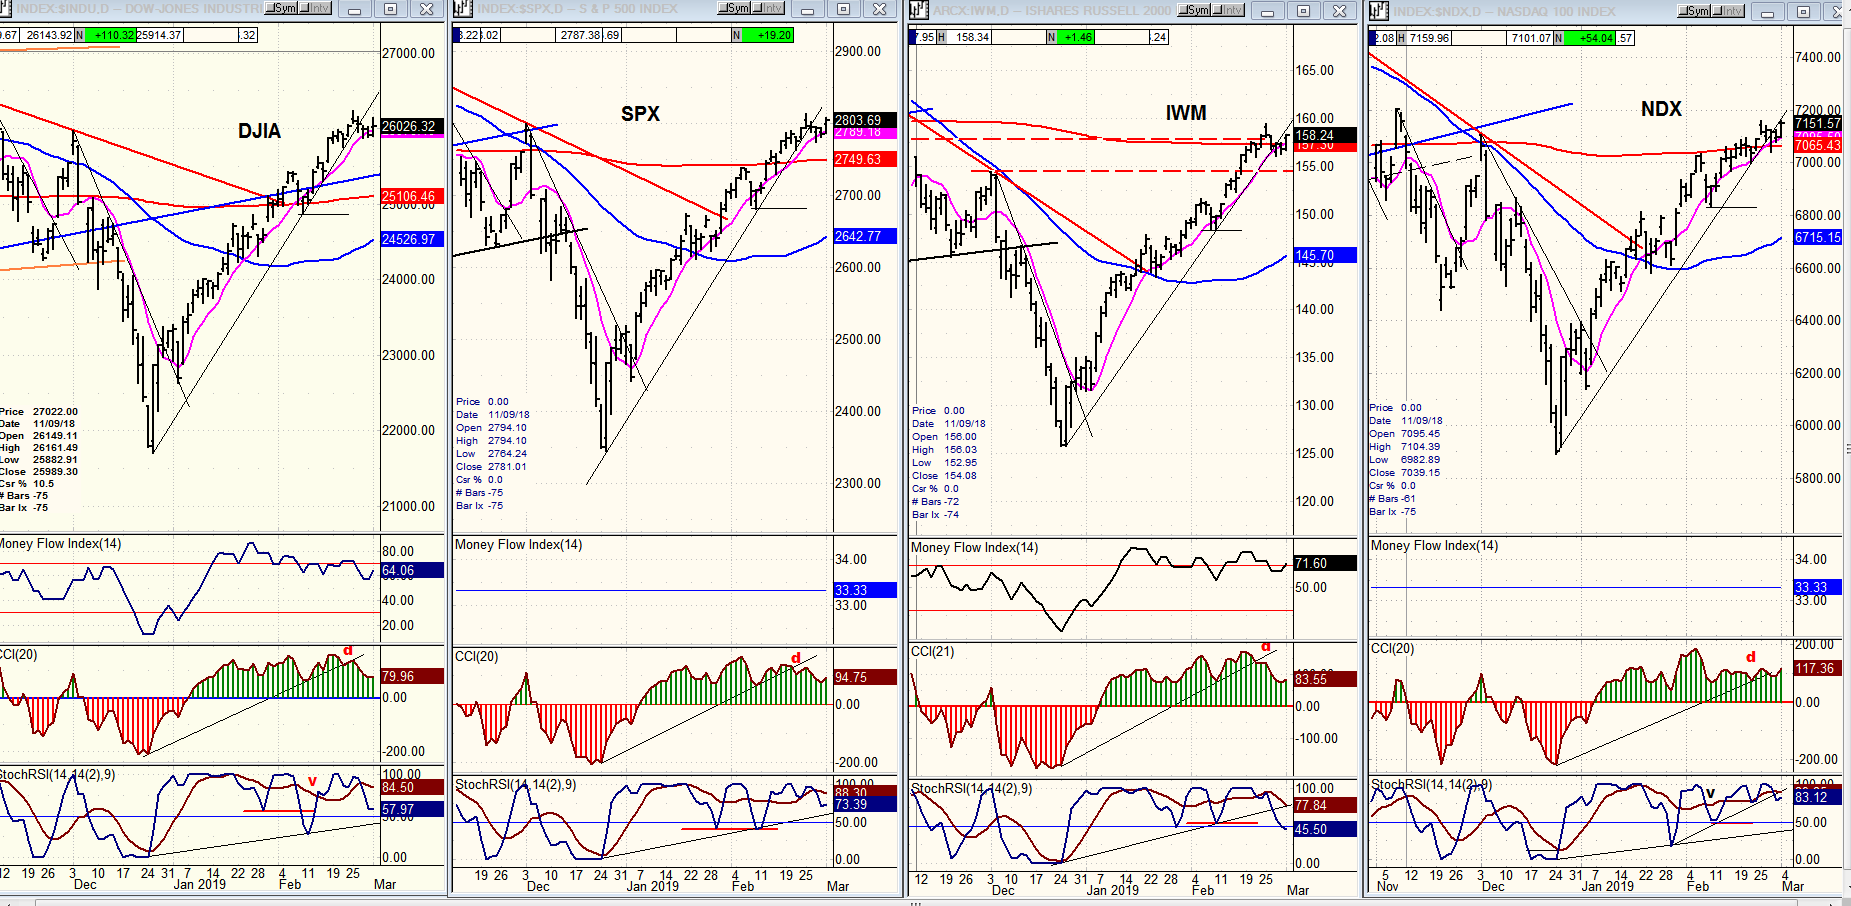
DJIA, SPX, IWM, NDX (daily)
All four indexes have broken their uptrend line and all four have broken above their 200-DMA, although IWM only barely so, and NDX not that much more. But IWM has also broken above the resistance band, while the other three have not. In other words, there is not much we can conclude from all this and we’ll just have to wait for a little more definition.
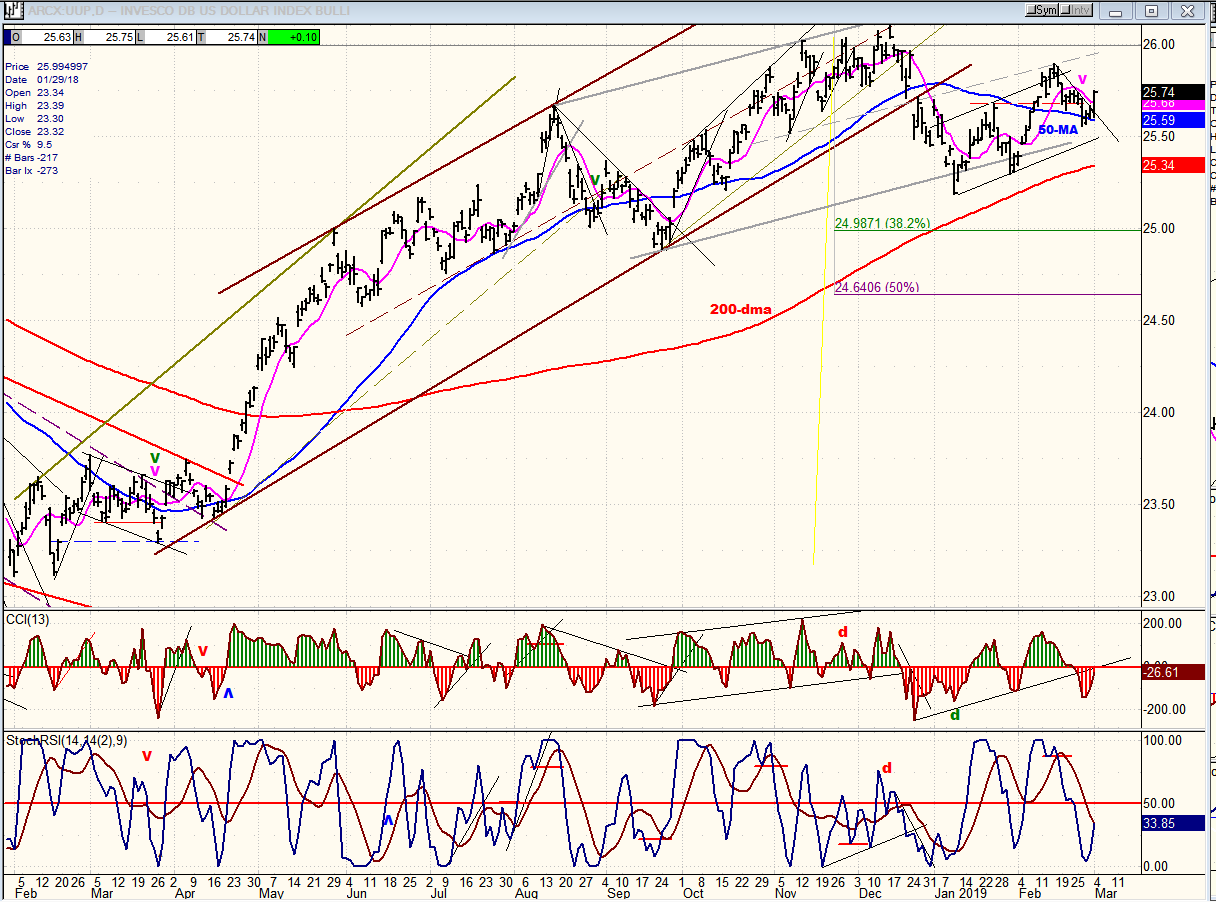
UUP (Dollar ETF) (daily)
In the last letter, I discussed the possibility that this index could find support at its 50-DMA, which is apparently what it did, and bounced. If it cannot move below over the next 2 or 3 days, there is a good chance that it will re-test its high and perhaps even make a new high.
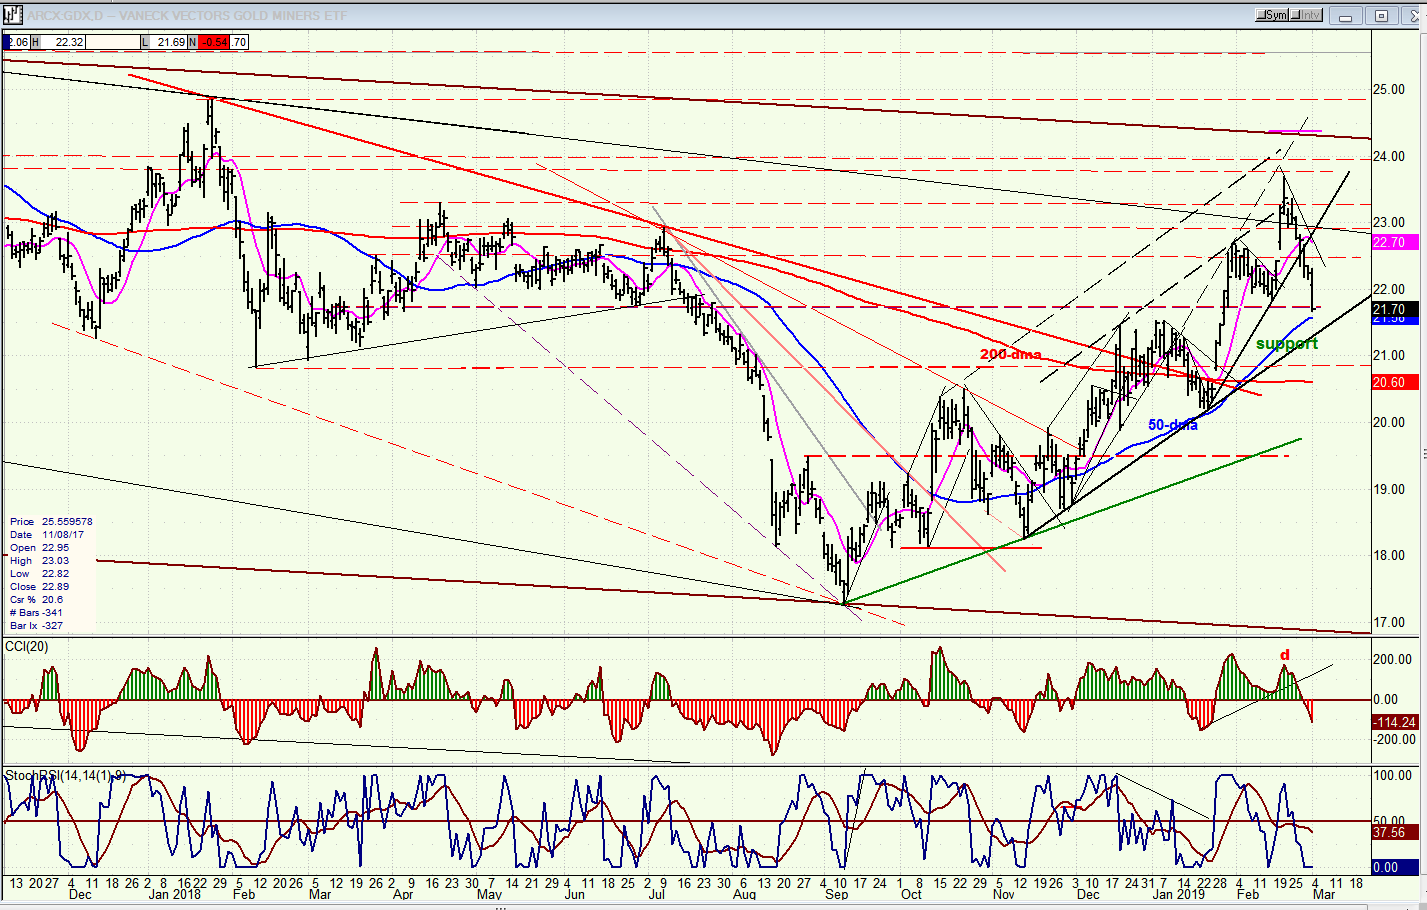
GDX (Gold miners ETF) (daily)
The lack of weakness in UUP is having an effect on GDX which has confirmed that it has put an end to its rally and is now correcting its recent advance. It could find temporary support between the 50-DMA and its uptrend line, but the rapidity with which it has retraced after making its high suggests that it may have started something more than just a minor correction.
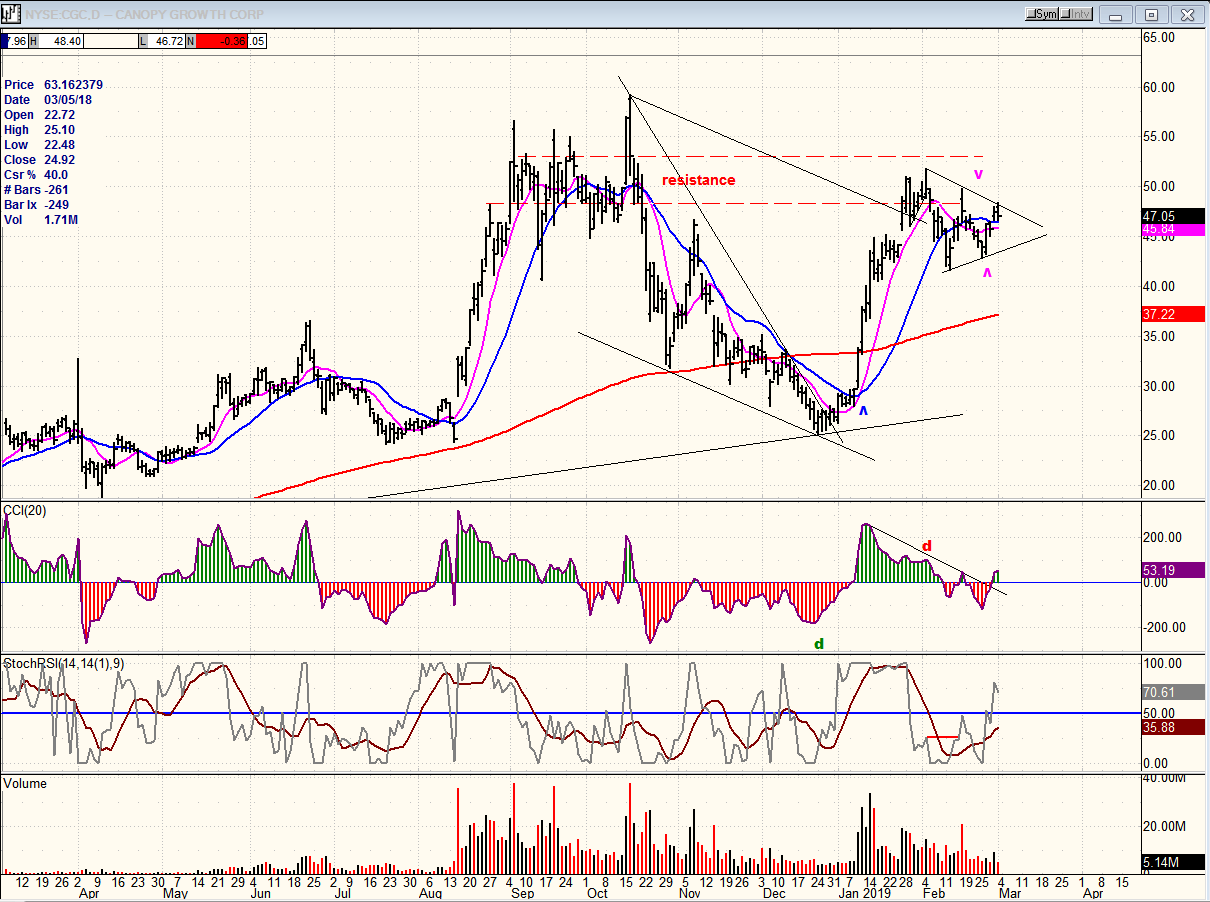
CGC (Canopy Growth) (daily)
CGC is making what could be a bullish continuation pattern in the form of a triangle. Should there be one more small pull-back which holds above the bottom trend line, followed by a move out of the pattern on the top side, this would most likely suggest that a move to challenge the former high is underway.
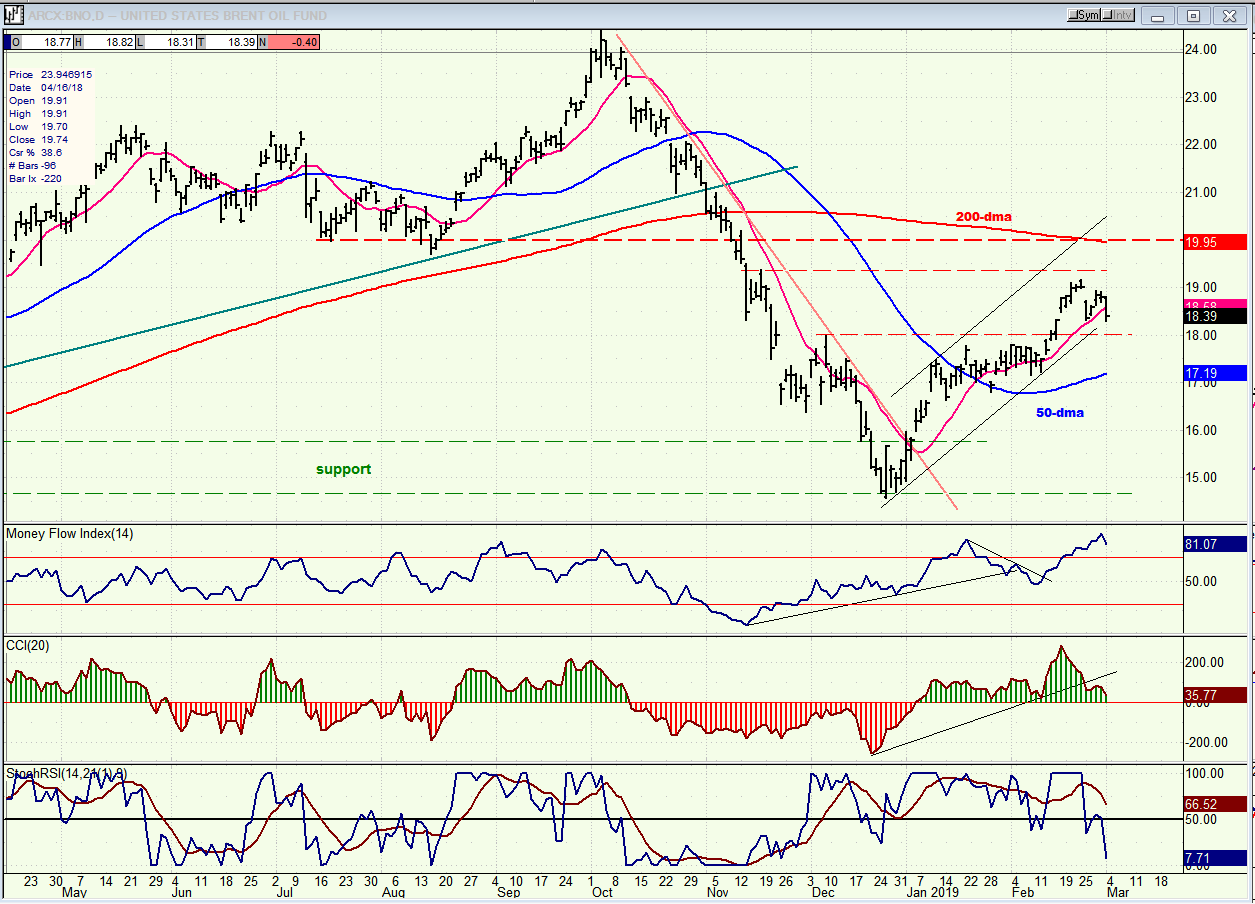
BNO (United States Brent Oil Fund) (daily)
BNO is undergoing a minor correction which (so far) looks like a wave 4 from the consolidation low of 16.81. Next week should clarify.
Summary
Early next week could be a decisive time frame for the market. If SPX cannot surpass last Tuesday’s high and retraces below 2764, we can pretty much assume that we have ended the rally from 2346, and that a countertrend move has started. On the other hand, if we make a new high with enough momentum behind it, more waiting will be required for the eventual and inevitable reversal!
FREE TRIAL SUBSCRIPTON
With a trial subscription, you will have access to the same information that is given to paid subscribers, but for a limited time period. I think you will find that knowing how far a move can carry is one of the most useful benefits of this service, whether you are a trader or an investor -- especially when this price target is confirmed by reliable indicators which give advance warning of a market top or bottom. Furthermore, cycle analysis adds the all- important time element to the above price projections.
For a FREE 4-week trial, further subscription options, payment plans, and for general information, I encourage you to visit my website at www.marketurningpoints.com.
The above comments about the financial markets are based purely on what I consider to be sound technical analysis principles. They represent my own opinion and are not meant to be construed as trading or investment advice, but are offered as an analytical point of view which might be of interest to those who follow stock market cycles and technical analysis.

When Andre Gratian was a stock broker years ago, a friend introduced him to technical analysis of the market. Consequently, it is not an exaggeration to say that Andre fell in love with this approach! Ever since then, it has become an increasingly important part of his professional life. Gratian has studied the works of Wyckoff, Edwards & Magee, Edward J. Dewey (cycles) and many others. However, one of my most profitable undertaking has probably been to study Point & Figure charting, which he finds invaluable in analyzing stocks and indices. If he were restricted to one methodology, this is the one that he would choose. This well-rounded background has given him what he feels to be a special insight into the stock market, facilitating the recognition of meaningful patterns and the ‘turning points’ in all trends, whether they be short or long term. Andre feels very comfortable discussing the stock market and passing on meaningful information to others. His subscribers include individuals and money managers throughout the world. Moreover, his Newsletters are currently published on several financial sites, here and abroad.


