Technical Analysis Of The Markets


Current Position of the Market
SPX: Long-term trend – Is the long-term trend resuming? Is this a B-wave? Too early to tell!
Intermediate trend – The trend which started at 2346 appears to be decelerating and forming a top.
Analysis of the short-term trend is done on a daily basis with the help of hourly charts. It is an important adjunct to the analysis of daily and weekly charts which discusses the course of longer market trends.
Ending Diagonal Pattern?
Market Overview
A week ago Friday, SPX completed a short-term base, and last Monday the uptrend from 2346 resumed with a 35-point bang! For the rest of the week, prices continued to move higher, but more tentatively until Friday when, assisted by a favorable jobs report, the index reached the ~2890 projection which had been forecast by the small congestion pattern that had formed above 2790. With that short-term count exhausted, SPX should now begin to retrace.
Looking at the longer pattern from 2722, some deceleration within the rally from 2346 is evident. Had we kept going at the same momentum rate, SPX would be approaching 3000 by now. Clearly, stocks are meeting with increasing selling, and the pattern that is being formed is beginning to look like an ending diagonal. If we pull back next week -- which is expected -- we will see if the structure continues to evolve in this manner. For this, we would need to pull-back down to a least 2540 before starting on the final e-wave of the formation.
By the end of next week, we should have a better perspective of what the market is doing. In the meantime. I am still of the opinion that, whatever the structure turns out to be, SPX is in the process for forming a large congestion top which started at 2722.
Chart Analysis (The charts that are shown below are courtesy of QCharts)
SPX daily chart
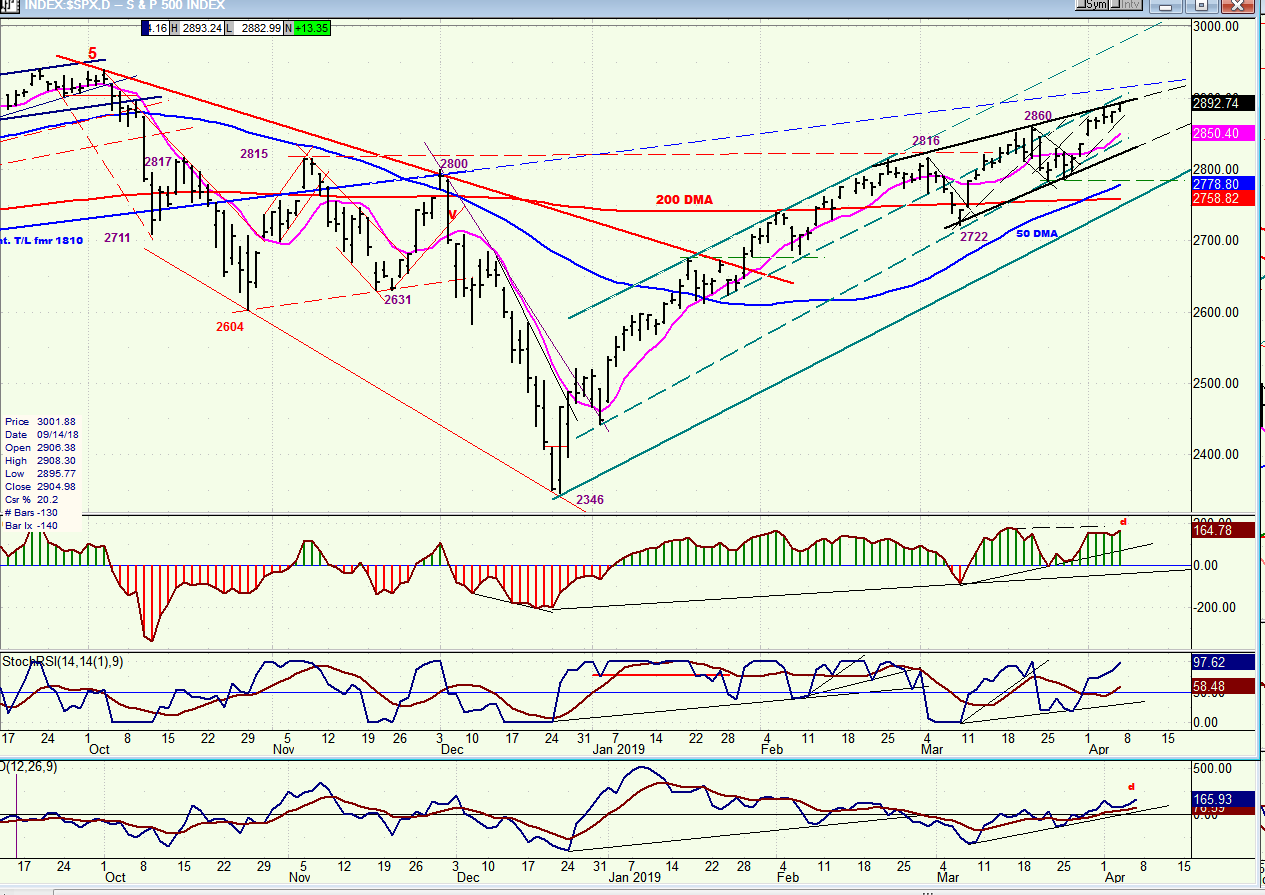
It is clear that after it reached 2860, the trend of the SPX became a little more labored. The price channel shifted to a less aggressive uptrend (marked with new boundaries) which are forming what could be a wedge pattern -- providing we start pulling back as early as Monday so that the top line is not violated. Since it is premature to call this an ending diagonal, let’s see where we are by the end of next week. The current structure is not set and could morph into several other possibilities, one of which will define itself more and more as we move forward.
The larger base pattern at the 2450 level appears to have used up about 95% of its bullish energy with a move to 2890-2930 satisfying the accumulation count. The small base which formed above 2790 also produced a confirming count to 2890 which was reached Friday, suggesting that we are now ready for another short-term correction at least. If that is limited to a retracement of about 50 points, followed by the formation of another small consoliation phase, we should be looking for a potential e-wave to about 2930 which will arrest the run from 2346.
There is still too much strength displayed by the daily oscillators to expect much weakness immediately. Nor does the P&F chart portray the kind of distribution which normally takes place at an important top. This is why we must wait another week (or more) until the SPX price pattern has met all the conditions and characteristics of a top.
SPX hourly chart
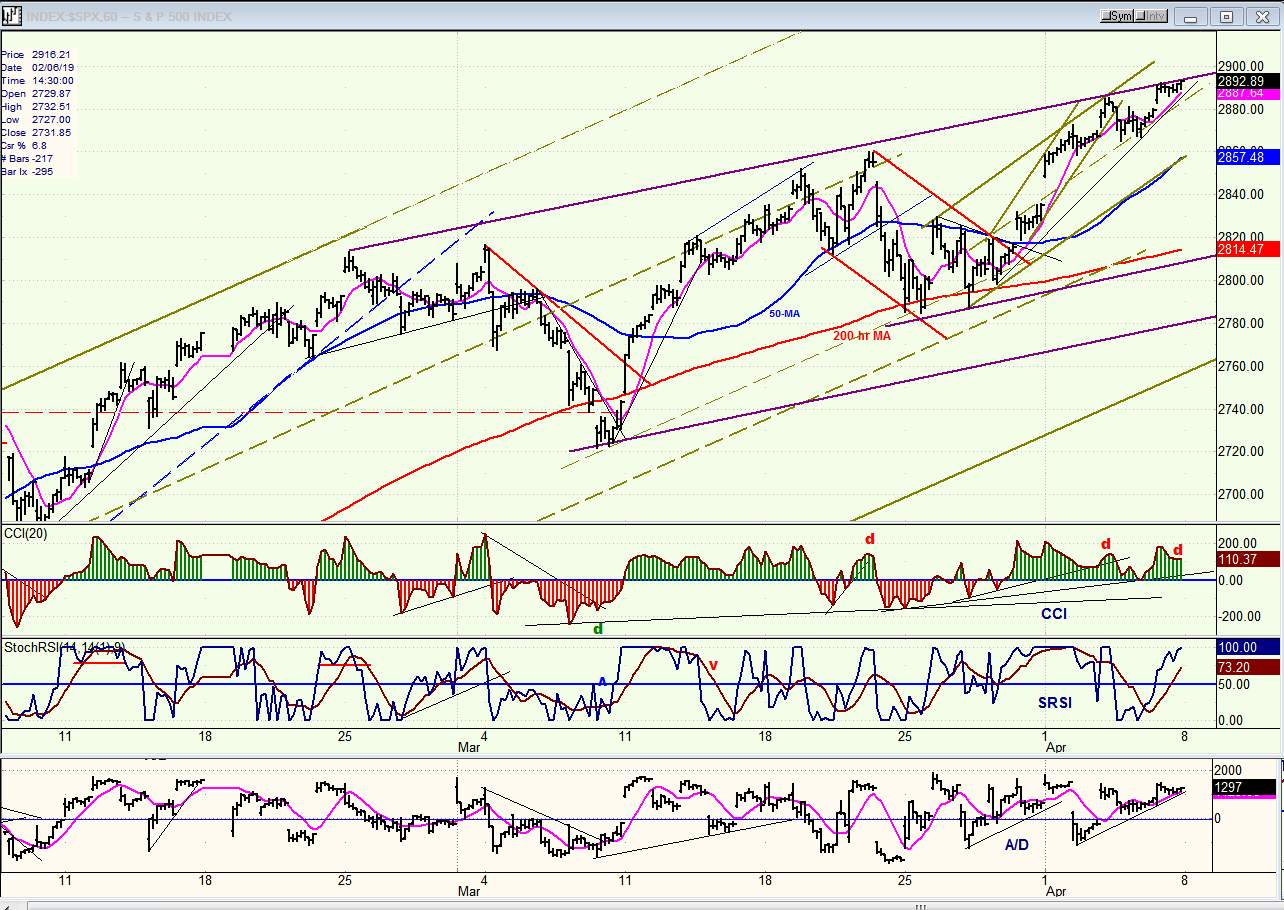
As an alternative to an ending diagonal pattern giving us a 50-point retracement starting on Monday, followed by an e-wave to about 2930, the index may simply be making a rounding top as more and more deceleration takes place. In this case, we could still have a pull-back of about 50 points, followed by another short rally which may not make a new high. By then, the price pattern will indeed have formed a rounding top which, in supply/demand terms, simply means that buying power is becoming exhausted and sellers are appearing in greater and greater numbers.
In this case, the small channel appearing at the top will be representative of the buying power exhaustion taking place with prices rolling over and breaking the lower small channel line, and eventually breaking out of the larger channel. This would continue to form the larger congestion pattern which I believe started at 2722 and which could persist for another two or three weeks before it has been completed and prices start moving out of the main channel.
This is just one more possibility of what is taking place; and that’s all it is until enough time has passed to clarify the market’s true intention.
SPX, IWM, NDX (dly)
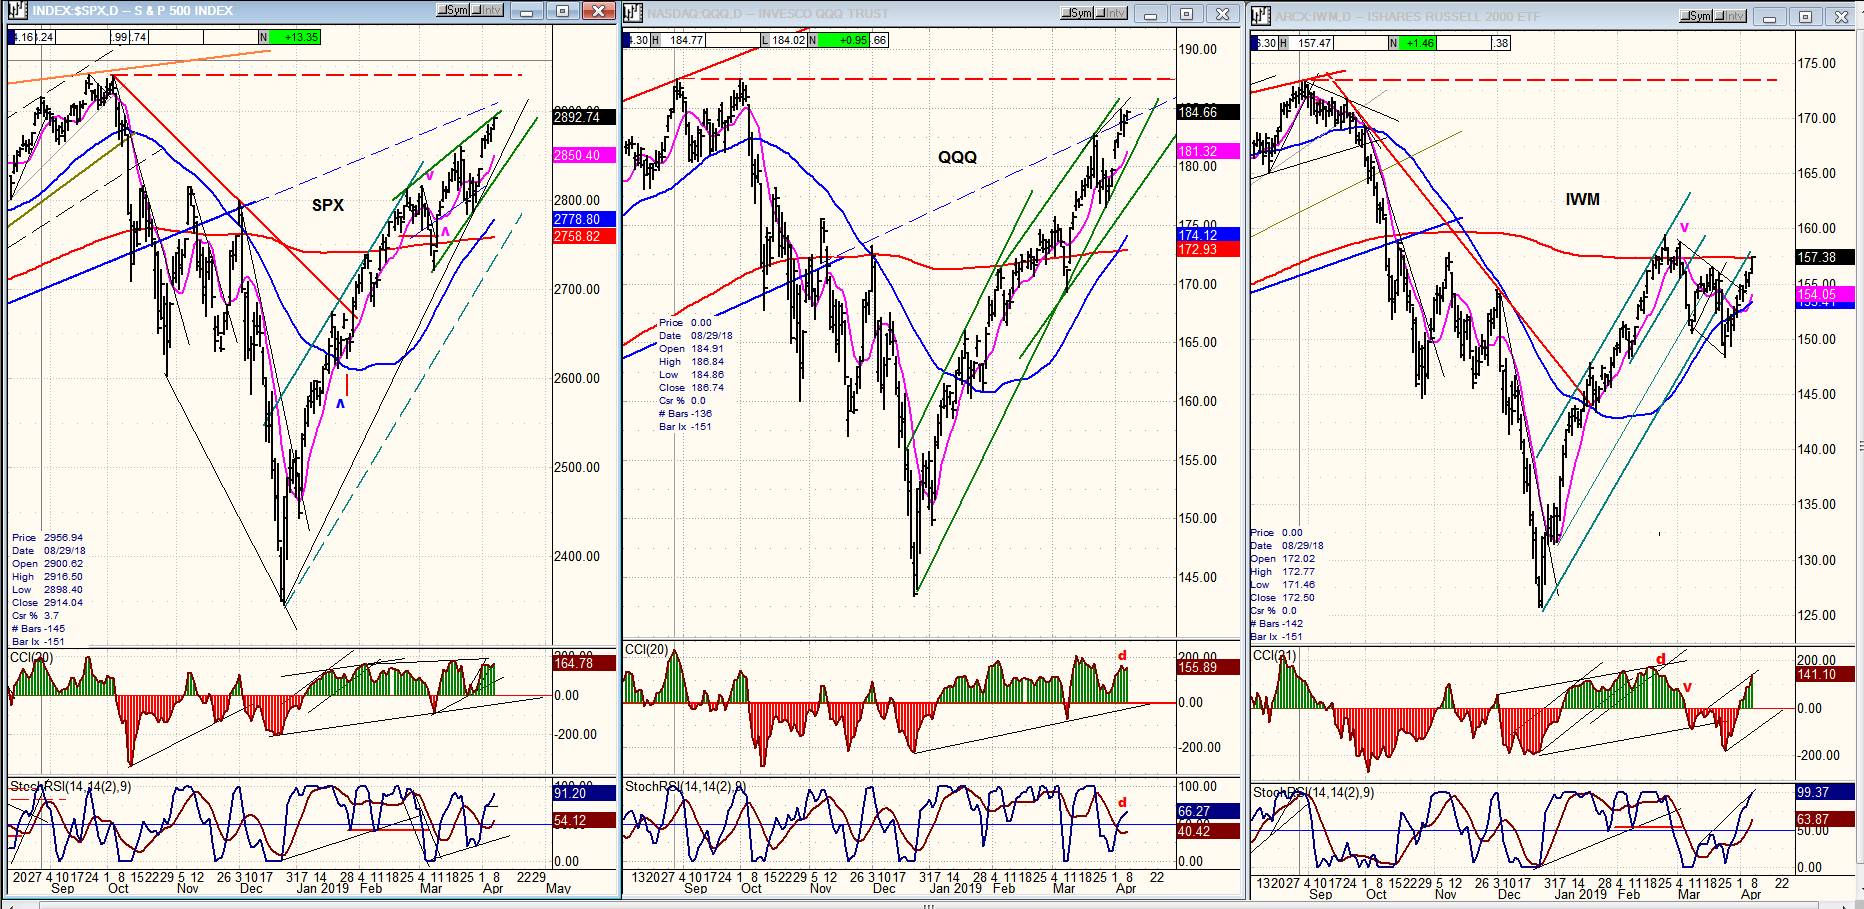
There is no question that IWM remains relatively weaker than SPX and QQQ. In addition, all three indexes appear to have reached individual short-term (and perhaps intermediate-term) targets so there may not be room for completing more complicated patterns than they already have. Again, we should know more by the end of next week.
UUP (Dollar ETF) (daily)
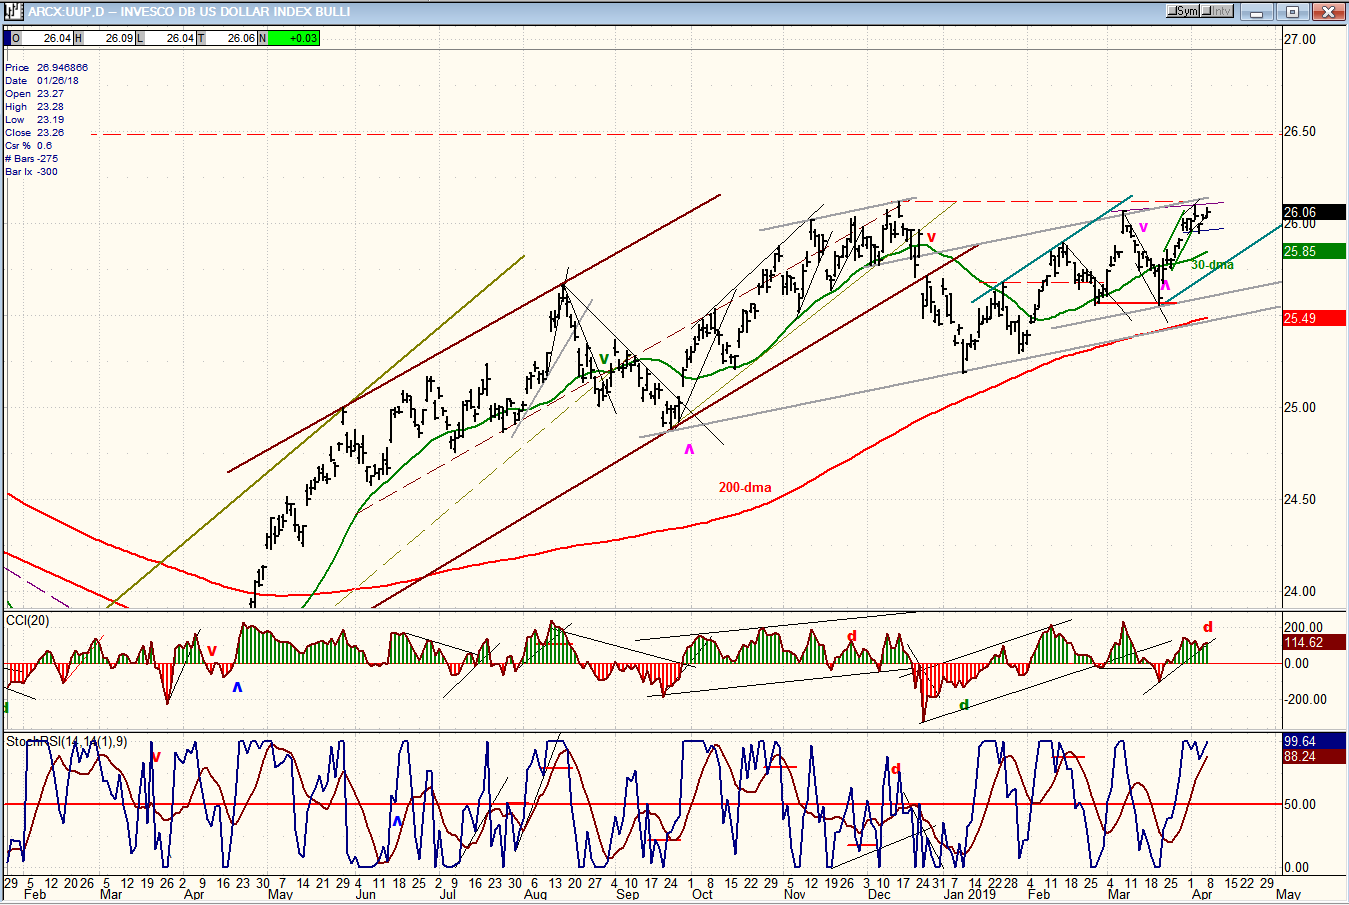
UUP has pushed a little higher and retested the former high. There may be too much resistance at this level for it to overcome, at least right away. That would suggest another retracement, perhaps to the green trend line first; and then we’ll see how much support it derives from its green 30-dma.
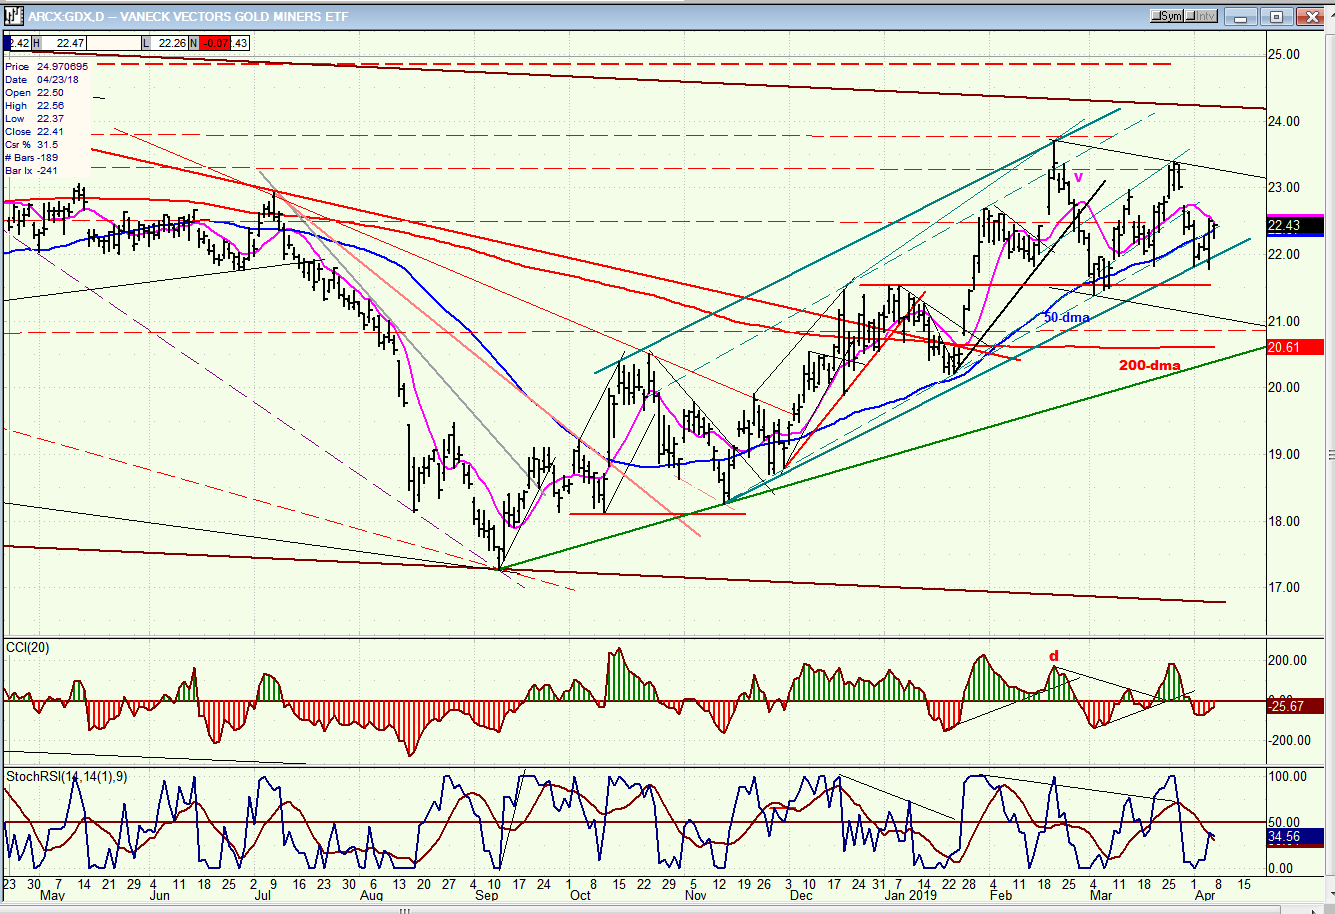
GDX (Gold miners ETF) (daily)
GDX found support on its channel line and had a good bounce up to the juncture of the two moving averages. It will have to push past them in order to get back into an uptrend. This will be the first hurdle to overcome. If successful, as long as price remains above the channel line higher prices can be expected.
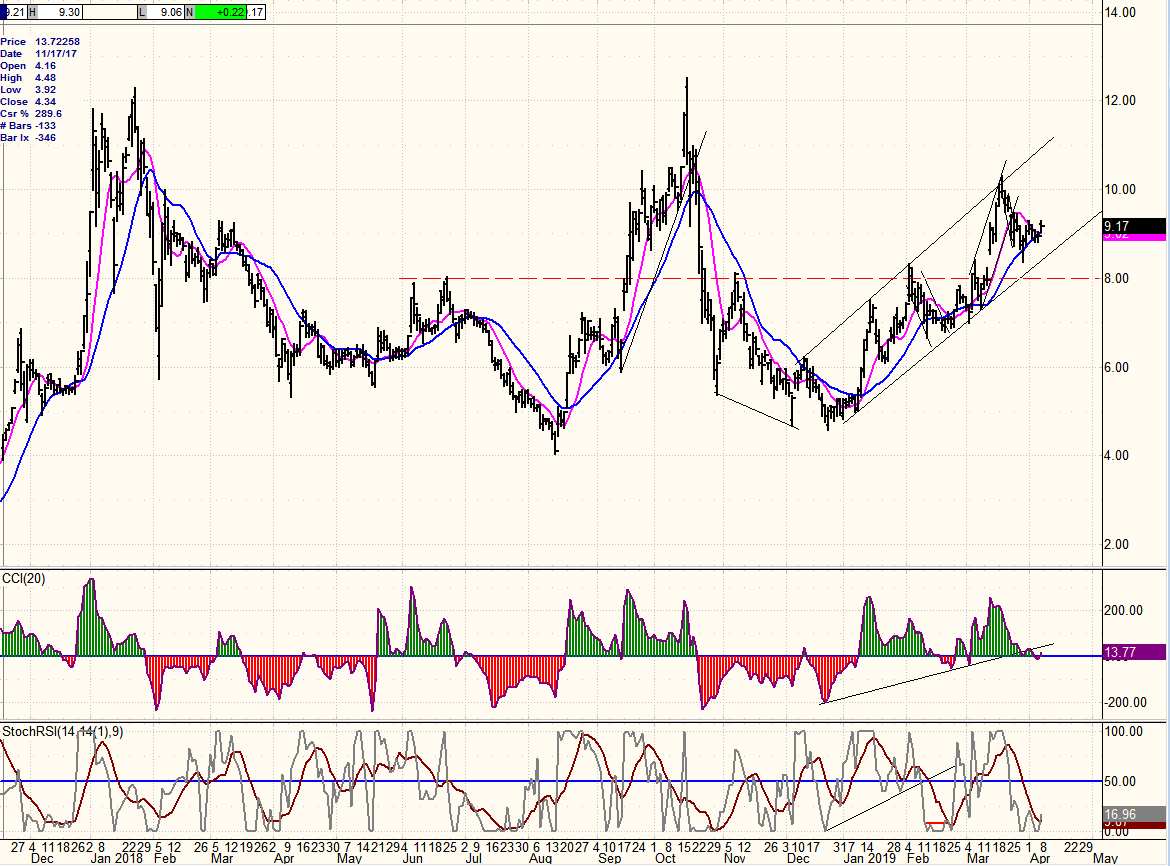
ACB (Aurora Cannabis) (daily)
ACB continues to consolidate inside its bullish channel and may be ready to challenge its recent high.
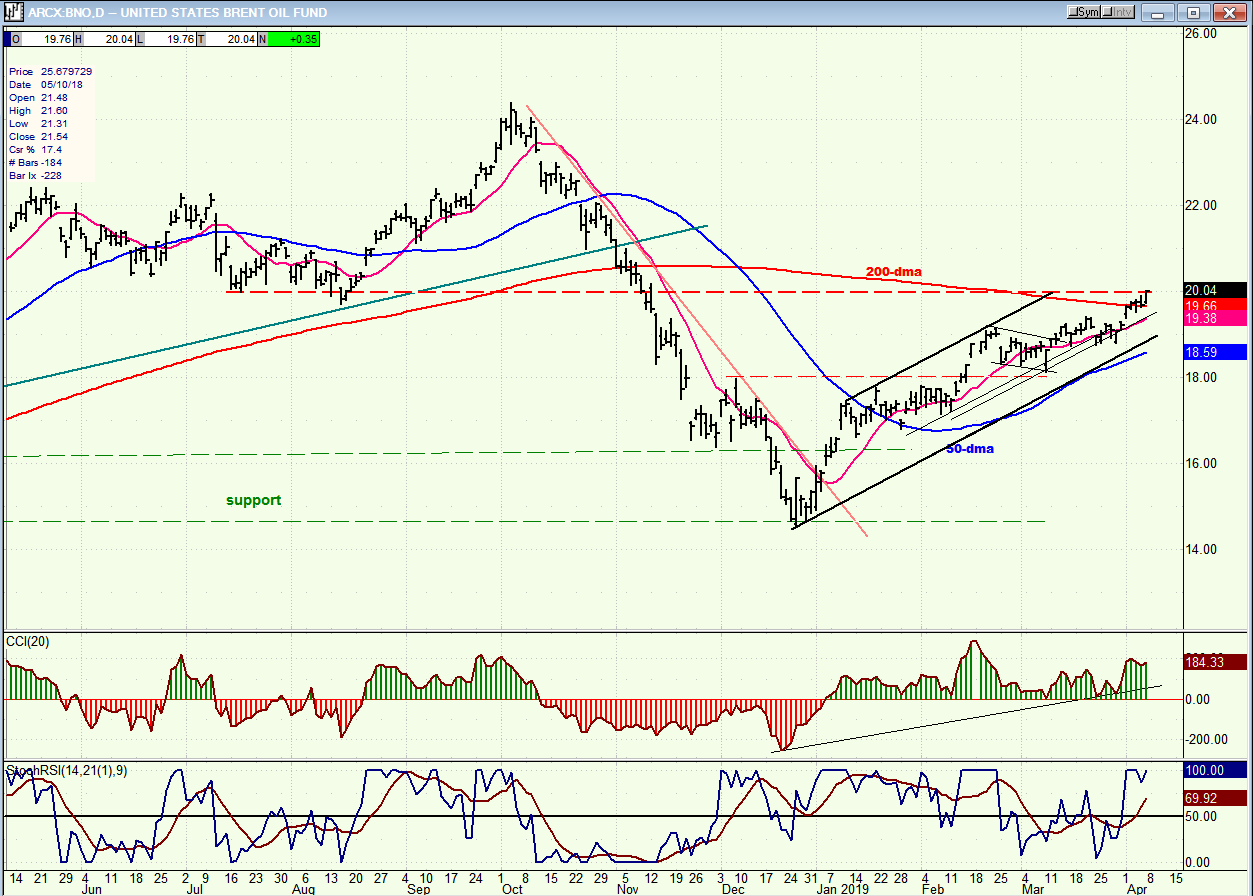
BNO (United States Brent Oil Fund) (daily)
BNO has reached the upper resistance area but closed well on Friday and does not look quite finished, unless it gets pushed back below the 200-dma right away.
Summary
With the count from the last, small re-accumulation pattern essentially filled, we should see a near-term reversal. A wedge pattern is taking shape which could become an ending diagonal. More confirmation is needed.
FREE TRIAL SUBSCRIPTON
With a trial subscription, you will have access to the same information that is given to paid subscribers, but for a limited time period. I think you will find that knowing how far a move can carry is one of the most useful benefits of this service, whether you are a trader or an investor -- especially when this price target is confirmed by reliable indicators which give advance warning of a market top or bottom. Furthermore, cycle analysis adds the all- important time element to the above price projections.
For a FREE 4-week trial, further subscription options, payment plans, and for general information, I encourage you to visit my website at www.marketurningpoints.com.
The above comments about the financial markets are based purely on what I consider to be sound technical analysis principles. They represent my own opinion and are not meant to be construed as trading or investment advice, but are offered as an analytical point of view which might be of interest to those who follow stock market cycles and technical analysis.

When Andre Gratian was a stock broker years ago, a friend introduced him to technical analysis of the market. Consequently, it is not an exaggeration to say that Andre fell in love with this approach! Ever since then, it has become an increasingly important part of his professional life. Gratian has studied the works of Wyckoff, Edwards & Magee, Edward J. Dewey (cycles) and many others. However, one of my most profitable undertaking has probably been to study Point & Figure charting, which he finds invaluable in analyzing stocks and indices. If he were restricted to one methodology, this is the one that he would choose. This well-rounded background has given him what he feels to be a special insight into the stock market, facilitating the recognition of meaningful patterns and the ‘turning points’ in all trends, whether they be short or long term. Andre feels very comfortable discussing the stock market and passing on meaningful information to others. His subscribers include individuals and money managers throughout the world. Moreover, his Newsletters are currently published on several financial sites, here and abroad.


