Technical Analysis Of The Markets


SPX: Long-term trend: Severe correction underway.
SPX: Intermediate trend – Phase correction in process.
Analysis of the short-term trend is done on a daily basis with the help of hourly charts. It is an important adjunct to the analysis of daily and weekly charts which discuss longer market trends.
PHASE CORRECTION IN PROGRESS
Market Overview
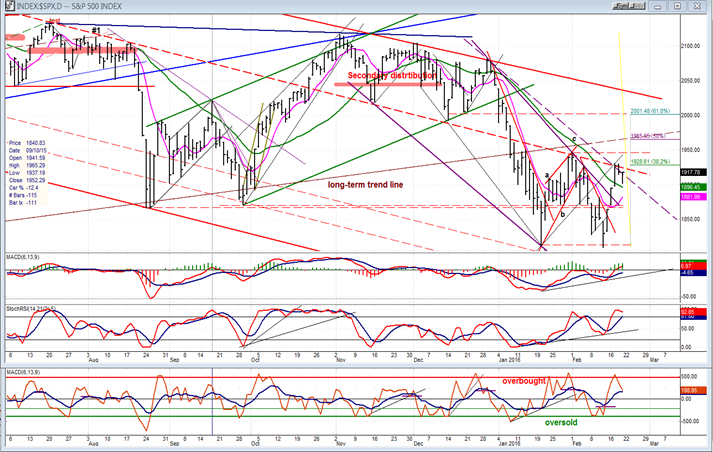
On 2/11, SPX re-tested its 1/20 low of 1812 which essentially held, thereby completing a phase downtrend from the 2116 top. The rally that developed was enhanced by bullish news about oil and, assisted by massive short-covering, it spurted 120 points in only four days’ time. That brought it to a .382 retracement of the decline from 2116 where it stopped on a dime. This was followed by a two day, 27-point profit-taking pull-back which started a distribution formation that does not appear to be complete since a small pattern of consolidation has since formed, suggesting that the index could re-test its high on Monday, or move a little higher.
The most likely structural formation in process is that of a corrective a-b-c pattern. If we do move to a new high on Monday, it will create a small “c” wave from the low. That would raise the question of whether the counter-trend rally will be content with slightly more than .382 retracement or, will it want to extend higher after a larger pull-back? Obviously, this is something that we cannot answer for at least another 3 or 4 days of market activity, but betting that this is the end of the correction would be rather risky at this time. What we need to observe is whether the next congestion level will turn out to be accumulation or distribution and how much weakness is incurred in the pull-back.
We’ll also need to watch the performance of some of the leading indicators such as TRAN, IWM, XBD and QQQ. The collective action of these, along with that of the SPX, could reveal a great deal.
Also relevant is the probability that this time period is a cycle high and that some downside pressure should ensue. We’ll discuss other things to watch for as we analyze the charts.
SPX Chart Analysis
Daily Chart (This chart, and others below, are courtesy of QCharts.com.)
Last week’s rally from the 1810 low was pretty much a replica in size of the one from the second August low except that the latter only took 2 days to complete. But this is where the analogy stops. The difference was that the August rally was a reflex move from a quick and very severe decline which had caused a massive oversold condition. Last week was not the case, so we cannot expect that what follows will be similar. The main question is whether or not there will be some follow through to the current one, or will this be enough of a correction for the 300-point decline from 2116?
The move had good reasons to stop where it did. Resistance was provided by the dashed trend line (a parallel to the primary downtrend line at the top) which already had a proven record of stopping rallies and declines along its path. In addition, this price level coincided with the purple dashed line which is the outer channel line of the downtrend phase from 2116. If the index cannot get out of that channel but continues to decline from here, it could be in a position to break below the 1812 level and reach the lower projections that are already in place and which it failed to reach on the last decline. Other reasons for the rally to stop where it did were provided by having reached the .382 retracement from the 2116 top and having filled all the available count which had been created by the accumulation pattern below 1835.
That the correction is already ending is only a remote possibility at this point, especially since most moves occur in at least three phases and, so far, we only have two. But if there is a push higher on Monday, it could give us a small “c” wave and would satisfy that basic requirement, and make the completion of the entire upward correction a possibility. However this plays out – and we’ll know much more after next week – and whether the total corrective rally is .382, .50, or .618 of the decline from 2116, it will remain a corrective rally in a “bear market” which has the potential of reaching much lower prices before it ends.
The indicators suggest that there is a potential for a move higher, but their position after a pull-back will be far more revealing.

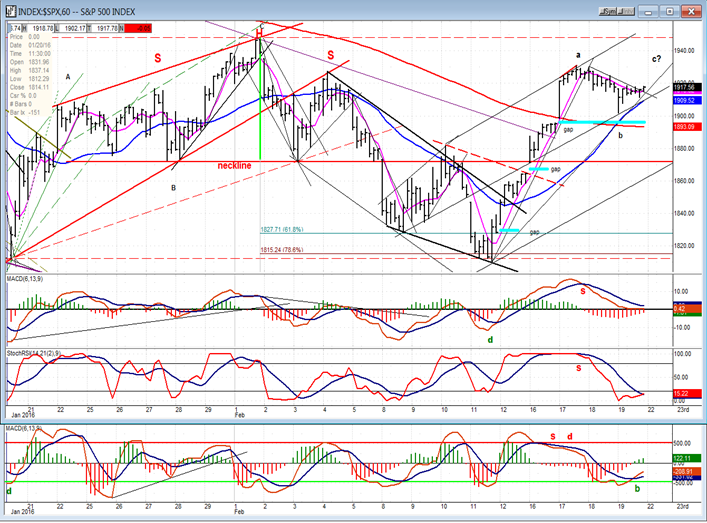
Hourly Chart
I have drawn the channel in which the hourly index is currently proceeding. Friday’s correction found support on the mid-channel line but did not have too much of a rebound, which makes any Monday morning strength questionable. Nor was it able to reach 1919 for a potential break out; but the indicators, which we will discuss later, suggest that a move a little higher to form an a-b-c pattern is possible. If we do make an a-b-c pattern, will it complete the entire corrective rally, or only one phase of it? If it is followed by another minor a-b-c pattern to the downside, it could be in process of making an irregular which would complete with a 5-wave move to the upside. As it currently stands, it is conceivable that (after another push higher) we could pull back to the neck-line (approximately a 33% retracement of the rally) before finding support. Should we break below decisively, however, it would increase the possibility that the upward correction is over. Lots to watch in the next few days!
The indicators are suggesting that another wave up starting Monday is a good possibility. Note how the pull-back started when the trend line and the pink MA were broken and, at the same time, the momentum oscillators made a bearish cross. Now, the minor downtrend line has been broken, the MA slightly surpassed, and the A/D oscillator has already given a buy signal. The momentum oscillators are very close to doing the same. This makes a positive opening on Monday a good bet. Of course, a lot can happen over the week-end, and the refusal to move lower may have been a function of the options expiration which occurred on Friday. We’ll have to wait and see!
TRAN (Dow Jones Transportation Average)
As I pointed out last week, just as the TRAN gave us a clear advance warning that a significant decline was about to take place after the market topped at 2135, it also gave us warning that a rally was about to occur in the SPX when it started to move up about a month ago. Although there are others which are also useful for this purpose (IWM, XBD, SMH), this has to be the early bird index par excellence!
TRAN’s relative strength to the SPX has now gone from strong to neutral and, providing that it retains its forecasting ability, we need to wait for negative divergence to show in this index before we can discuss the probability of an intermediate decline resumption. It may also resolve our dilemma about the kind of phase correction we are making. If we are truly at a cycle top, this could show up as early as Monday or Tuesday.
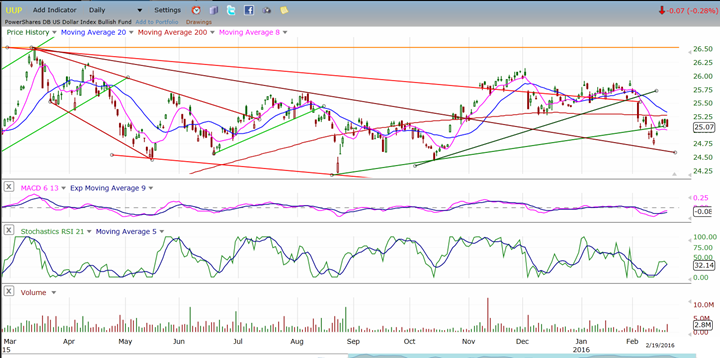
UUP (Dollar ETF)
UUP had a good bounce off the extension of a former downtrend line and has even rebounded above its bullish trend line. Is this sustainable, and can it finally attempt to resume its longer-term uptrend? We’ll just have to wait and see. If it can get back above the 200-DMA, the possibility will increase.
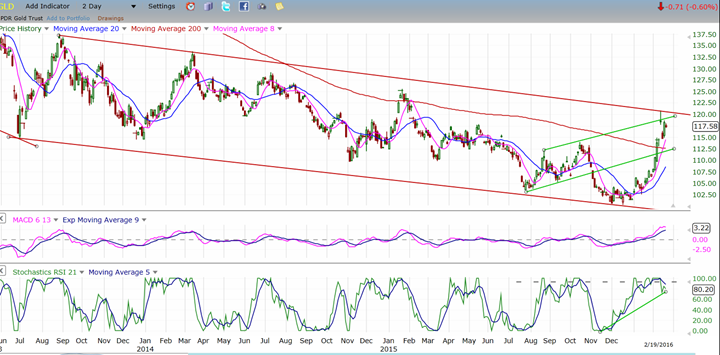
GLD (Gold Trust)
It’s probably a little too soon to say, but GLD may have exhausted its near-term potential on the upside. It has run into some significant resistance by reaching two upper channel lines, one of which is over one-year long. If it forms a congestion level in this area and falls below it instead of going above, this will mean that more consolidation is needed and, considering the cyclical structure, this could set it back from developing an uptrend by several more weeks. If it cannot hold 114 on another pull-back, it would be a negative.
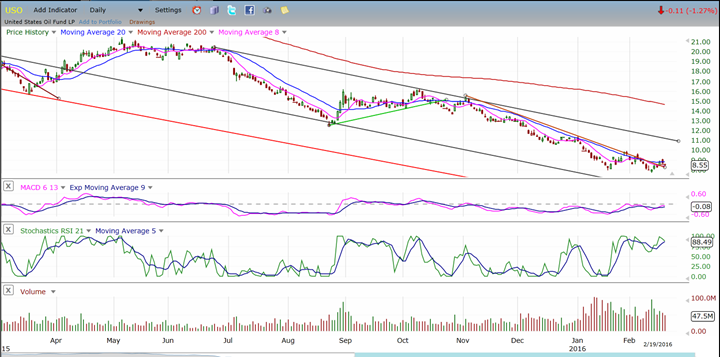
USO (US Oil Trust)
I believe that USO has made an important low at the projected 8 level but, to repeat myself, I would not expect it to do better than establish a trading range while creating a base which will eventually (emphasis) enable it to climb out of the cellar. This could take quite a while and, as this base formation appears more and more likely, its influence on the market will be diminished.
Summary
SPX is correcting the decline from 2116 -- and has already fulfilled the minimum expectation by retracing a third of that downtrend. At this time, I would not bet that this is all we get, but it could be if it cannot get past 1947 before significant weakness re-appears. The next week could go a long way towards telling us its decision.
********
FREE TRIAL SUBSCRIPTON
Market Turning Points is an uncommonly dependable, reasonably priced service providing intra-day market updates, a daily Market Summary, and detailed weekend reports. It is ideally suited to traders, but it can also be valuable to investors since highly accurate longer-term price projections are provided using Point & Figure analysis and Fibonacci projections. Best-time reversal estimates are obtained from cycle analysis.
For a FREE 4-week trial, send an email to: [email protected]
For further subscription options, payment plans, weekly newsletters, and for general information, I encourage you to visit my website at www.marketurningpoints.com. By clicking on "Free Newsletter" you can get a preview of the latest newsletter which is normally posted on Sunday afternoon (unless it happens to be a 3-day weekend in which case it could be posted on Monday).
The above comments and those made in the daily updates and the Market Summary about the financial markets are based purely on what I consider to be sound technical analysis principles. They represent my own opinion and are not meant to be construed as trading or investment advice, but are offered as an analytical point f view which might be of interest to those who follow stock market cycles and technical analysis.

When Andre Gratian was a stock broker years ago, a friend introduced him to technical analysis of the market. Consequently, it is not an exaggeration to say that Andre fell in love with this approach! Ever since then, it has become an increasingly important part of his professional life. Gratian has studied the works of Wyckoff, Edwards & Magee, Edward J. Dewey (cycles) and many others. However, one of my most profitable undertaking has probably been to study Point & Figure charting, which he finds invaluable in analyzing stocks and indices. If he were restricted to one methodology, this is the one that he would choose. This well-rounded background has given him what he feels to be a special insight into the stock market, facilitating the recognition of meaningful patterns and the ‘turning points’ in all trends, whether they be short or long term. Andre feels very comfortable discussing the stock market and passing on meaningful information to others. His subscribers include individuals and money managers throughout the world. Moreover, his Newsletters are currently published on several financial sites, here and abroad.


