Technical Analysis Of The Markets


Current Position of the Market
SPX: Long-term trend – Final long-term phase on the way? How much longer, is the question.
Intermediate trend –The anticipated intermediate-term correction has started. Can’t tell yet if it’s a C-wave or something less.
Analysis of the short-term trend is done on a daily basis with the help of hourly charts. It is an important adjunct to the analysis of daily and weekly charts which discusses the course of longer market trends.
Rally Over – Downtrend Resumes
Is Gold Ready to Stir?
Market Overview
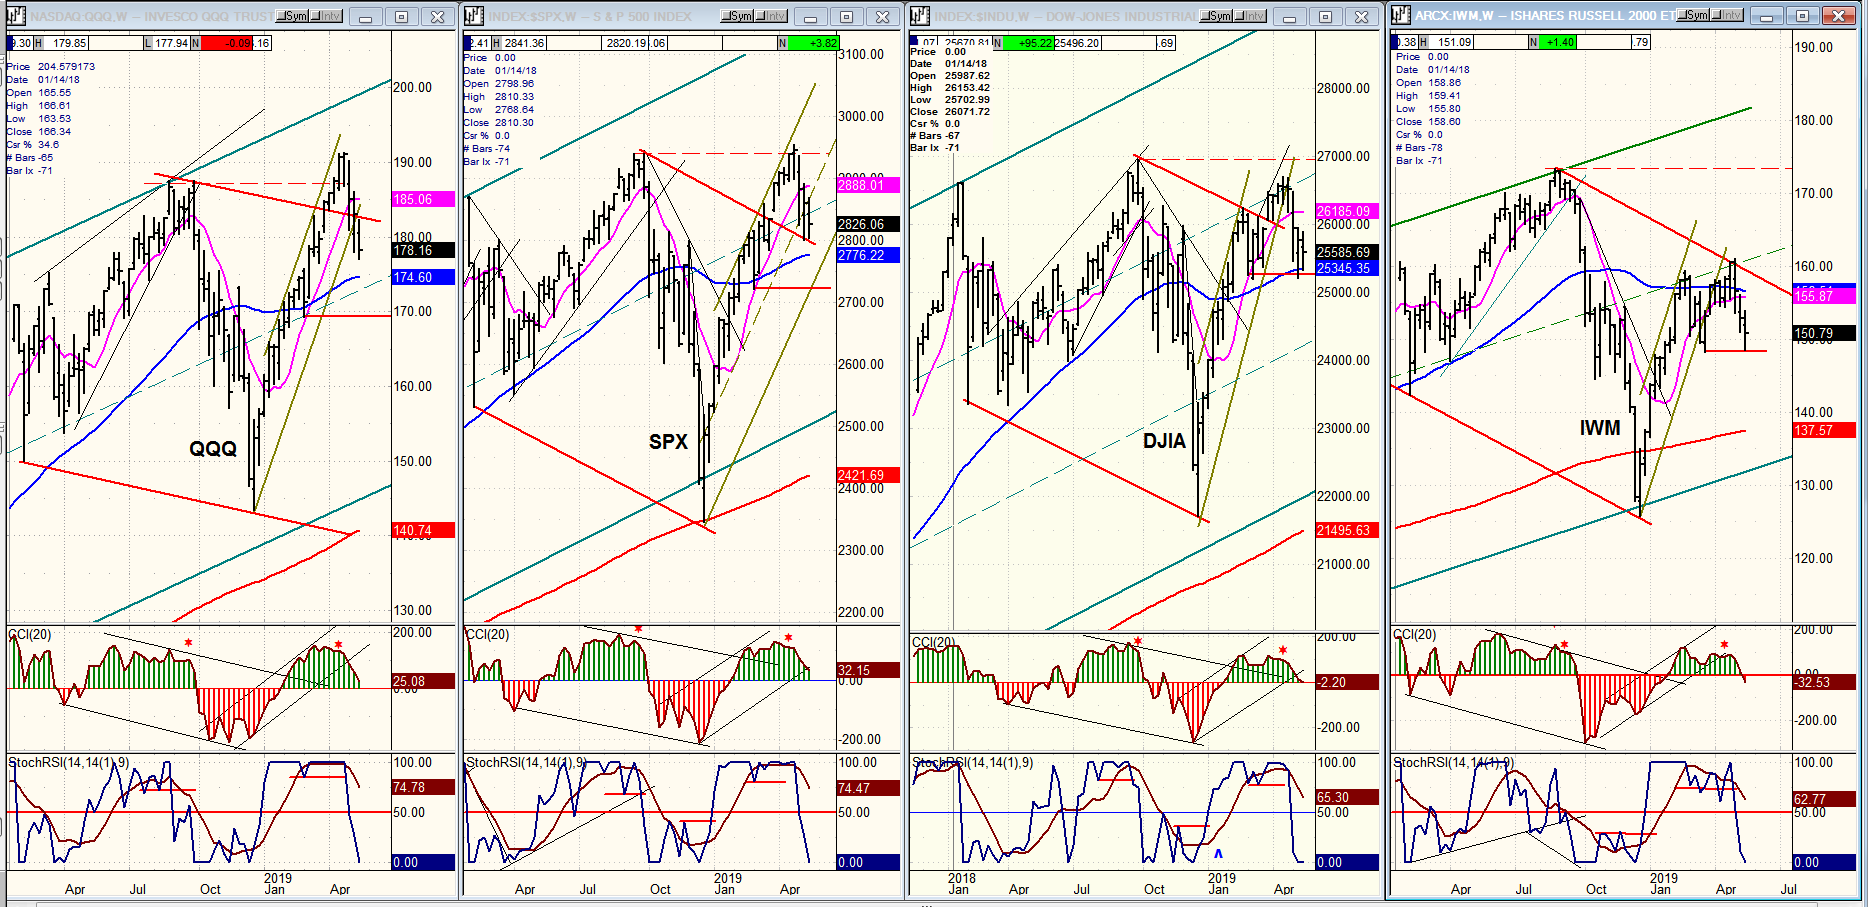
There is a strong probability that the counter-trend rally which started at 2346 on 12/26/18 came to an end at 2954 on 5/01/19. I say “probable” because the weekly indicators, which are the best gauge of intermediate market trends, have only given an initial, unconfirmed sell signal. There are many ways to determine if an index has reversed its intermediate trend, and one of the simplest ways to do this is by looking to see if, on a weekly basis, the index price has closed below its 50-wk MA (or below its 200-dma).
In either case, QQQ and SPX are still above both; DJIA is currently testing both; and IWM is trading well below both! Until all four indexes are trading below their MAs, we have to withhold judgment, although there are two conditions which strongly suggest that it’s only a matter of time before all four indexes have given a confirmed sell. The first is that the cycles which are the cause of the current market decline are not supposed to make their lows until August-September. The other has to do with the fact that IWM continues to lead the market on the downside with not even a remote sign that this is about to change.
If that this confirmation does take place in the next week or two, it would give more credibility to the view that the current decline is the C-wave of a large wave-4 corrective pattern within the bull market which started on 3/09, and which will not come to an end until the December low has been re-tested. Should this be the case, terminal wave 5 of the bull market will then take prices to a new all-time high (final price projection to be determined after the current downtrend has ended).
My views about the current market condition is in sync with that of Erik Hadik, a cycle analyst worth following. He warned that intermediate cycles similar to those which caused the September-December decline were again topping in May and could cause another similar decline going into August-September. So far, at least, his prediction is being fulfilled.
You may also want to read the following excerpt of a newsletter which employs the EWT as a methodology. Arnout is an excellent EWT technician and, as you can see, he is also of the same opinion regarding the market.
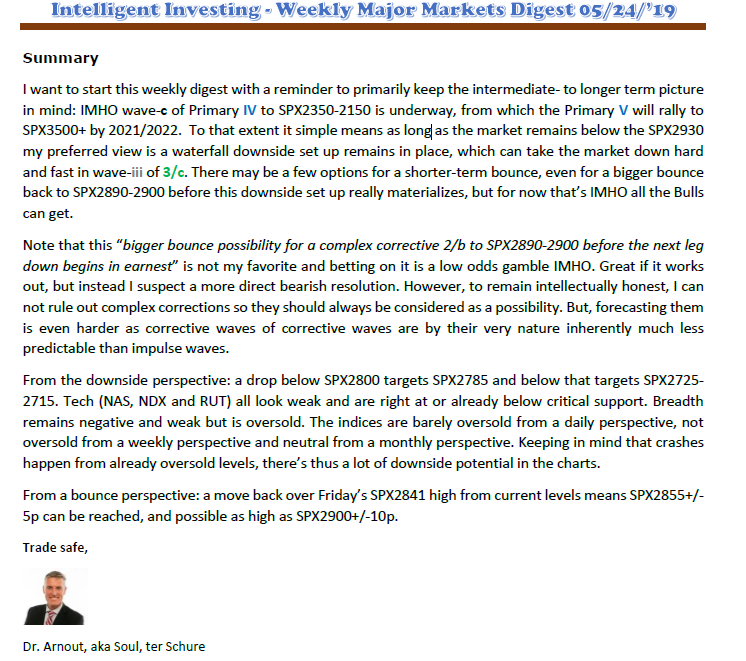
Chart Analysis (The charts that are shown below are courtesy of QCharts)
SPX daily chart
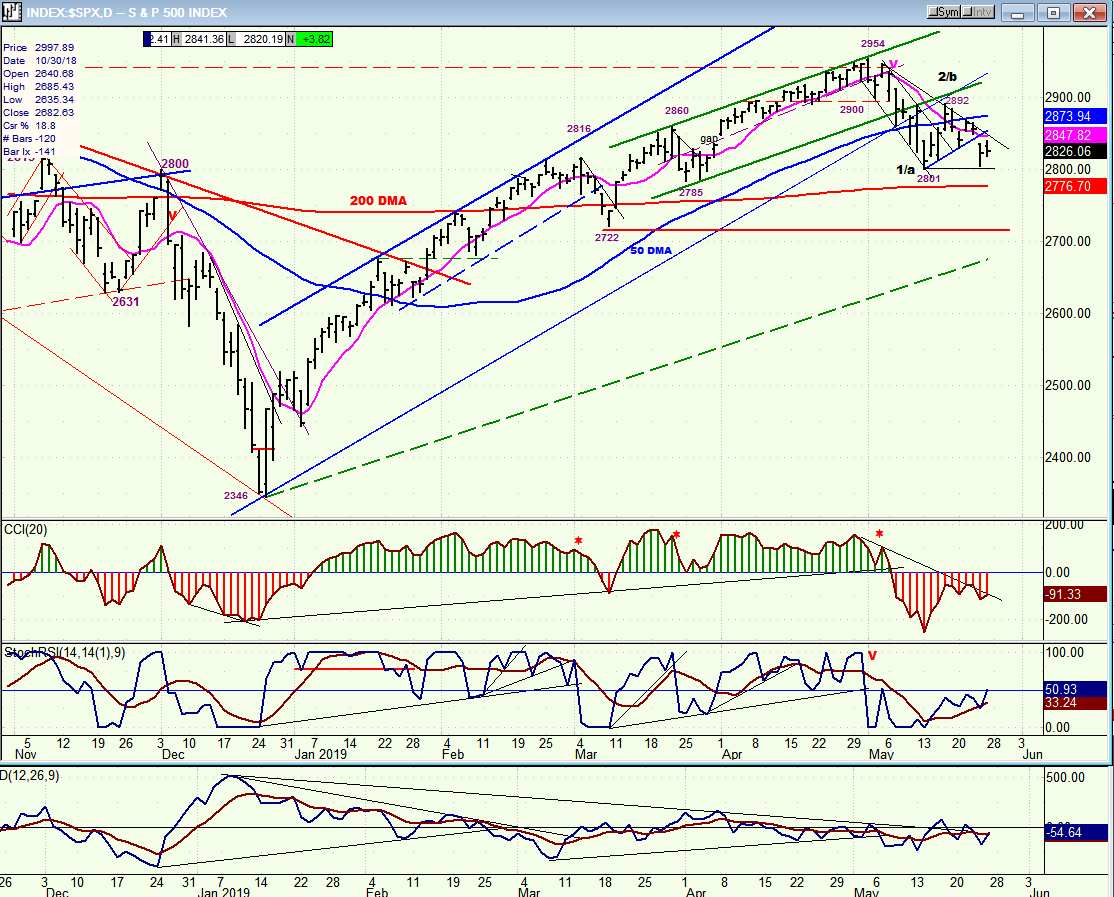
Posting the daily chart of the entire rally since the December low does not give much definition to what has taken place since the 2954 top, but we will see this in more detail next, on the hourly chart. Showing the entire uptrend does allow us to see that it took place in two phases, and that, after the second phase (green channel) was complete, the index came out of both the smaller and the larger channels. After making a short-term low at 2801, SPX rallied to 2892 and started to decline again, re-testing the previous low of 2801 last Thursday before bouncing back into Friday.
The first confirmation that we have started another important decline will come when the index breaks below 2801. There are minor cycles suggesting that this could take place as early as Tuesday. This would then be followed by some additional consolidation of a few days. On this chart, you can see that the 200-dma is currently at 2776.70. It would be nice if this level were tested after we break below 2801-- and this is certainly a possibility since there is a P&F phase count to about that level.
If the market has another spell of weakness into next week, bringing all four indexes to new short-term lows for the current decline, it would certainly cause the DJIA to trade below its 200-dma, making it the second of our four indexes to give a confirmed intermediate sell signal. (It would have to close the week below 25,345 to also close below its 50-wk MA.)
SPX hourly chart
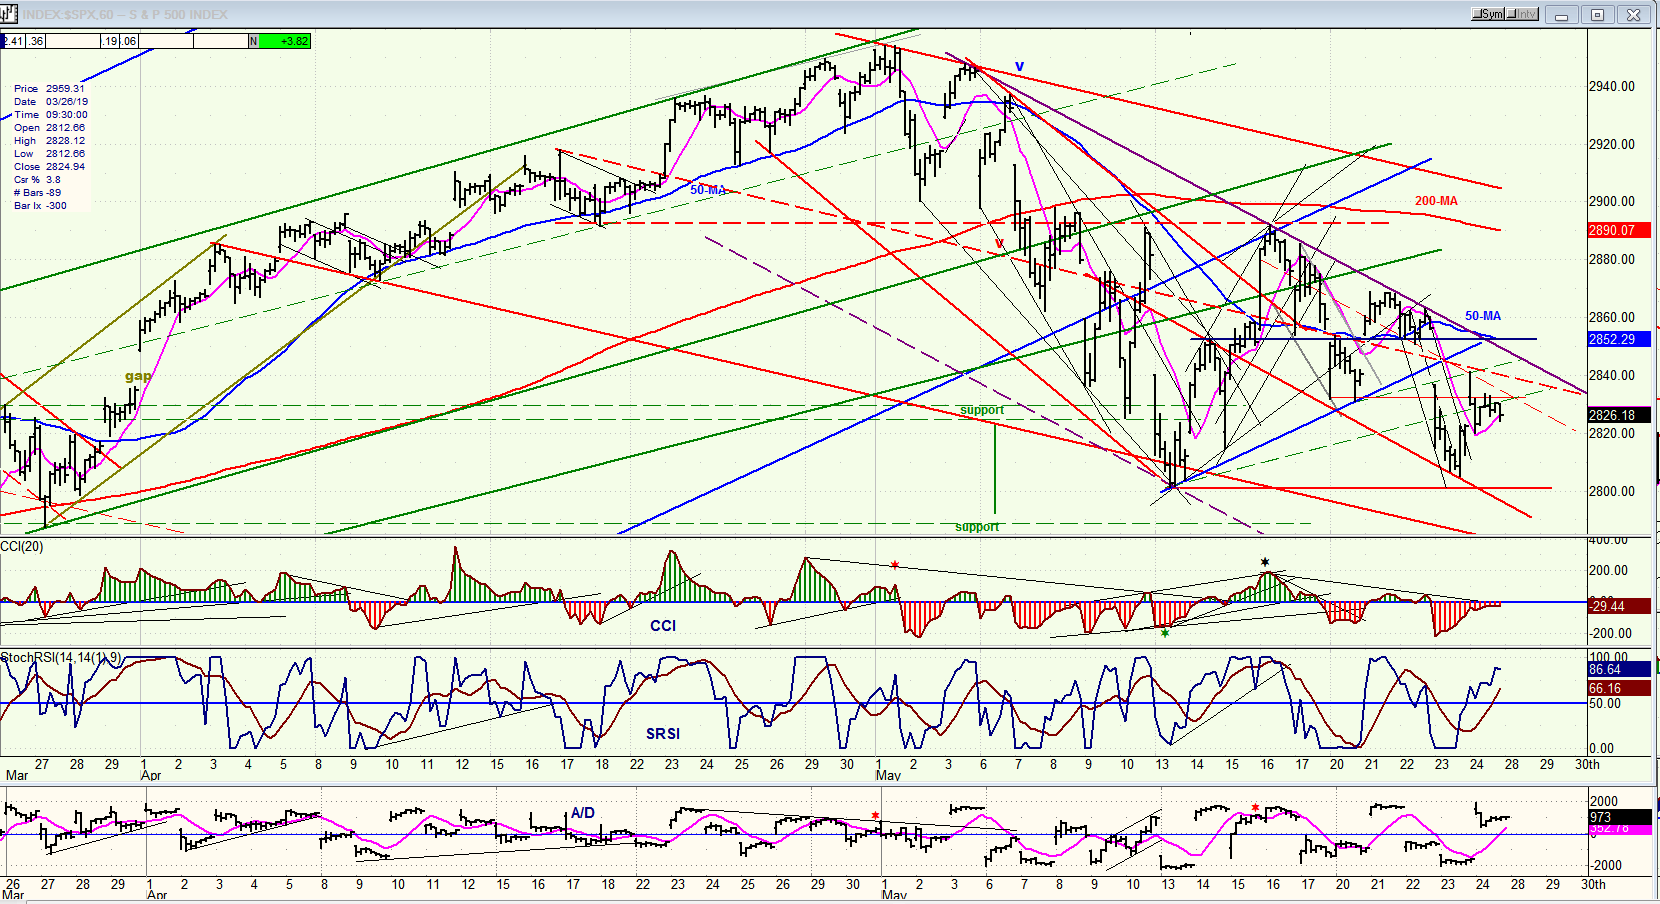
On this chart, we can see more clearly how the top was made at 2954. After an initial wave of selling, there was a re-test of the high and prices settled in a short-term downtrend which ended at 2801. That ended wave 1/a and we reversed, retracing .618 of the initial decline in what could be wave 2/b before reversing again and declining to re-test the recent short-term low of 2801. The test was successful, only reaching 2805 before starting a bounce on Thursday with a follow-through on Friday. This last reversal was not enough to initiate a buy signal at the 60m time frame, but it would not take much more buying to do so. If we do move higher early next week, there are several trend lines of resistance which could stop the minor uptrend before it turns into something more forceful to the downside.
Whether or not this will be the next near-term trend direction will depend on what happens as early as Tuesday when a short-term cycle is ideally scheduled to make its low. If the pull-back cannot extend beyond 2801, it will bring about several other short-term options which I won’t go into. Suffice it to say that the 2801 low must be surpassed if we are to fill the next count down to 2775. If this does not take place next week, extending the decline could be delayed by a few more days.
QQQ, SPX, DJIA, IWM (weekly)
The RS rankings remain the same as last week. But with QQQ being sold more aggressively, it and SPX are now competing for second place.
More importantly, only IWM could be said to have given a confirmed sell signal at the intermediate level. DJIA is on the verge of doing the same; and the other two will have to join in to ensure the theory that this decline is a large C-wave is being validated.
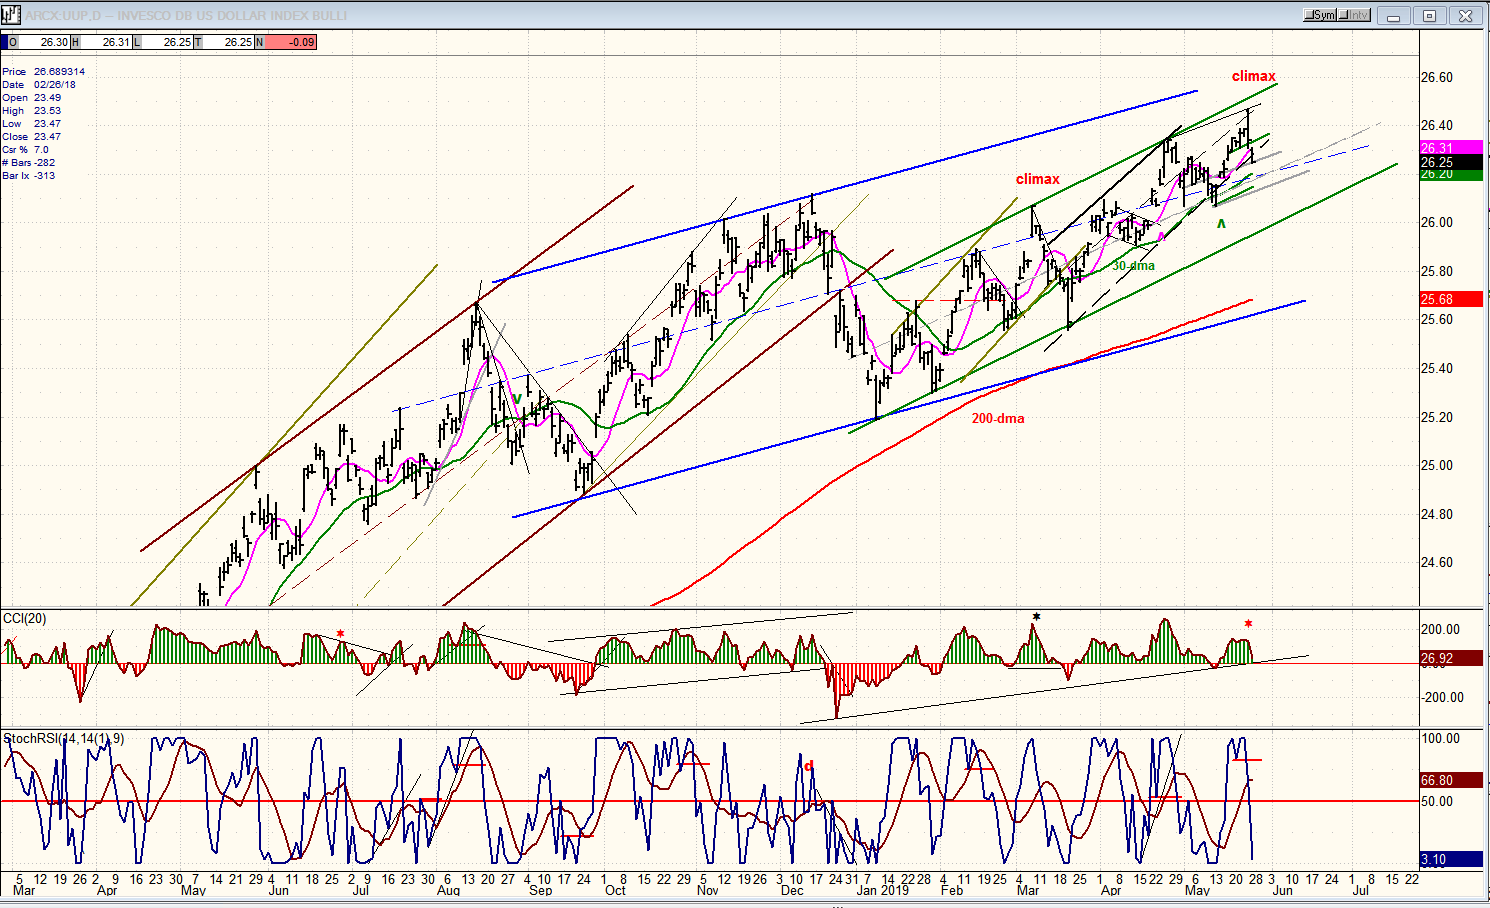
UUP (Dollar ETF) daily
UUP (dollar ETF)
On Thursday, UUP looks as if it made a short-term buying climax pattern similar to the one it made six weeks earlier, and which resulted in a full retracement of the green channel -- from top to bottom. If the same thing happens this time, we could expect a short-term decline down to 26.00 and possibly lower since this time, the move is preceded by negative divergence showing in the CCI. Could it mean that UUP is finally indicating an intermediate trend reversal in the U.S. dollar? Perhaps this time the index is even ready to retrace the full width of the blue channel, as it did from December to January. This could be important for gold since it could finally lift the lid that had been imposed on its price by dollar strength.
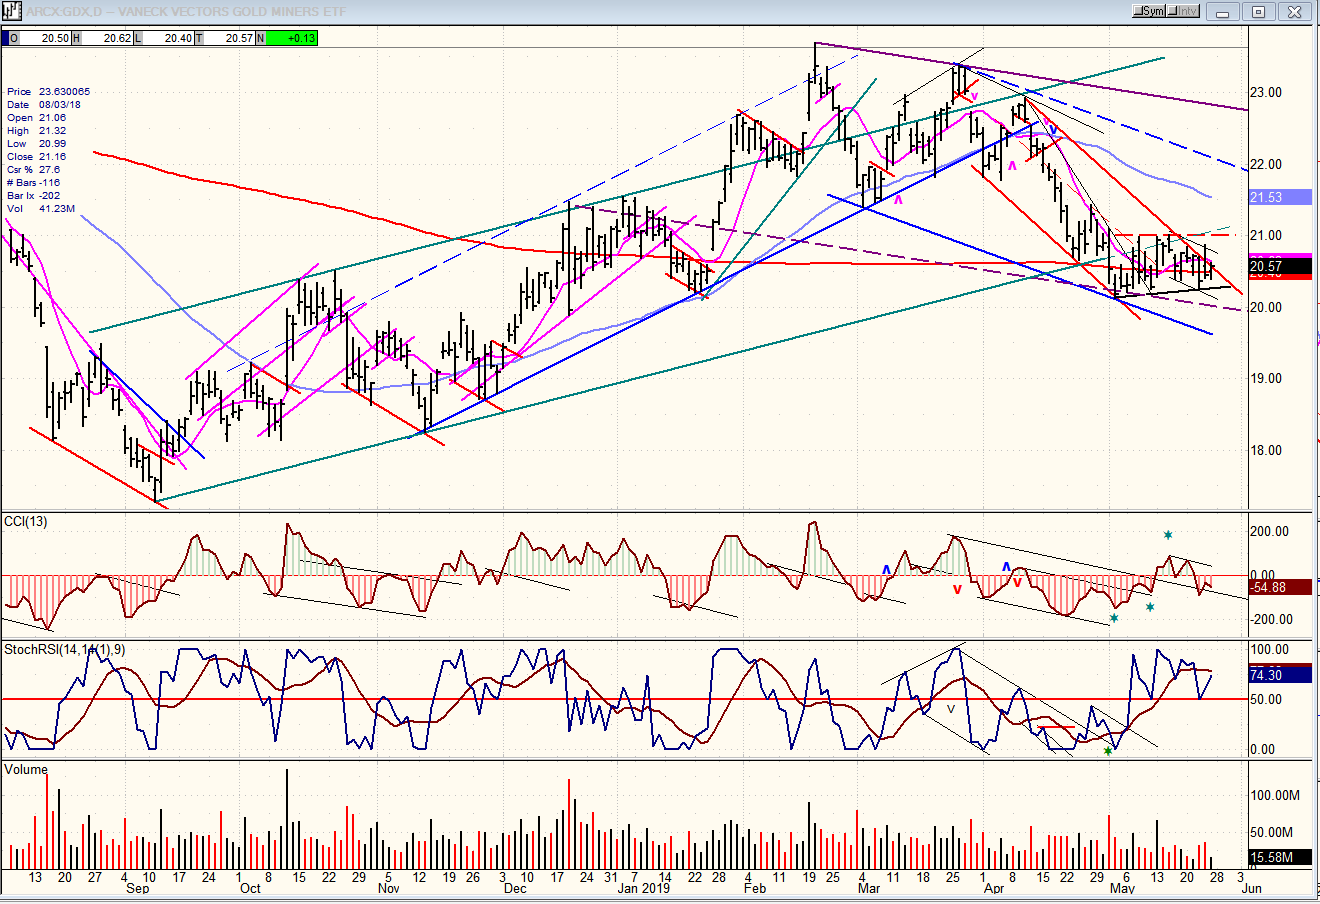
GDX (Gold miners ETF) weekly
Does the price action in UUP suggest that gold is getting ready to move higher? Let’s look at GDX! Recently, I posted a weekly chart which showed that the index had been moving laterally in a long consolidation pattern for about eighteen months. In September of last year, it moved from the low to the top of that range, but could not attract enough buying to push out of it because UUP was making new highs. This was followed by a pull-back to the middle of that range where it has been stuck for three weeks, showing that there was not enough selling to push it lower -- possibly because of the support being provided by the 200-dma. Has it been waiting for UUP to make its final high?
Note that the declining pattern from the recent high of 23.70 to the low 20.27 can be divided into three separate channels. In the past three weeks, GDX has moved all the way across the steepest of the three (the red channel). On Thursday, it attempted a break-out which did not succeed, and fell back on Friday. However, the 5m chart shows that Thursday’s move started with a gap opening and proceeded to make a clear five-wave pattern. Considering the action of UUP and what it could foretell, Thursday’s move in GDX could be wave 1 of a break-out wave, which was followed by a wave 2 retracement which tried, but did not quite succeed in completely filling the opening gap of wave 1. Tuesday could be an interesting day for GDX – if the reasoning behind this technical evaluation proves to be correct!
One more point! In the oscillators, SRSI has already gone positive, and has been waiting for CCI to join it decisively.
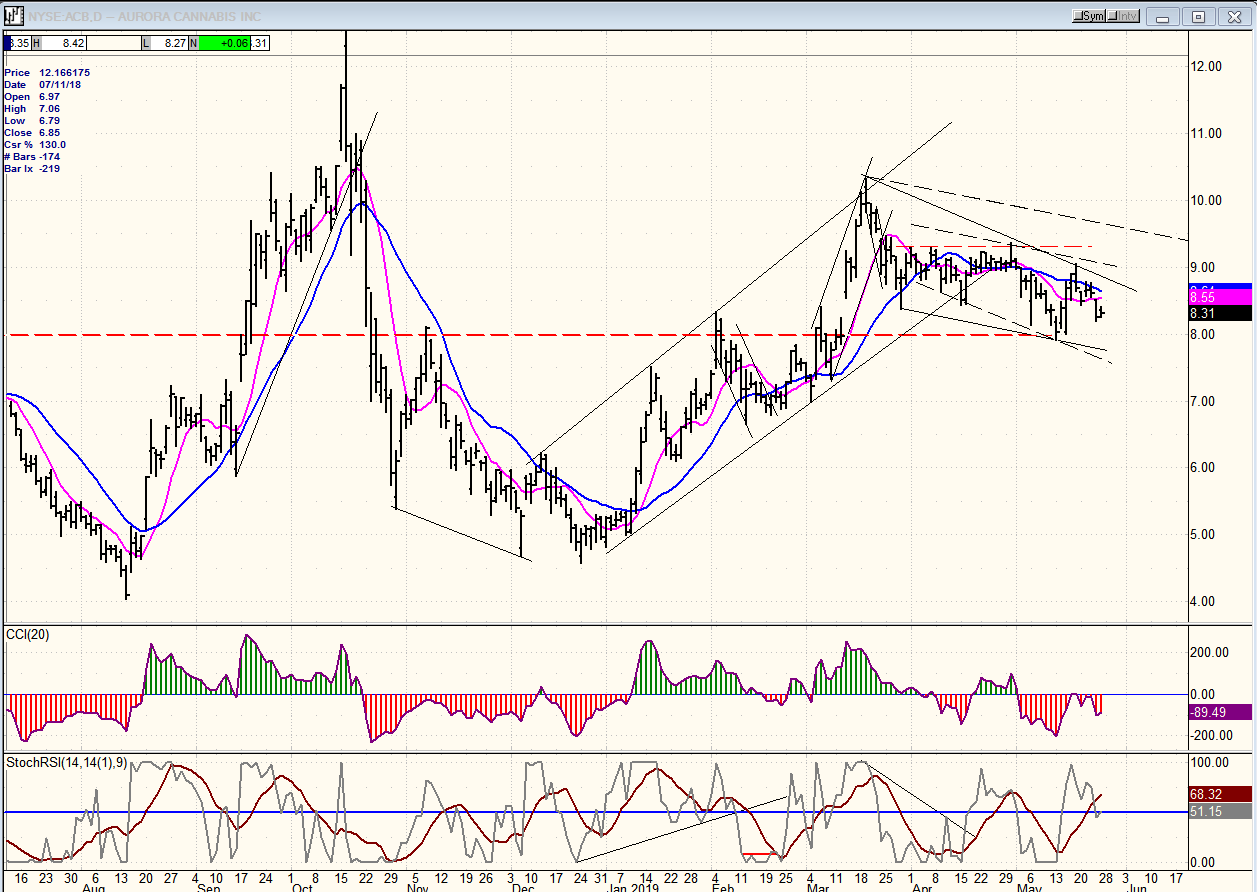
ACB (Aurora Cannabis) daily
ACB has extended its consolidation, and will probably continue until there is strength in the market itself; or until internal developments within the company attracts buyers.
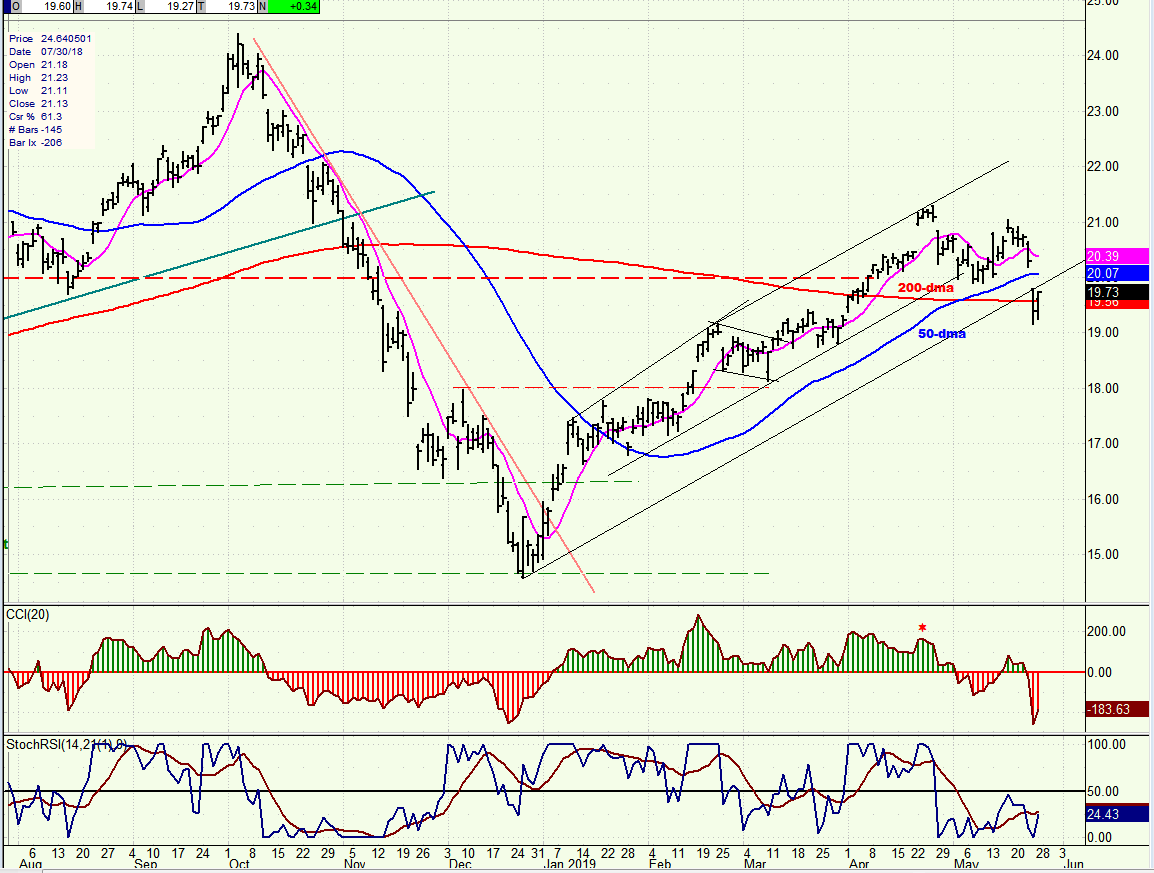
BNO (U.S. Brent oil fund) daily
BNO, assisted by developing weakness in the market, is beginning to extend its correction. It has gapped through its 50-dma and is trying to hang on to the 200-dma. It is now at a critical juncture where it could try to hold current support and, if not, begin a full-blown correction.
Summary
SPX is at a decision point! It can use its successful re-test of the 2801 low to attempt getting back into an uptrend, or it could show that selling pressure is increasing by making a new correction low right away. Next week will decide.
FREE TRIAL SUBSCRIPTON
With a trial subscription, you will have access to the same information that is given to paid subscribers, but for a limited time period. I think you will find that knowing how far a move can carry is one of the most useful benefits of this service, whether you are a trader or an investor -- especially when this price target is confirmed by reliable indicators which give advance warning of a market top or bottom. Furthermore, cycle analysis adds the all- important time element to the above price projections. For a FREE 4-week trial, further subscription options, payment plans, and for general information, I encourage you to visit my website at www.marketurningpoints.com.
The above comments about the financial markets are based purely on what I consider to be sound technical analysis principles. They represent my own opinion and are not meant to be construed as trading or investment advice, but are offered as an analytical point of view which might be of interest to those who follow stock market cycles and technical analysis.
*********

When Andre Gratian was a stock broker years ago, a friend introduced him to technical analysis of the market. Consequently, it is not an exaggeration to say that Andre fell in love with this approach! Ever since then, it has become an increasingly important part of his professional life. Gratian has studied the works of Wyckoff, Edwards & Magee, Edward J. Dewey (cycles) and many others. However, one of my most profitable undertaking has probably been to study Point & Figure charting, which he finds invaluable in analyzing stocks and indices. If he were restricted to one methodology, this is the one that he would choose. This well-rounded background has given him what he feels to be a special insight into the stock market, facilitating the recognition of meaningful patterns and the ‘turning points’ in all trends, whether they be short or long term. Andre feels very comfortable discussing the stock market and passing on meaningful information to others. His subscribers include individuals and money managers throughout the world. Moreover, his Newsletters are currently published on several financial sites, here and abroad.
More from Gold-Eagle


