Technical Analysis Of The Markets


Current Position of the Market
SPX: Long-term trend – Final long-term phase on the way? How much longer, is the question.
Intermediate trend – We have started a correction of intermediate nature.
Analysis of the short-term trend is done on a daily basis with the help of hourly charts. It is an important adjunct to the analysis of daily and weekly charts which discusses the course of longer market trends.
A Holding Pattern
Market Overview
In my last letter I mentioned that I expected the market to turn down before it had another 100-point rally because the 40-week cycle, which is in its final phase, will start to put pressure on prices. However, as of Friday, the SPX rose 105 points before pulling back. My expectation turned out to be incorrect! Could the 40-week cycle have already made its low? And then, I came across this headline on Google News: “It looks like Trump lied about the trade war to boost stock markets”. “On Monday, Trump told reporters that he held "high-level talks" with China about the trade war, adding "this is the first time I've seen them where they really want to make a deal. "Global stocks instantly reversed what looked to be another day of heavy losses, following the Dow's 600 point drop on the previous Friday. His comments soothed anxious investors. But China said that those talks never actually happened. And CNN reported that: "Instead, two officials said Trump was eager to project optimism that might boost markets and conflated comments from China's vice premier with direct communication from the Chinese." Algorithms do not discriminate between real and fake news; they just react! So, it’s very possible that the 40-week cycle low that I had anticipated between the middle and the end of September is still ahead of us. We should find out on Monday in the way futures react to this news, which appeared today.
From a technical perspective, it looks as if prices have been arrested at the bottom of the channel which extends from 2346, perhaps forming a triangle in the process. As a result of this four-week congestion pattern, indicators have become mixed, as is often the case when the market goes sideways, and we’ll just have to wait until the stronger factor is able to establish its dominance and determines the market’s future trend.
Market Analysis (The following charts are courtesy of QChart)
SPX daily chart
An overview of the chart clearly shows how SPX dropped to the bottom line of its channel in early August and, in spite of several probes, has been unable to extend the decline which started from the 3028 top. Another quick glance also shows a similarity of the pattern labeled A with the current pattern labeled A’. In both cases, the first leg of a decline halted with a consolidation of several weeks and, in the case of A, eventually continued to decline lower into the 40-week low. Will the A’ pattern conclude in the same manner with a decline into the 40-wk cycle over the next few weeks? It’s certainly a possibility but, until it actually takes place, that’s all it is!
The similarity of A’ to A extends to the oscillators below. In A, the sideways pattern in price took the oscillators from an oversold bearish condition to a slightly bullish one before falling back into negative territory when prices continued to decline. We have a similar pattern forming in the indicators in A’ today, but we can’t look for too much exactitude between the two patterns; and we certainly cannot predict that the current one will resolve in exactly the same way, but both the price resemblance and the cyclical factor are compelling enough to peak our interest.
There are other reasons forcing us to label the market trend as neutral at best, with a negative bias. This will remain so as long as prices do not exceed the 50-dma. If they do, it would nullify the similarity of the two patterns and create a potential extension to 2985 (P&F) before turning down again. Until the index breaks below the bottom channel line, we will not have a confirmation of the intermediate downtrend.
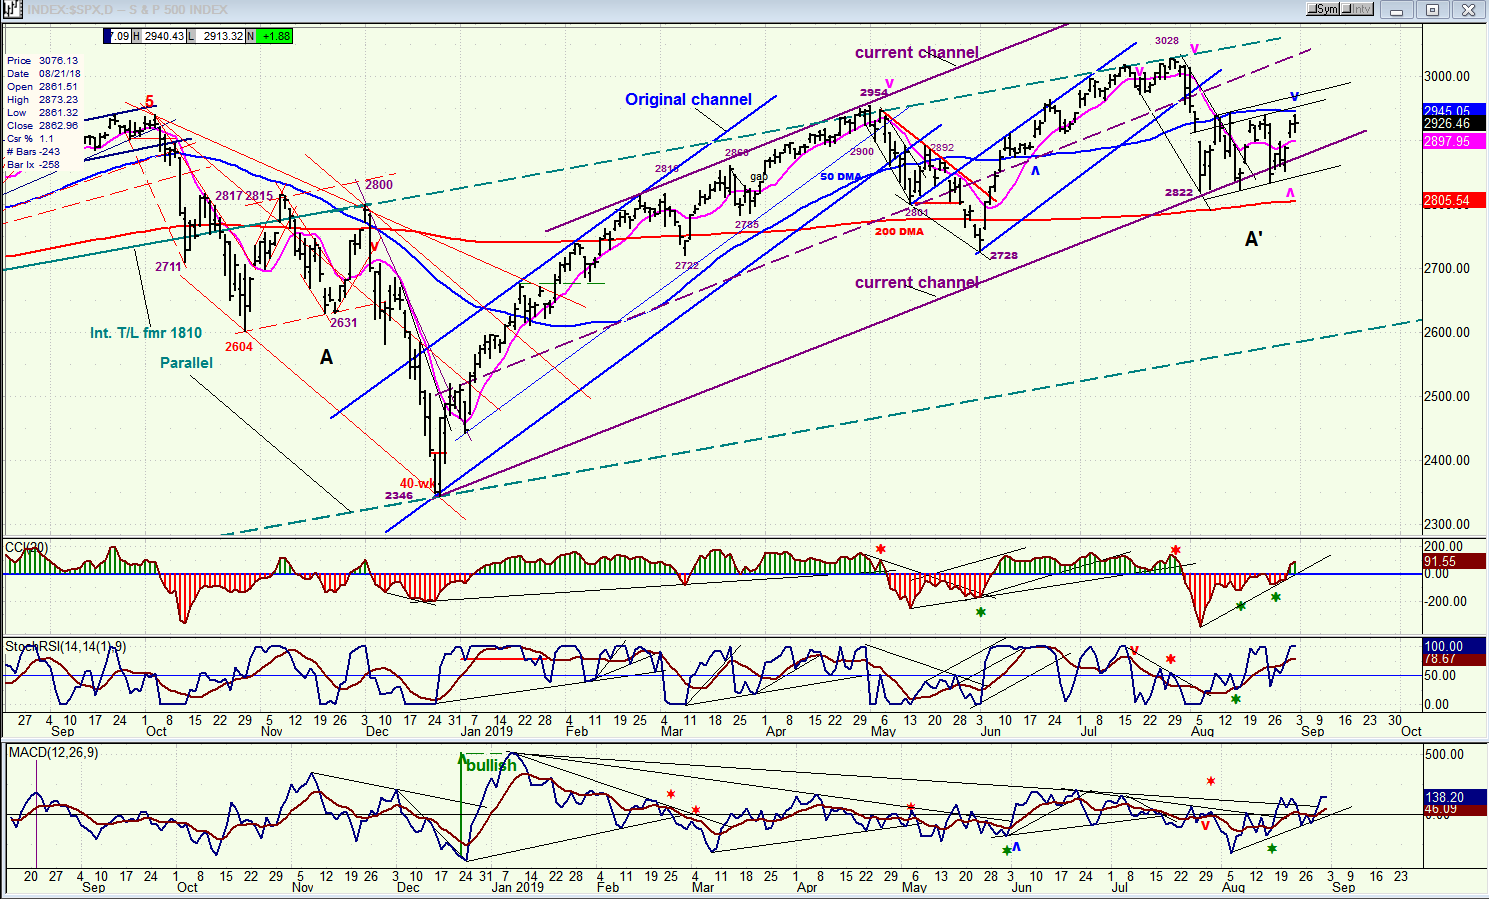
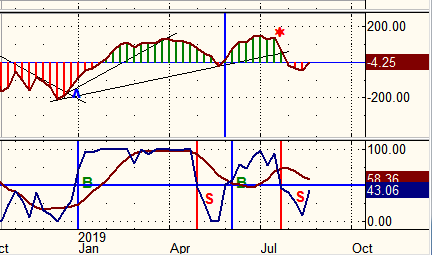
To complete the technical appraisal of the SPX, I should also mention that although the weekly oscillators (below) have improved as a result of the sideways move, they are still bearish.
SPX hourly chart
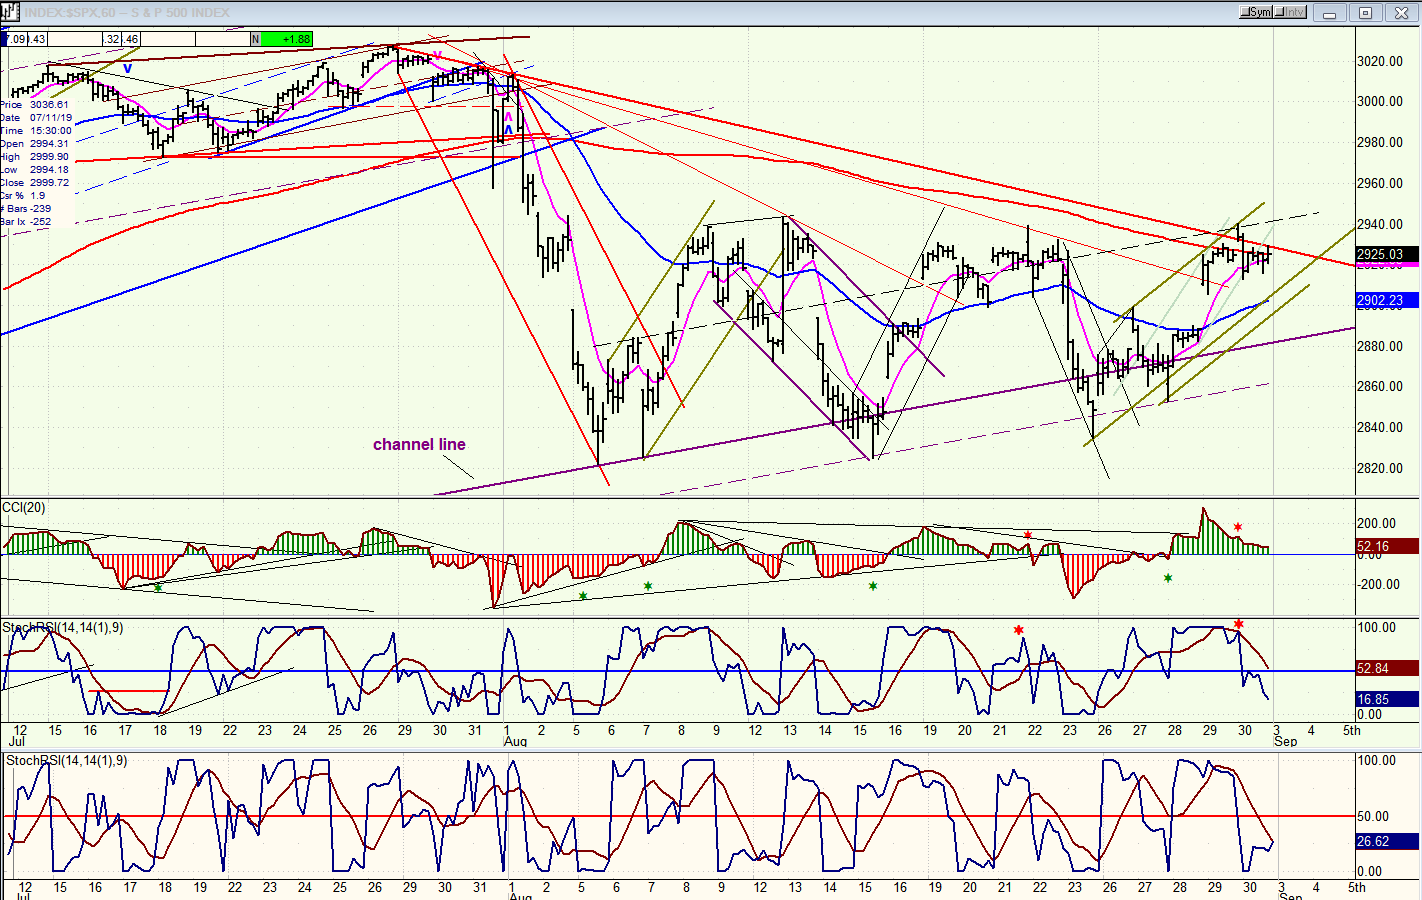
The third up-leg of the consolidation found resistance at the red downtrend line which created some minor distribution before and after the top was made. But this cannot be regarded as a valid trend line. It is connecting only two points and they are not very far apart. Nevertheless, it did stop the advance which had, in any case, reached its near-term target, while getting some assistance from the red 200-ma and a parallel to the channel line. The latter had already been penetrated twice and would probably not have held the third time without getting some assistance from your president.
The oscillators also suggest that this could be more than a minor top with the two lower ones having already given a sell signal and the top one showing negative divergence.
Despite the negative set-up, it will require that the three former short-term lows are broken decisively to suggest that the 40-wk cycle is now on its way to completing its final bottoming phase.
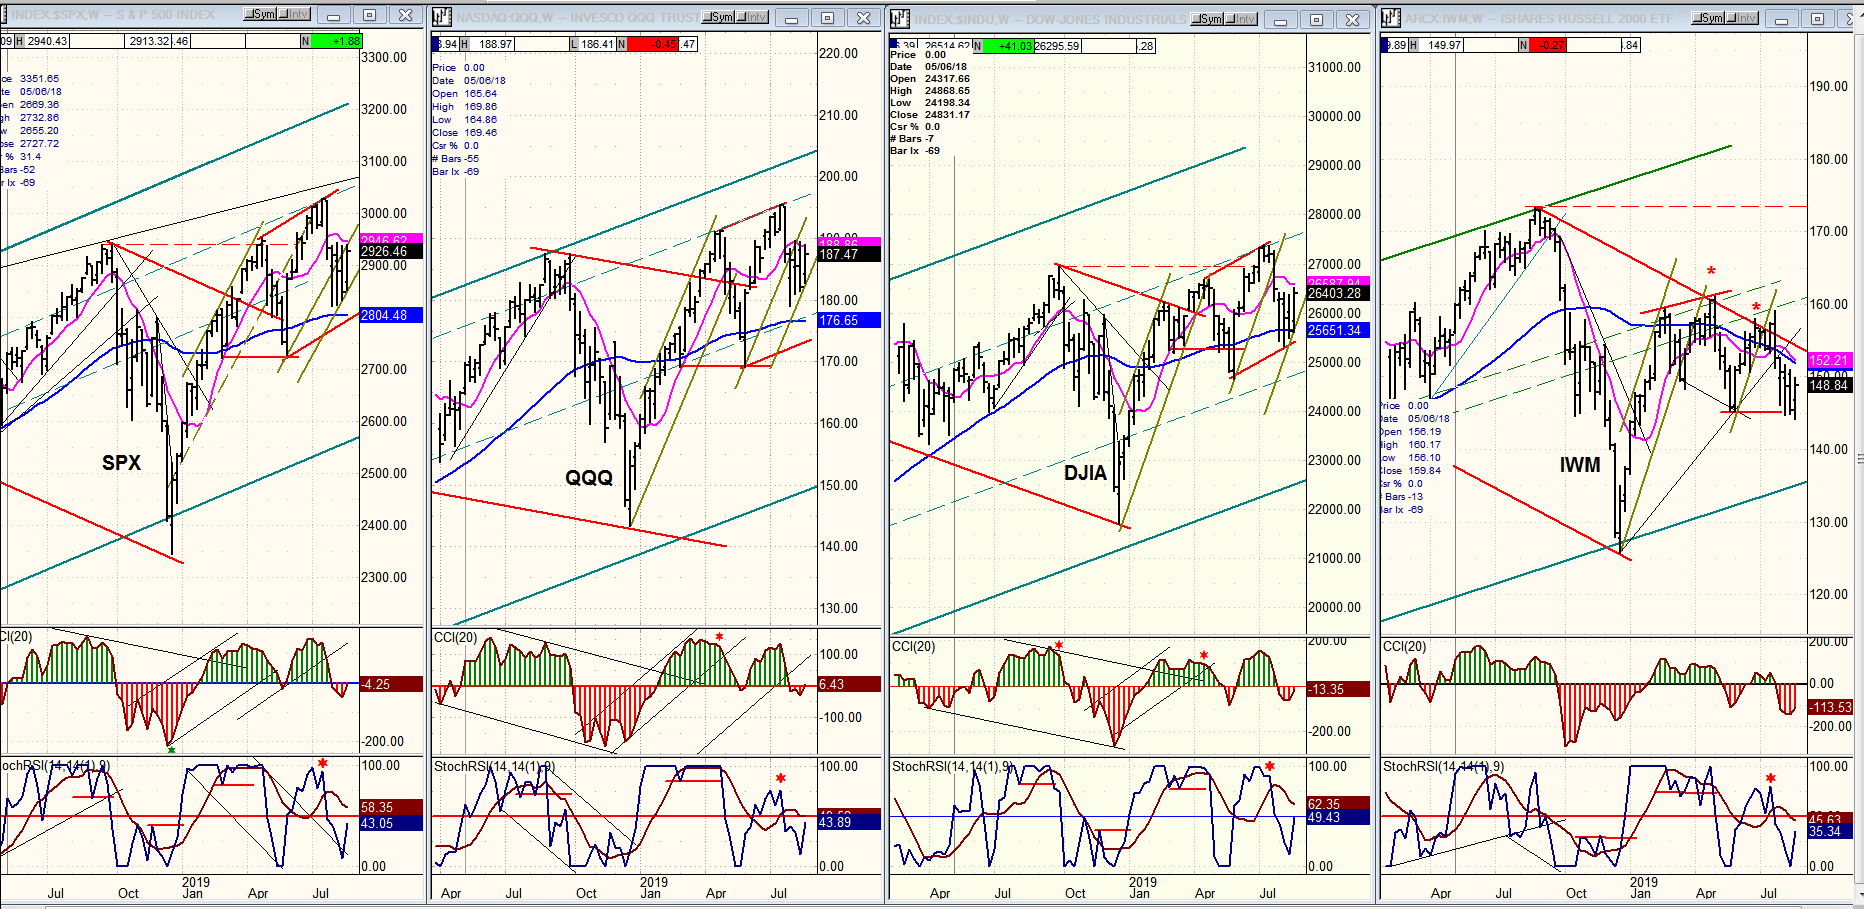
QQQ, SPX, DJIA, IWM (weekly)
From a weekly perspective, little has changed. The relative strength contrast between IWM and the other indexes remains the same. It would have to change visibly before we could consider the general market trend altered.
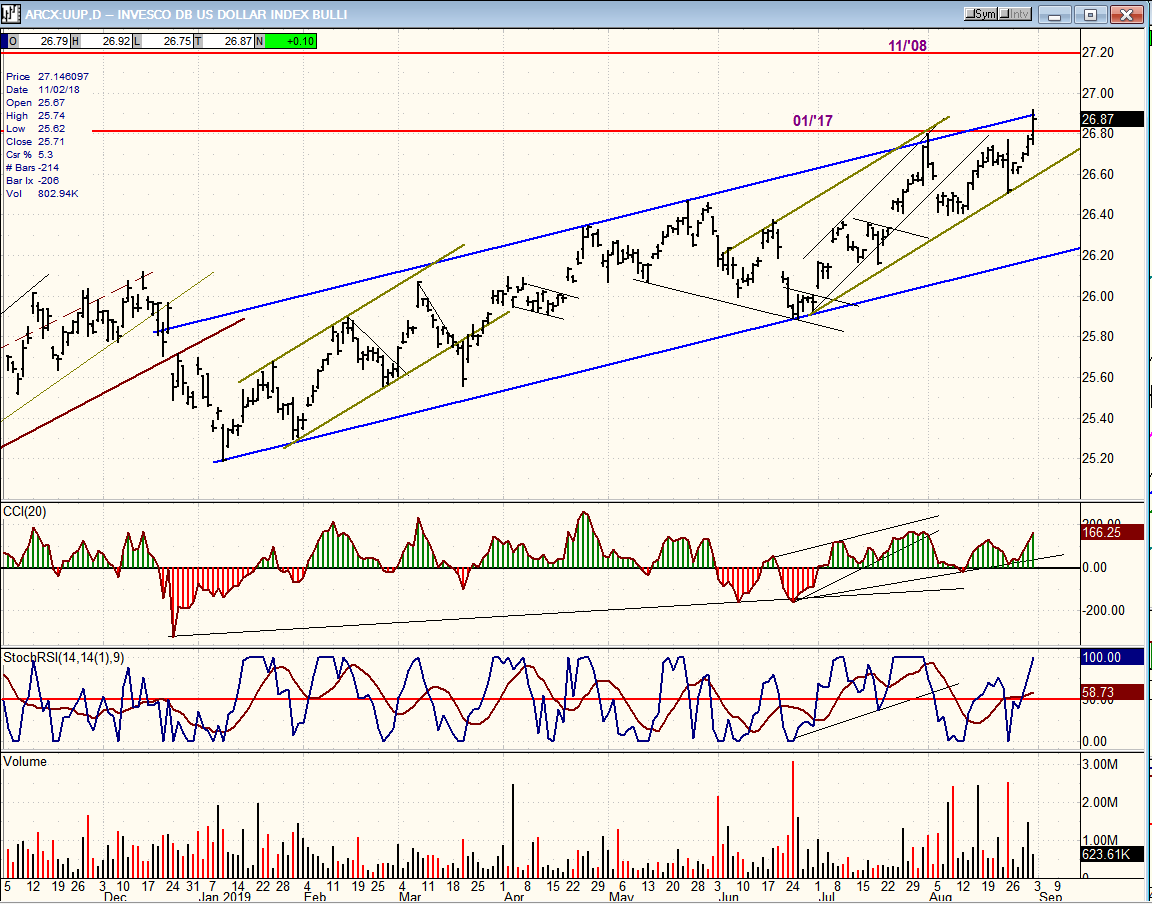
UUP (dollar ETF) daily
King dollar still reigns supreme as evidenced by its surpassing the January 2017 high on Friday, and taking aim at the November 2008 high which is only slightly higher. That move did put it at the top of its trend channel from January of this year where it could find some resistance. It could also be somewhat affected by the jobs report due on Friday.
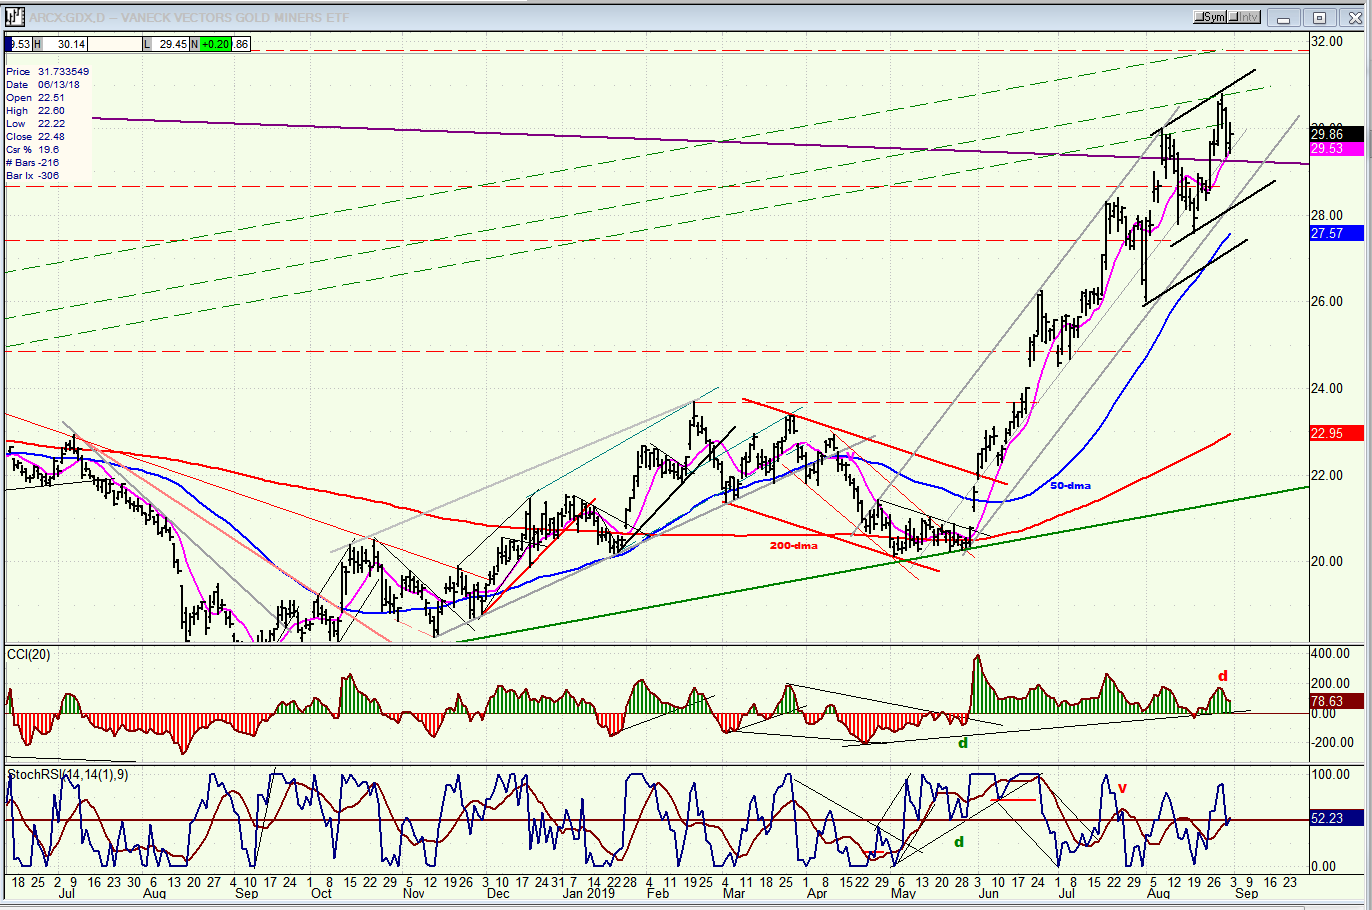
GDX (Gold miners ETF) weekly
For the first time since its late May breakout, GDX is showing signs that it may want to consolidate before moving higher. A couple of parallels to the base trend line have offered enough resisance to create some deceleration in the trend. This should be short-lived and followed by a move to the 34-35 target, after which a more important correction could take place.
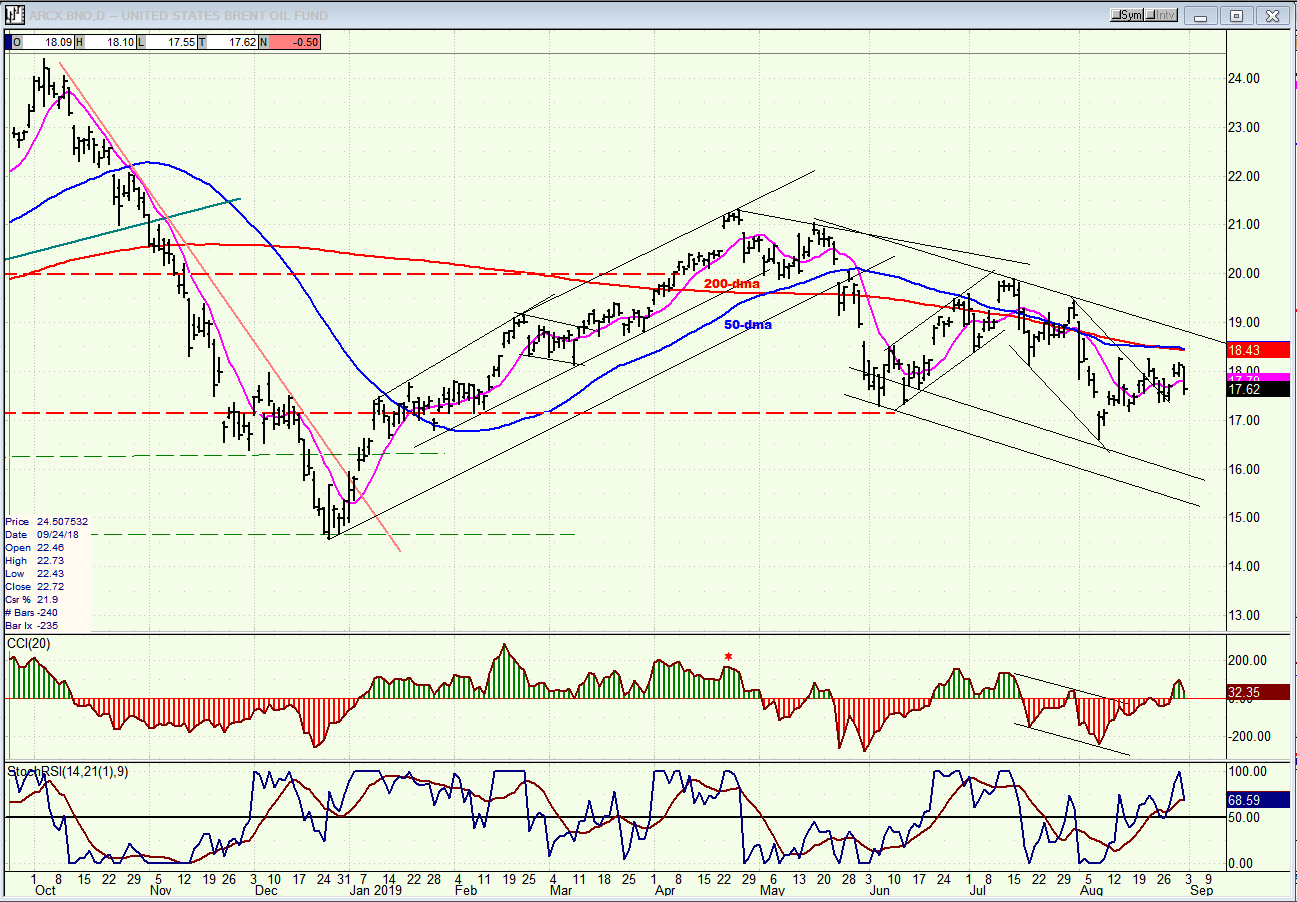
BNO (U.S. Brent oil fund) daily
BNO continues to mimic the market trend and should continue to decline as long as it remains within the well-established bearish channel.
Summary
In early August, SPX found support at the bottom of its intermediate channel from 2346. This started a consolidation process which is likely to be resolved to the downside before too long.
FREE TRIAL SUBSCRIPTON
With a trial subscription, you will have access to the same information that is given to paid subscribers, but for a limited time period. I think you will find that knowing how far a move can carry is one of the most useful benefits of this service, whether you are a trader or an investor -- especially when this price target is confirmed by reliable indicators which give advance warning of a market top or bottom. Furthermore, cycle analysis adds the all- important time element to the above price projections.
For a FREE 4-week trial, further subscription options, payment plans, and for general information, I encourage you to visit my website at www.marketurningpoints.com.
The above comments about the financial markets are based purely on what I consider to be sound technical analysis principles. They represent my own opinion and are not meant to be construed as trading or investment advice, but are offered as an analytical point of view which might be of interest to those who follow stock market cycles and technical analysis.
********

When Andre Gratian was a stock broker years ago, a friend introduced him to technical analysis of the market. Consequently, it is not an exaggeration to say that Andre fell in love with this approach! Ever since then, it has become an increasingly important part of his professional life. Gratian has studied the works of Wyckoff, Edwards & Magee, Edward J. Dewey (cycles) and many others. However, one of my most profitable undertaking has probably been to study Point & Figure charting, which he finds invaluable in analyzing stocks and indices. If he were restricted to one methodology, this is the one that he would choose. This well-rounded background has given him what he feels to be a special insight into the stock market, facilitating the recognition of meaningful patterns and the ‘turning points’ in all trends, whether they be short or long term. Andre feels very comfortable discussing the stock market and passing on meaningful information to others. His subscribers include individuals and money managers throughout the world. Moreover, his Newsletters are currently published on several financial sites, here and abroad.


