Technical Analysis Of The Markets


Current Position of the Market
SPX: Long-term trend – There are no clear signs that the bull market is over.
Intermediate trend – Indecisive.
Analysis of the short-term trend is done on a daily basis with the help of hourly charts. It is an important adjunct to the analysis of daily and weekly charts which discusses the course of longer market trends.
Range Bound
Market Overview
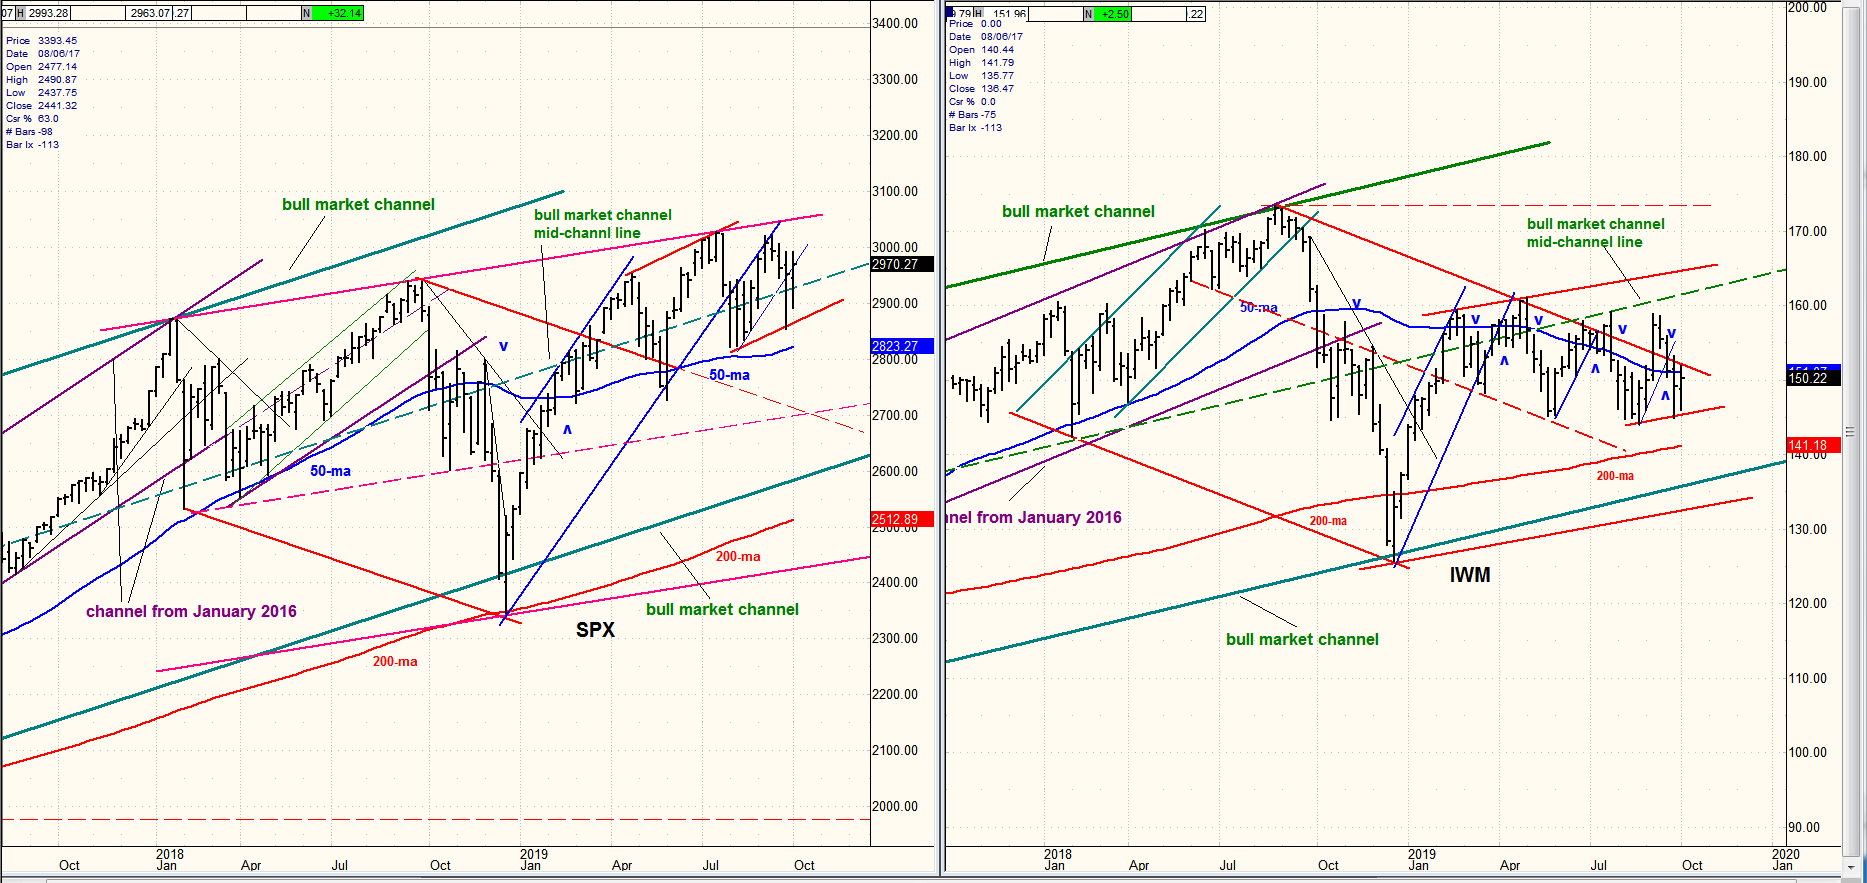
Ever since it made its all-time high of 3028 on 7/21, SPX has been trading in a 200-point range which could either be a consolidation pattern, or the building of an intermediate top formation. The same can be said of IWM, although the latter made its high almost a year earlier and is either consolidating at a much lower level, or is already in an intermediate downtrend.
Last week brought no change to the weekly pattern. As in the previous week, prices started on the downside, but recovered at the end of the week, again driven by a rash of bullish news. I had expected the 40-wk cycle which was due in this time frame to take prices lower over the near term, but it remains elusive. We have no choice but to wait for the market to clarify its intention.
Market Analysis (All charts are courtesy of QChart)
SPX daily chart
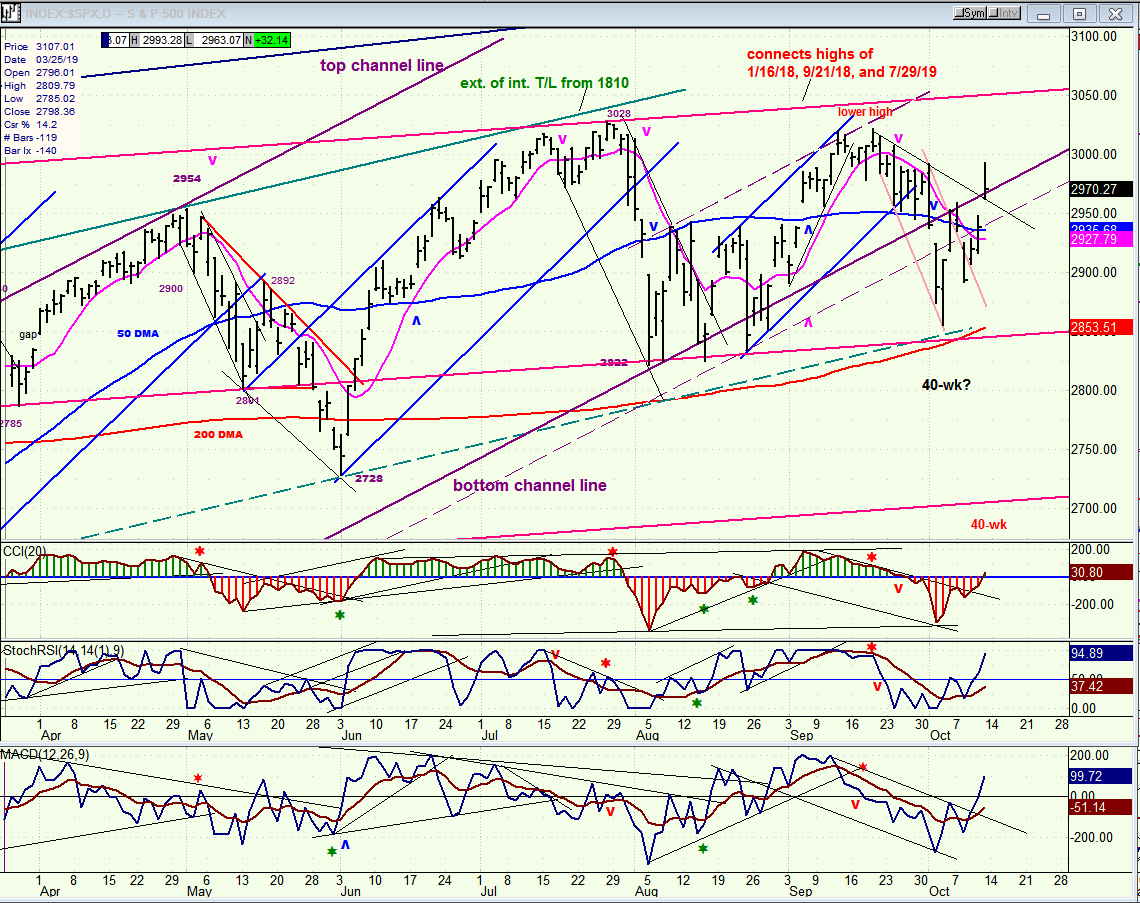
On Friday, the index opened with a gap and continued outside of a short-term downtrend line, establishing a new short-term uptrend from last week’s low of 2856. This puts it at a critical level! If it continues to move higher and overcomes the previous top of 3022, it
will have practically confirmed that the 40-wk cycle made its low at 2856. This would disappoint those expecting that cycle to carry a bigger punch – including me. It would also increase the odds that the former high of 3028 will be surpassed!
The way SPX closed on Friday should somewhat relieve the bears’ anxiety, but it will take more than that to suggest that the cycle low is still ahead of us. Dropping back below 2900 right away would be helpful since it would turn the oscillators down again before they get an uptrend established. Needless to say, the price action of the next few days will have a big impact not only on the short term, but on the intermediate trend as well.
SPX hourly chart
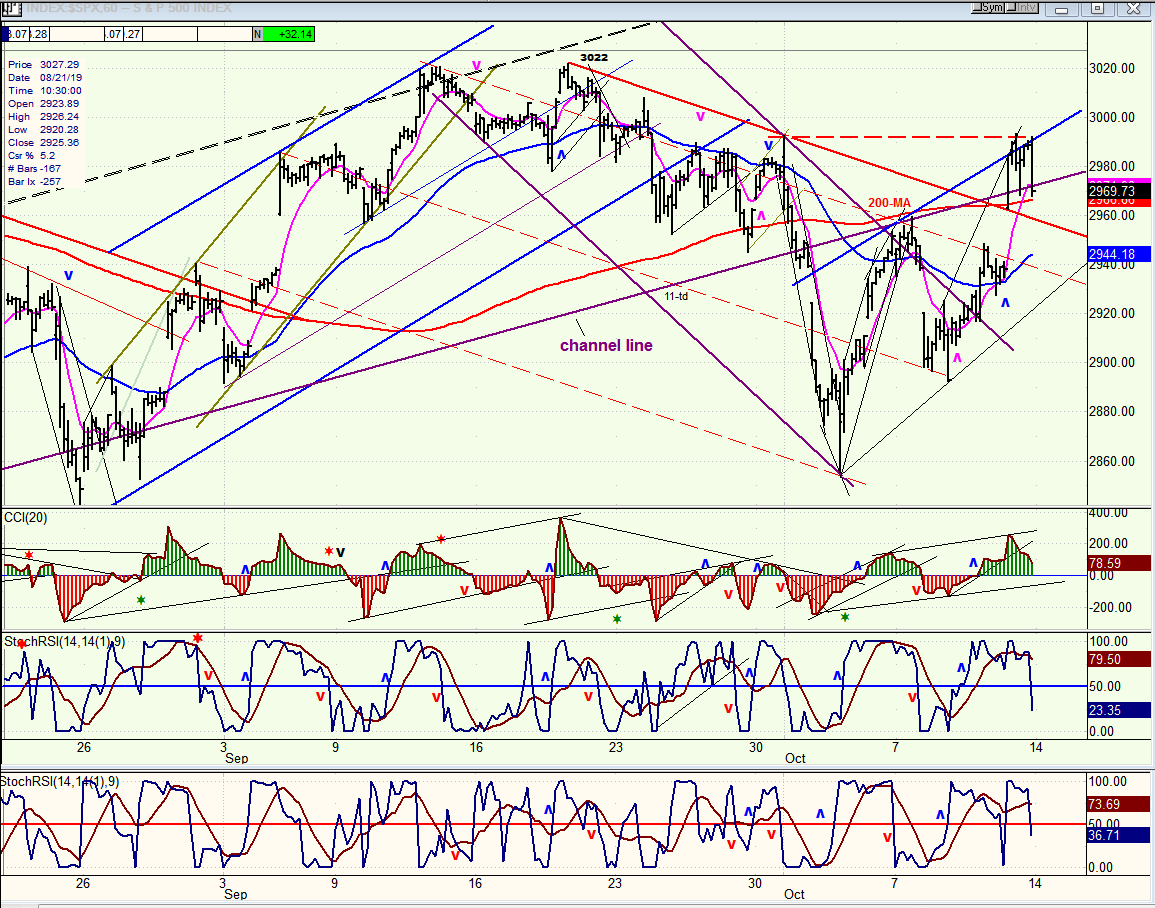
There are several reasons why SPX stopped where it did on Friday and pulled-back: it ran into resistance at a previous short-term high; it was pushed back by the resistance pattern that formed around the 3022 top; it was also stopped by the blue trend line which is a parallel of the other two shown on the chart and whose origin goes back to the first channel that formed with the uptrend from 2346 (as you can see on the weekly chart above). The move from 2856 (so far) looks like a completed a-b-c corrective pattern whereby c=a. This is why it is important for the pull-back which started on Friday to continue at least below 2955 to ensure that this is indeed a corrective pattern, and not an incomplete impulse wave.
We have to acknowledge the strength behind this 137-point move which has already overtaken not only the 50-MA but the 200-MA as well. By the close the oscillators were near giving an indication that the move of the second phase was over, but this would only be confirmed if prices retraced a little more on Monday.
UUP (dollar ETF) daily
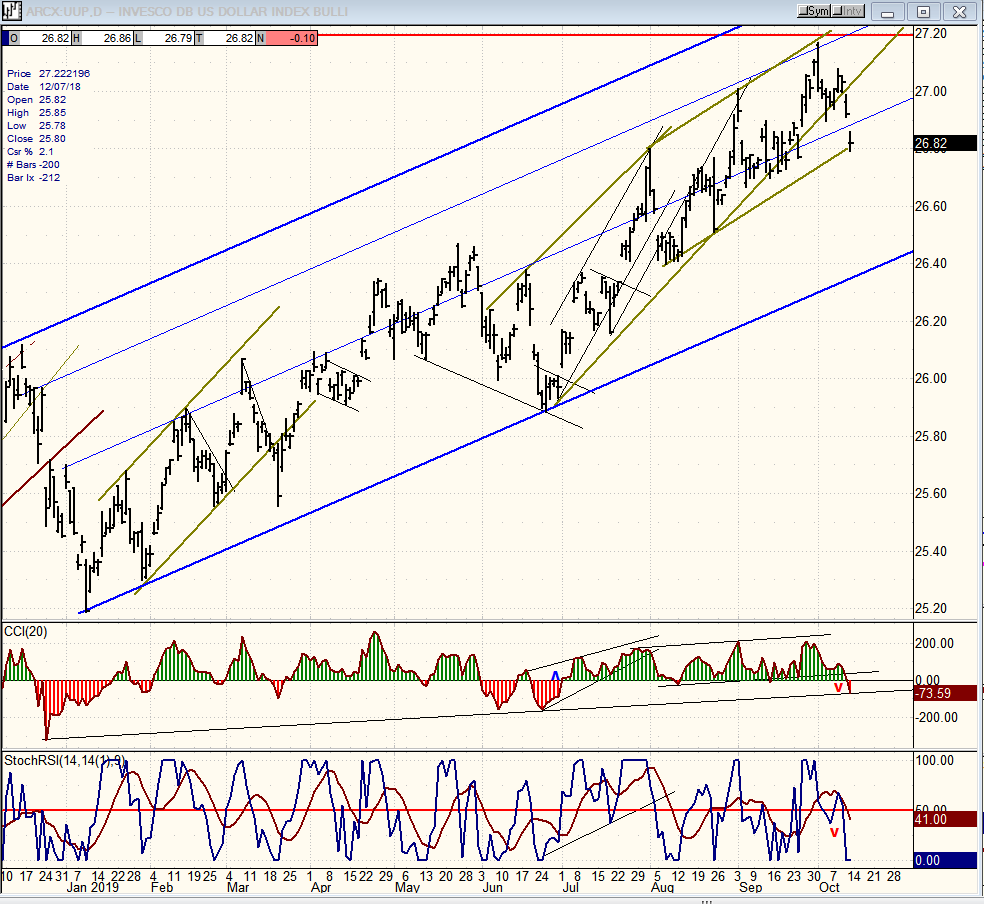
UUP needs to break a little lower to confirm that it has started a minor correction which could take it to the bottom of the blue channel if it continues. This is the first time since the inception of the green channel that the CCI has dipped into the red, but it now needs to accelerate on the downside to confirm the corrective process.
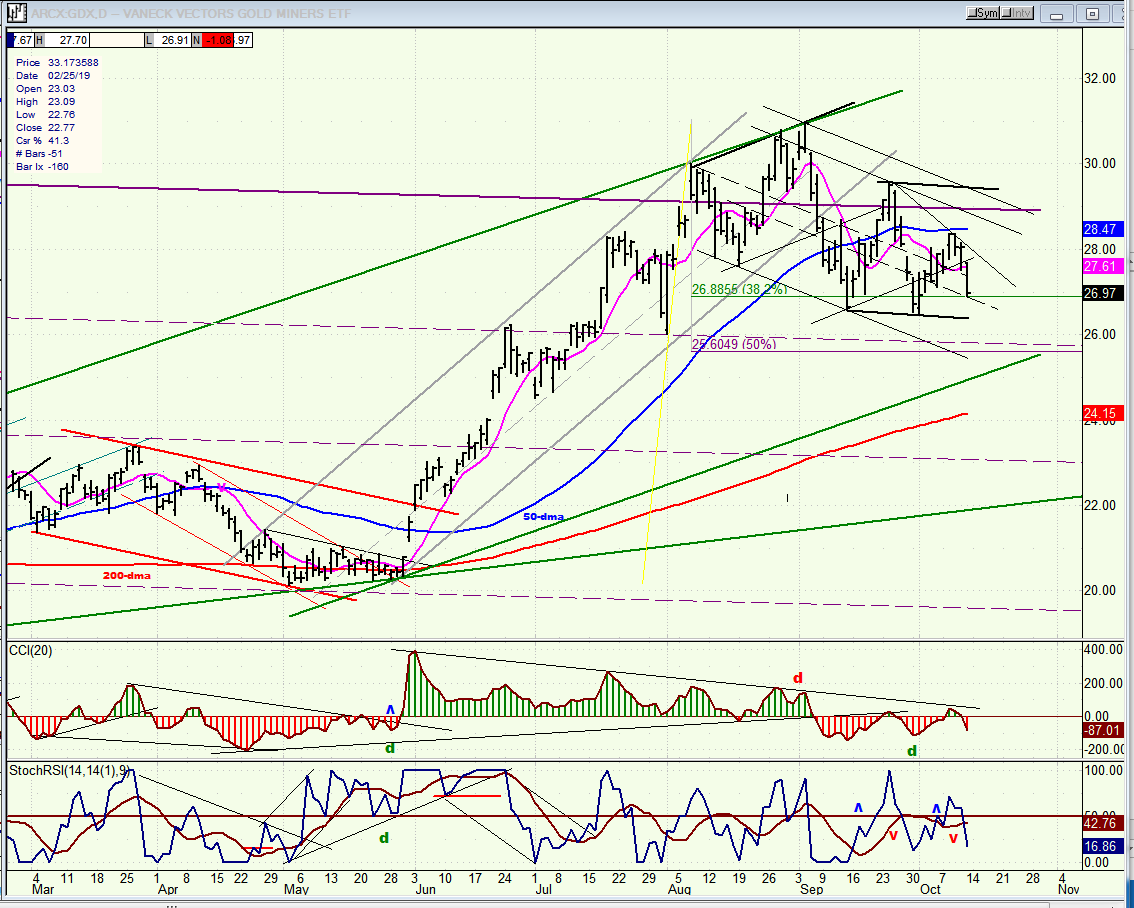
GDX (Gold miners ETF) weekly
GDX continues to build a secondary base which could be just about complete if it can hold ~26.00. It can be helped by weakness in UUP if the latter continues to correct.
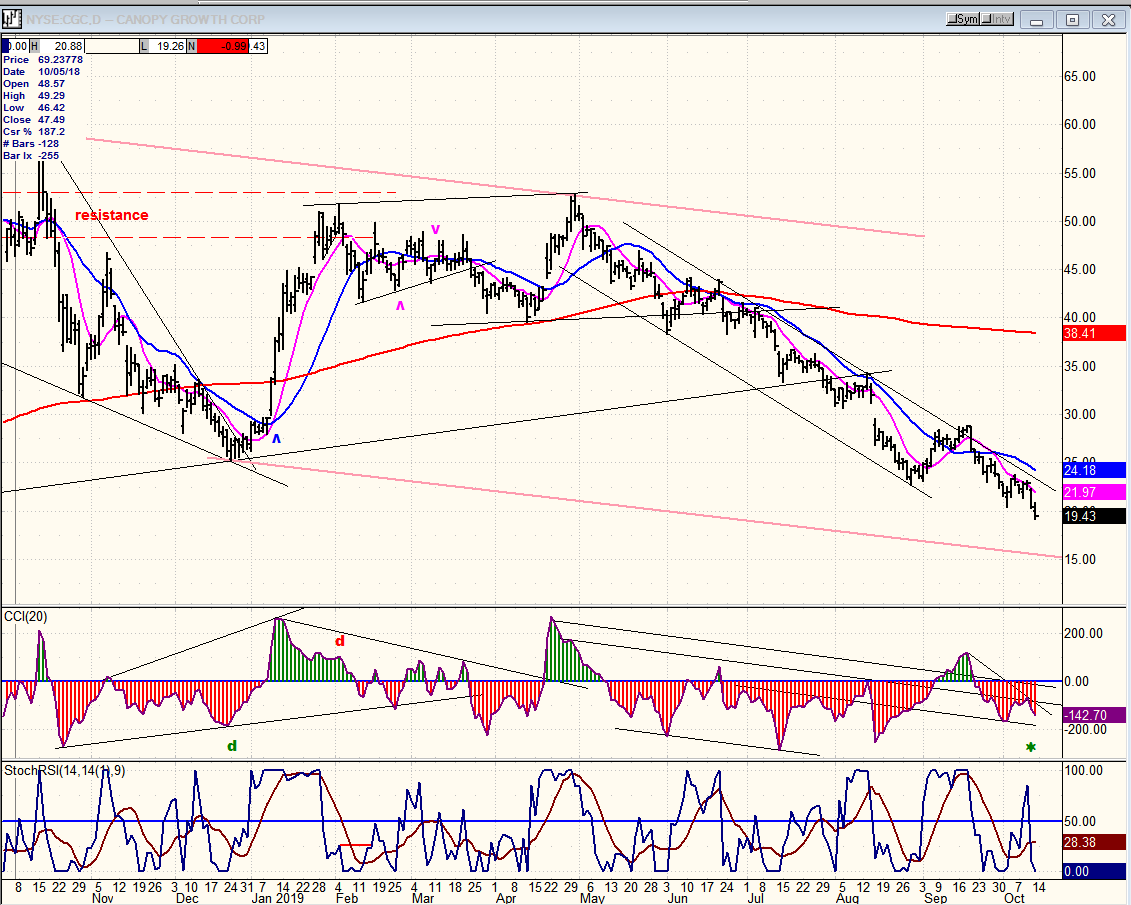
CCG (canopy growth) daily
CGC may be approaching the end of an extended correction if it can find support at the bottom of the red channel.
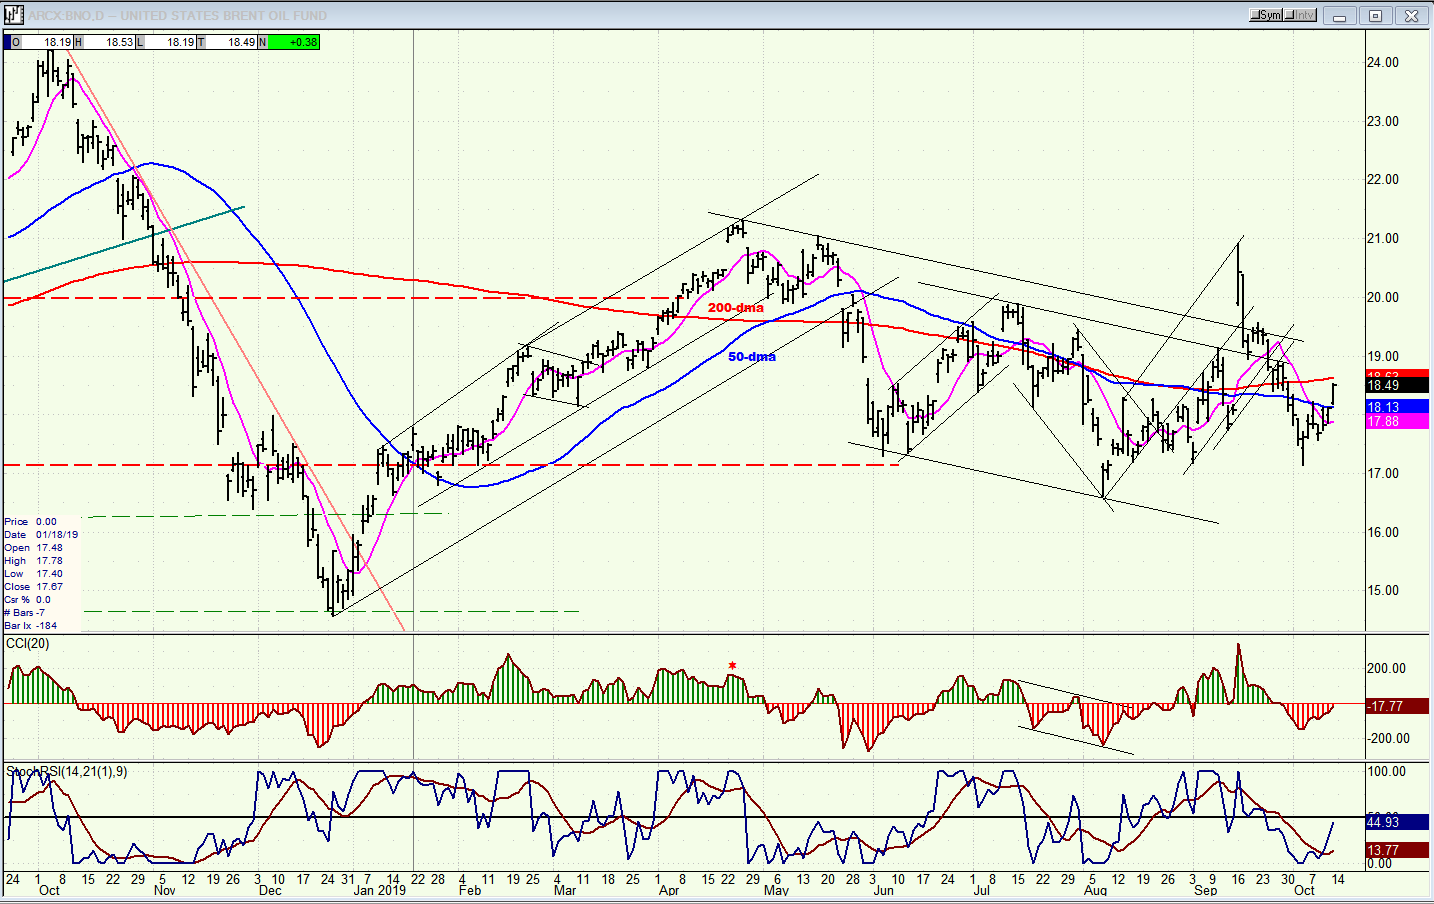
BNO (U.S. Brent oil fund) daily
BNO continues to follow the market and has rallied along with it. This relationship should continue.
Summary
SPX is at a decision point and the path it chooses over the next few days could have important consequences for the near and longer term trend.
FREE TRIAL SUBSCRIPTON
With a trial subscription, you will have access to the same information that is given to paid subscribers, but for a limited time period. I think you will find that knowing how far a move can carry is one of the most useful benefits of this service, whether you are a trader or an investor -- especially when this price target is confirmed by reliable indicators which give advance warning of a market top or bottom. Furthermore, cycle analysis adds the all- important time element to the above price projections. For a FREE 4-week trial, further subscription options, payment plans, and for general information, I encourage you to visit my website at www.marketurningpoints.com.
The above comments about the financial markets are based purely on what I consider to be sound technical analysis principles. The represent my own opinion and are not meant to be construed as trading or investment advice, but are offered as an analytical point of view which might be of interest to those who follow stock market cycles and technical analysis.
*********

When Andre Gratian was a stock broker years ago, a friend introduced him to technical analysis of the market. Consequently, it is not an exaggeration to say that Andre fell in love with this approach! Ever since then, it has become an increasingly important part of his professional life. Gratian has studied the works of Wyckoff, Edwards & Magee, Edward J. Dewey (cycles) and many others. However, one of my most profitable undertaking has probably been to study Point & Figure charting, which he finds invaluable in analyzing stocks and indices. If he were restricted to one methodology, this is the one that he would choose. This well-rounded background has given him what he feels to be a special insight into the stock market, facilitating the recognition of meaningful patterns and the ‘turning points’ in all trends, whether they be short or long term. Andre feels very comfortable discussing the stock market and passing on meaningful information to others. His subscribers include individuals and money managers throughout the world. Moreover, his Newsletters are currently published on several financial sites, here and abroad.


