Technical Analysis Of The Markets


Current Position of the Market
SPX: Long-term trend – There are no clear signs that the bull market is over.
Intermediate trend – Most likely building an intermediate top.
Analysis of the short-term trend is done on a daily basis with the help of hourly charts. It is an important adjunct to the analysis of daily and weekly charts which discusses the course of longer market trends.
Cycles Peaking
Market Overview
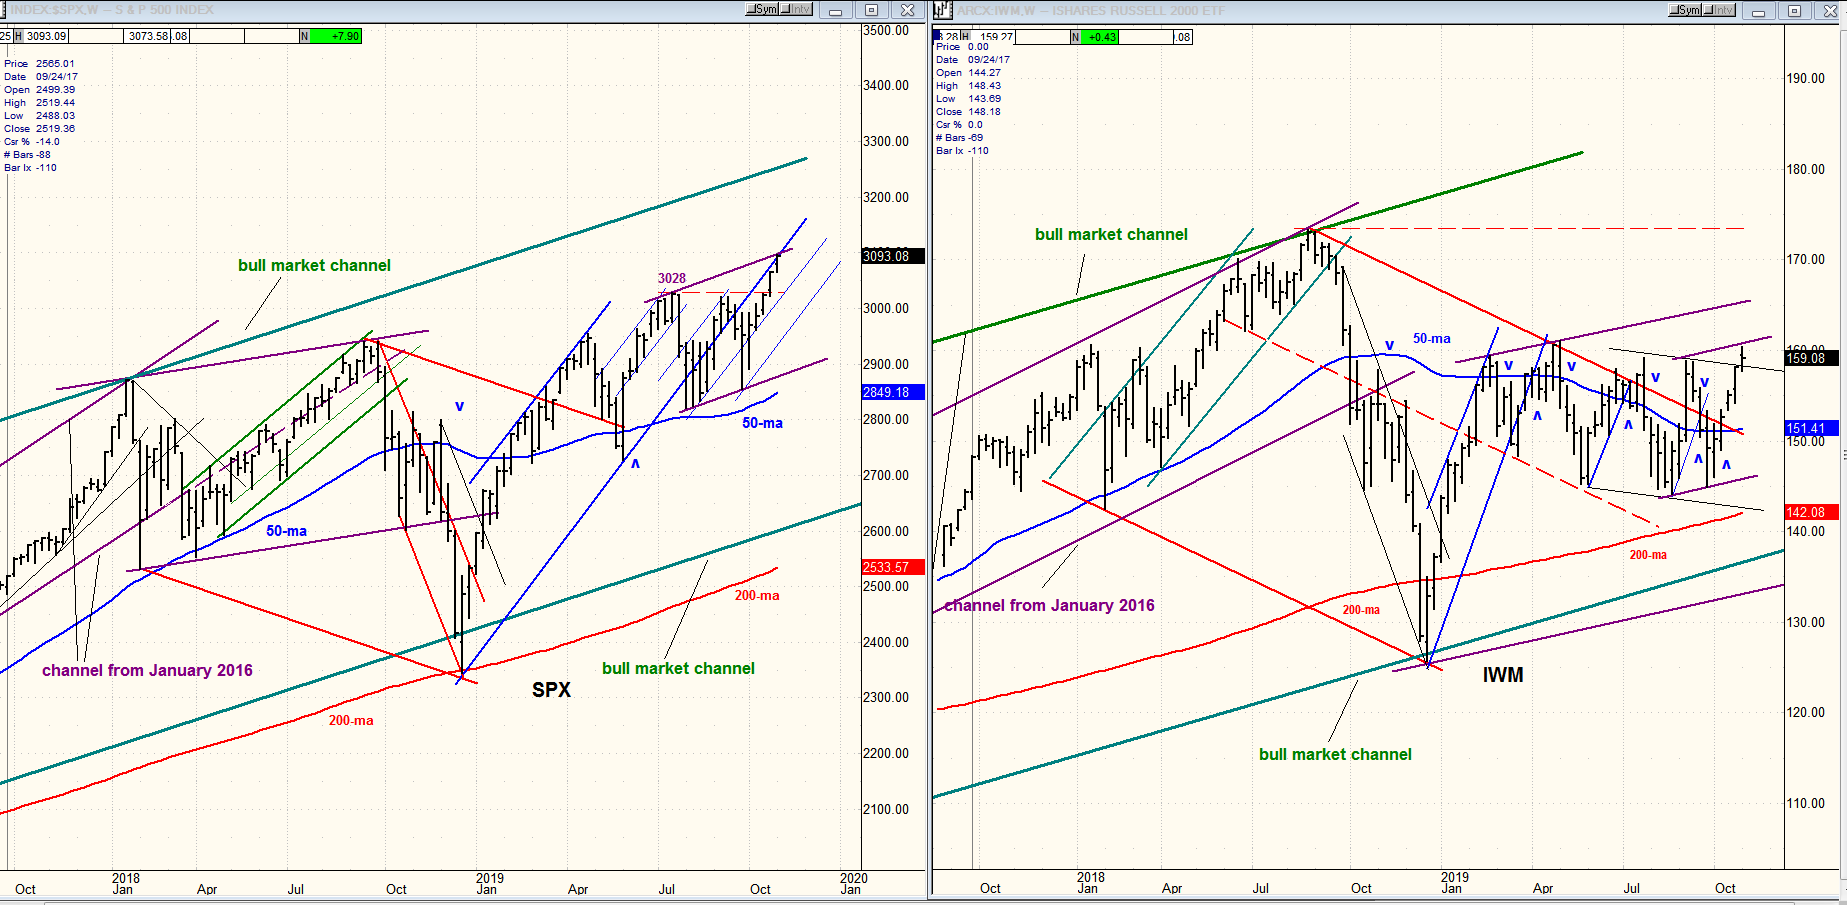
The best guesstimate is that SPX is in the process of creating an intermediate top, probably the B-wave of wave-4 of the bull market. The only thing that would disprove this view is if market strength continued with IWM beginning to take the lead. Since this is obviously not happening, we’ll have to stay with the current premise. I stated in the previous letter that Eric Hadik ([email protected]) was predicting that multiple cycles should be peaking between Nov. 1-15. We are in that time zone and negative divergences are now showing in the daily and hourly indicators. This strongly suggests that we are near reversing the trend which started in early October at 2856. A word of caution! I believe that longer-term we are making a rounding top, and this takes time to form. Therefore, I would not expect a sharp, protracted decline immediately. Rather, a bearish pattern which would develop over a period of time. This is supported by the fact that the 10X P&F chart currently shows very little distribution, and some will have to become evident before we start a serious decline. With the 80-day Hurst cycle low due ~11/14, we should see initial weakness appear next week.
Market Analysis (All charts are courtesy of QChart)
SPX daily chart
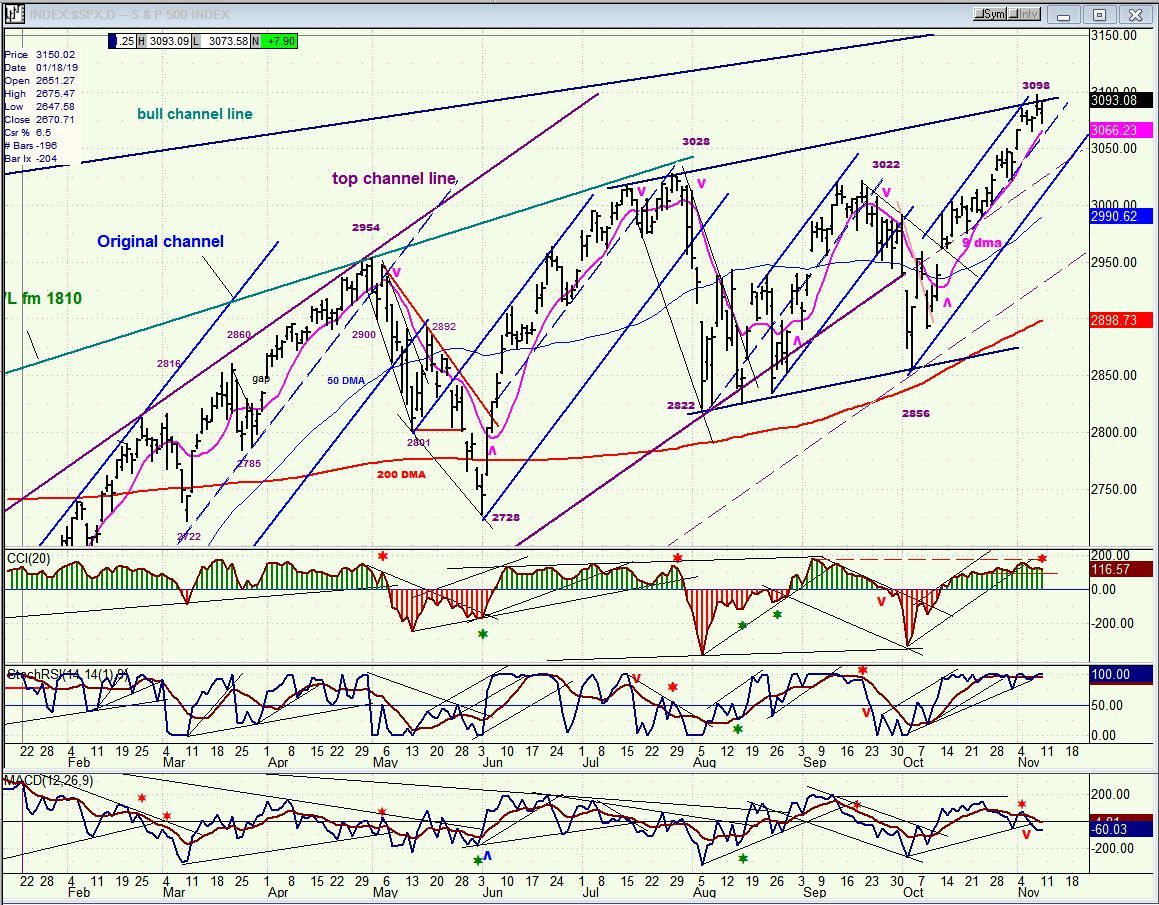
The original channel from 2346, represented here by two parallel blue lines, has served as a model for all the uptrends that were generated after it ended. They are all structured the same way: a top and a bottom channel line which are parallels to the original channel, with a dashed parallel approximately in the center. The index price tends to remain above that center line until we get close to the end of the move. When it crosses the dashed line, it is near the end of the move. The crossing of the middle line is usually followed by a retest of the high before the price breaks out of the channel and a correction begins. The final top is preceded by negative divergence in the oscillators with the A-Ds (lowest) always preceding the others. Another manifestation of a short-term top is when price crosses below the magenta 9-dma.
The last short-term uptrend from 2856 is following this pattern exactly, so far! Negative divergence has already appeared in the CCI and the A-Ds have already gone negative. With the Hurst cycle due to bottom at the end of the week, we should expect the 9-dma to be crossed by the price any day. But since the lower channel line is not that near, the odds favor a retest of the high and a little top distribution taking place before we start trading outside of that channel line. This would also satisfy the need for additional congestion to form on the P&F chart.
SPX hourly chart
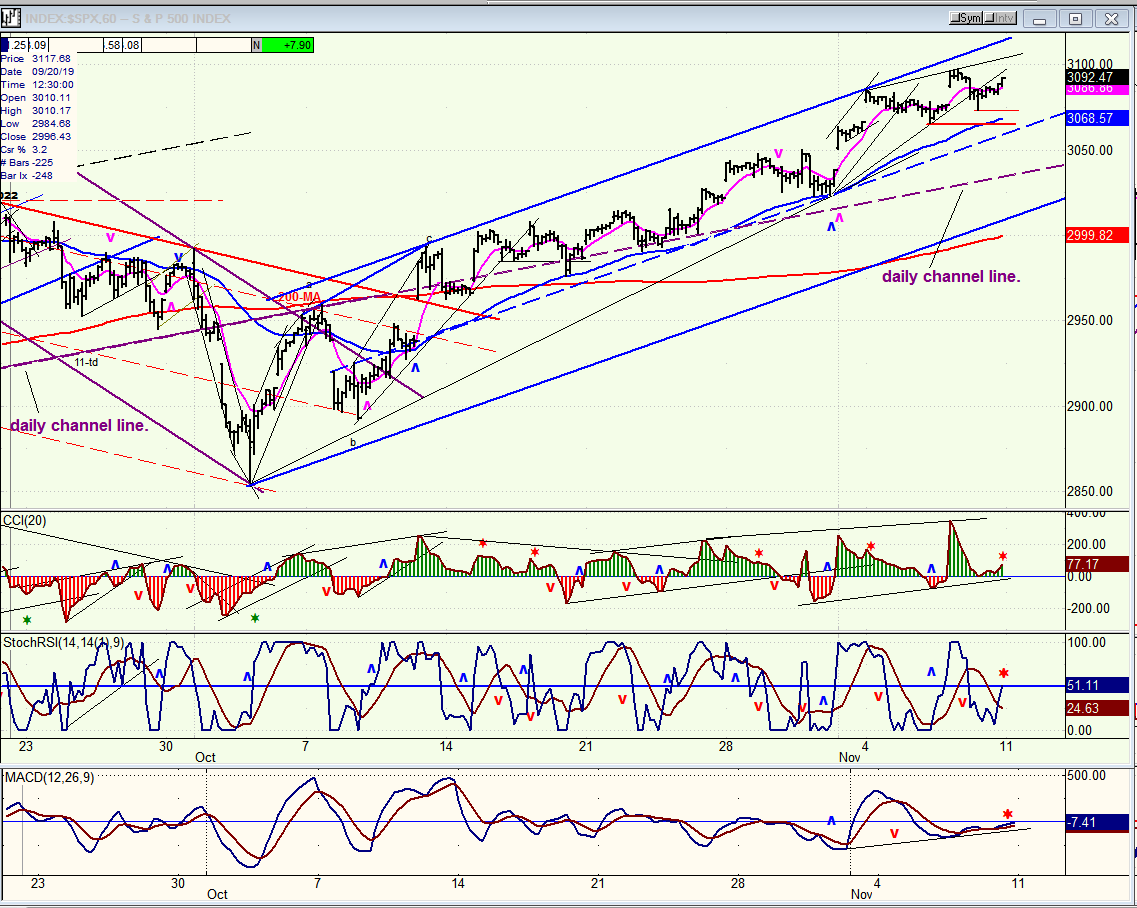
The channel just discussed on the daily chart is represented here on a 60m chart. In this time frame, the channel lines and the mid-channel dashed line are seen in greater detail as each daily bar is replaced by 7 hourly ones. But real difference is in the moving averages. The blue 50-ma takes the place of the magenta 9-dma. You can see how it has supported prices since early in the move and that it would take a trade below ~3065 to suggest that we are ending the trend which started from 2856. The purple daily channel line runs at about 3045, and this is where we can expect to find initial support leading to a rebound that would most likely put the final touch on an intermediate top. By the time we trade below the bottom channel line, we should have an adequate distribution pattern on the P&F chart, and we can get a good idea of the extent of the next decline.
Just as the daily oscillators are showing negative divergence, the hourly ones are even more advanced in this regard, which is telling us that the index price should soon capitulate to the increased pressure coming from the cycle due to make its low towards the end of the week, the first of several others to follow.
UUP (dollar ETF) daily
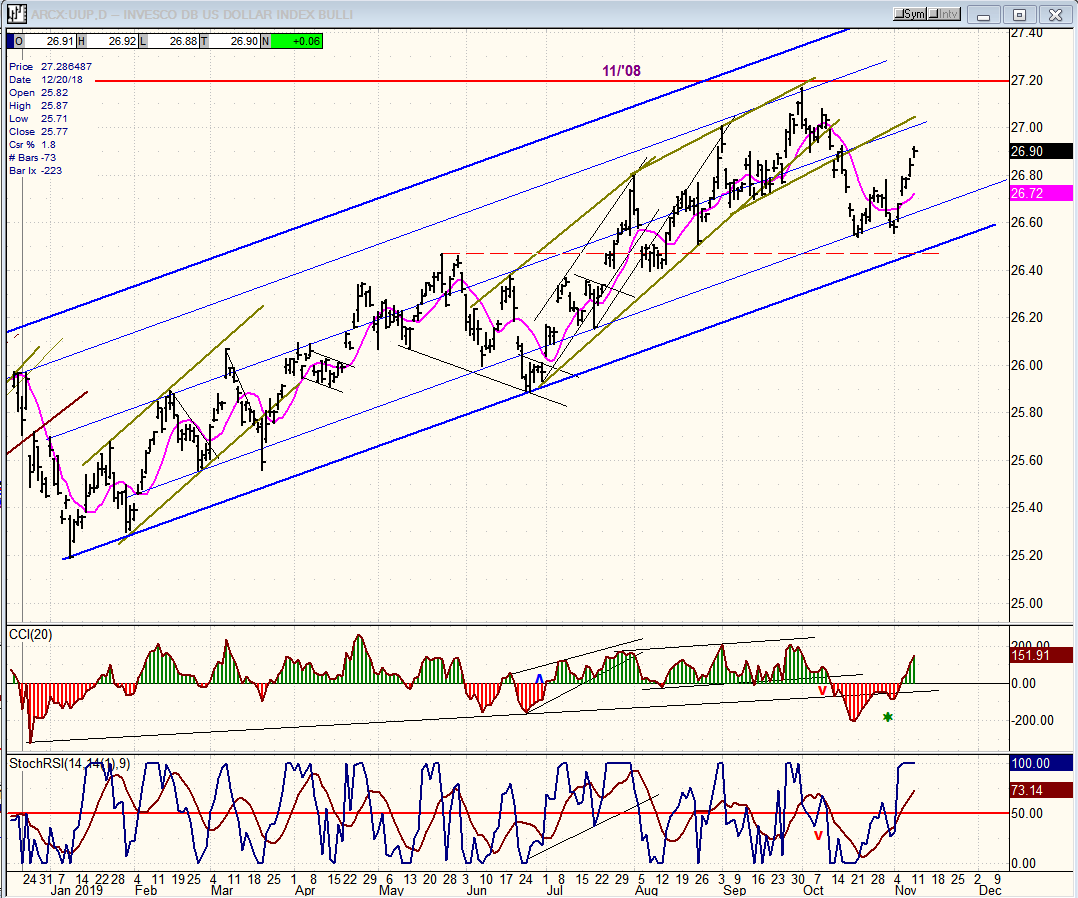
UUP found support on a secondary channel line and rallied after making a small double bottom. A reversal back down does not appear to be imminent, so it could move a little higher before turning back down again.
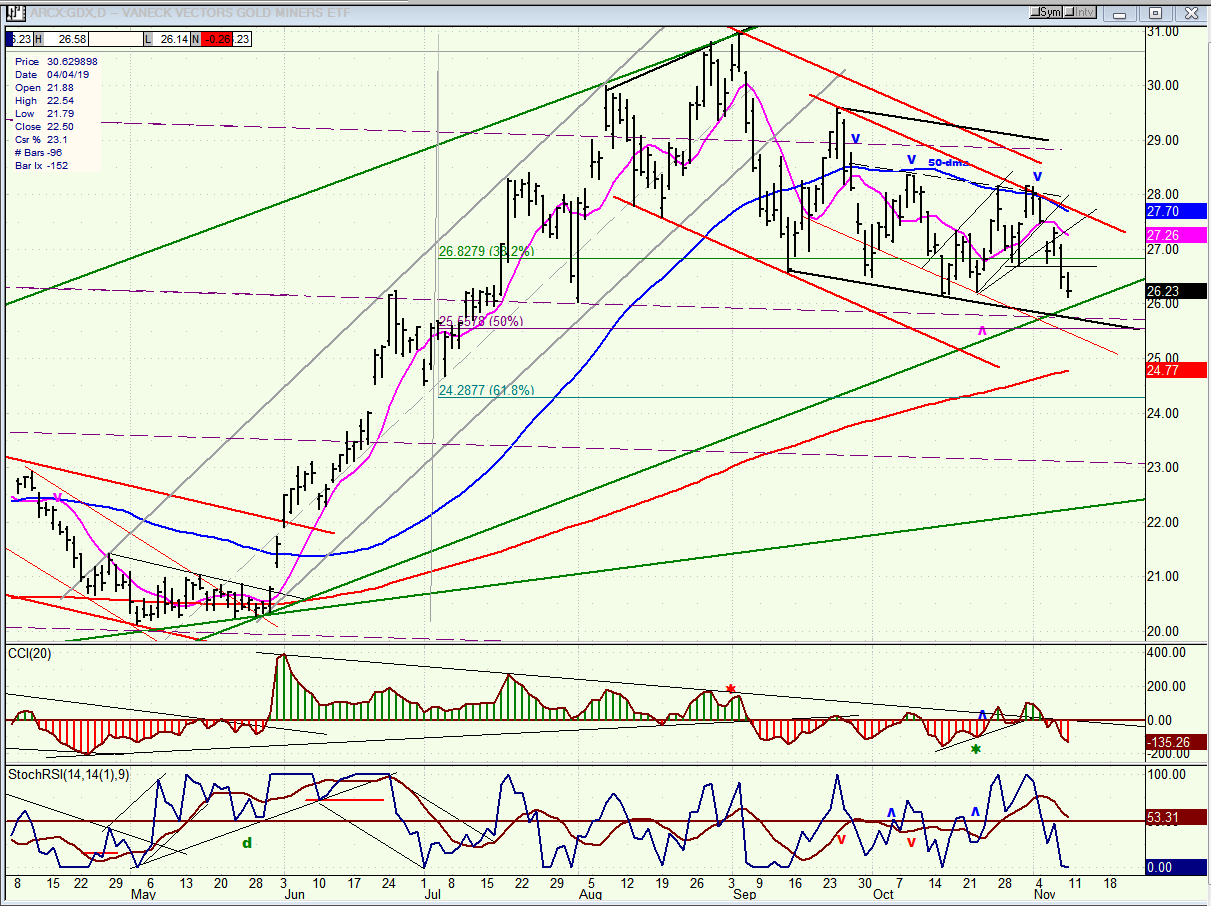
GDX (Gold miners ETF) weekly
GDX could not overcome overhead resistance provided by the 50-dma and turned back down in a manner that suggests that more time will have to pass (and probably lower prices) before it is in a position to try another reversal. The daily indicators were damaged by price loss and they will take some time to mend.
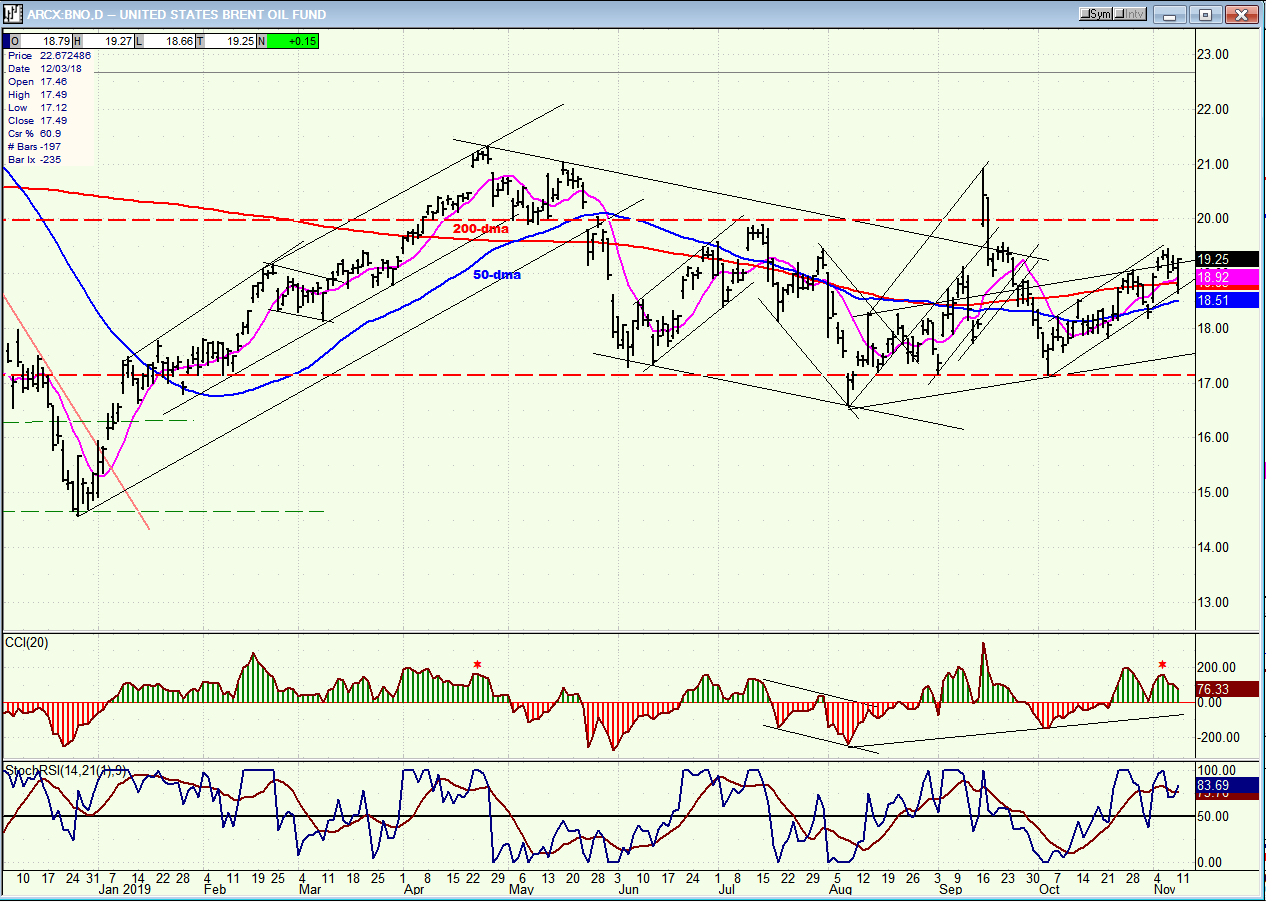
BNO (U.S. Brent oil fund) daily
BNO is ready to pull back with the market.
Summary
Everything suggests that SPX is in a topping area and ready to have a short-term correction which should develop into something larger.
FREE TRIAL SUBSCRIPTON
With a trial subscription, you will have access to the same information that is given to paid subscribers, but for a limited time period. I think you will find that knowing how far a move can carry is one of the most useful benefits of this service, whether you are a trader or an investor -- especially when this price target is confirmed by reliable indicators which give advance warning of a market top or bottom. Furthermore, cycle analysis adds the all- important time element to the above price projections. For a FREE 4-week trial, further subscription options, payment plans, and for general information, I encourage you to visit my website at www.marketurningpoints.com.
The above comments about the financial markets are based purely on what I consider to be sound technical analysis principles. They represent my own opinion and are not meant to be construed as trading or investment advice, but are offered as an analytical point of view which might be of interest to those who follow stock market cycles and technical analysis.
********

When Andre Gratian was a stock broker years ago, a friend introduced him to technical analysis of the market. Consequently, it is not an exaggeration to say that Andre fell in love with this approach! Ever since then, it has become an increasingly important part of his professional life. Gratian has studied the works of Wyckoff, Edwards & Magee, Edward J. Dewey (cycles) and many others. However, one of my most profitable undertaking has probably been to study Point & Figure charting, which he finds invaluable in analyzing stocks and indices. If he were restricted to one methodology, this is the one that he would choose. This well-rounded background has given him what he feels to be a special insight into the stock market, facilitating the recognition of meaningful patterns and the ‘turning points’ in all trends, whether they be short or long term. Andre feels very comfortable discussing the stock market and passing on meaningful information to others. His subscribers include individuals and money managers throughout the world. Moreover, his Newsletters are currently published on several financial sites, here and abroad.


