Technical Analysis Of The Markets


Current Position of the Market
SPX: Long-term trend – There are no clear signs that the bull market is over.
Intermediate trend – Most likely building an intermediate top.
Analysis of the short-term trend is done on a daily basis with the help of hourly charts. It is an important adjunct to the analysis of daily and weekly charts which discusses the course of longer market trends.
Trade News Still Relevant?
Market Overview
Until Thursday’s close, the price action looked toppy! For the past week, prices had traded in a narrow range and negative divergence had appeared at the daily and hourly level, and the fear & greed index has been at “extreme greed” for over a week. Furthermore, we are in a time frame when cycles are peaking, and the maximum P&F projection for this phase has essentially been reached. Is this the time to mortgage the house to buy stocks? Ah, but do not underestimate the power of algorithms when they kick in at the least mention of bullish news about trade talks, as they did overnight Thursday, resulting in program buying and short-covering in the futures. This created a strong opening on Friday morning, and a strong close as well (just in case a phase 1 trade deal is signed over the weekend, since we are -- again and again -- very close!). Although the analogy is not perfect, does that remind you of one of Aesop’s fables?
In any case, do algos have their limits, or will this keep up until a (minor) agreement is actually finalized! And then what? Old time technical analysts did not have the algo problem. Today’s will just have to patiently wait for the final arbiter to decide when enough is enough – the stock market itself! My guess is that we should not have to wait too long!
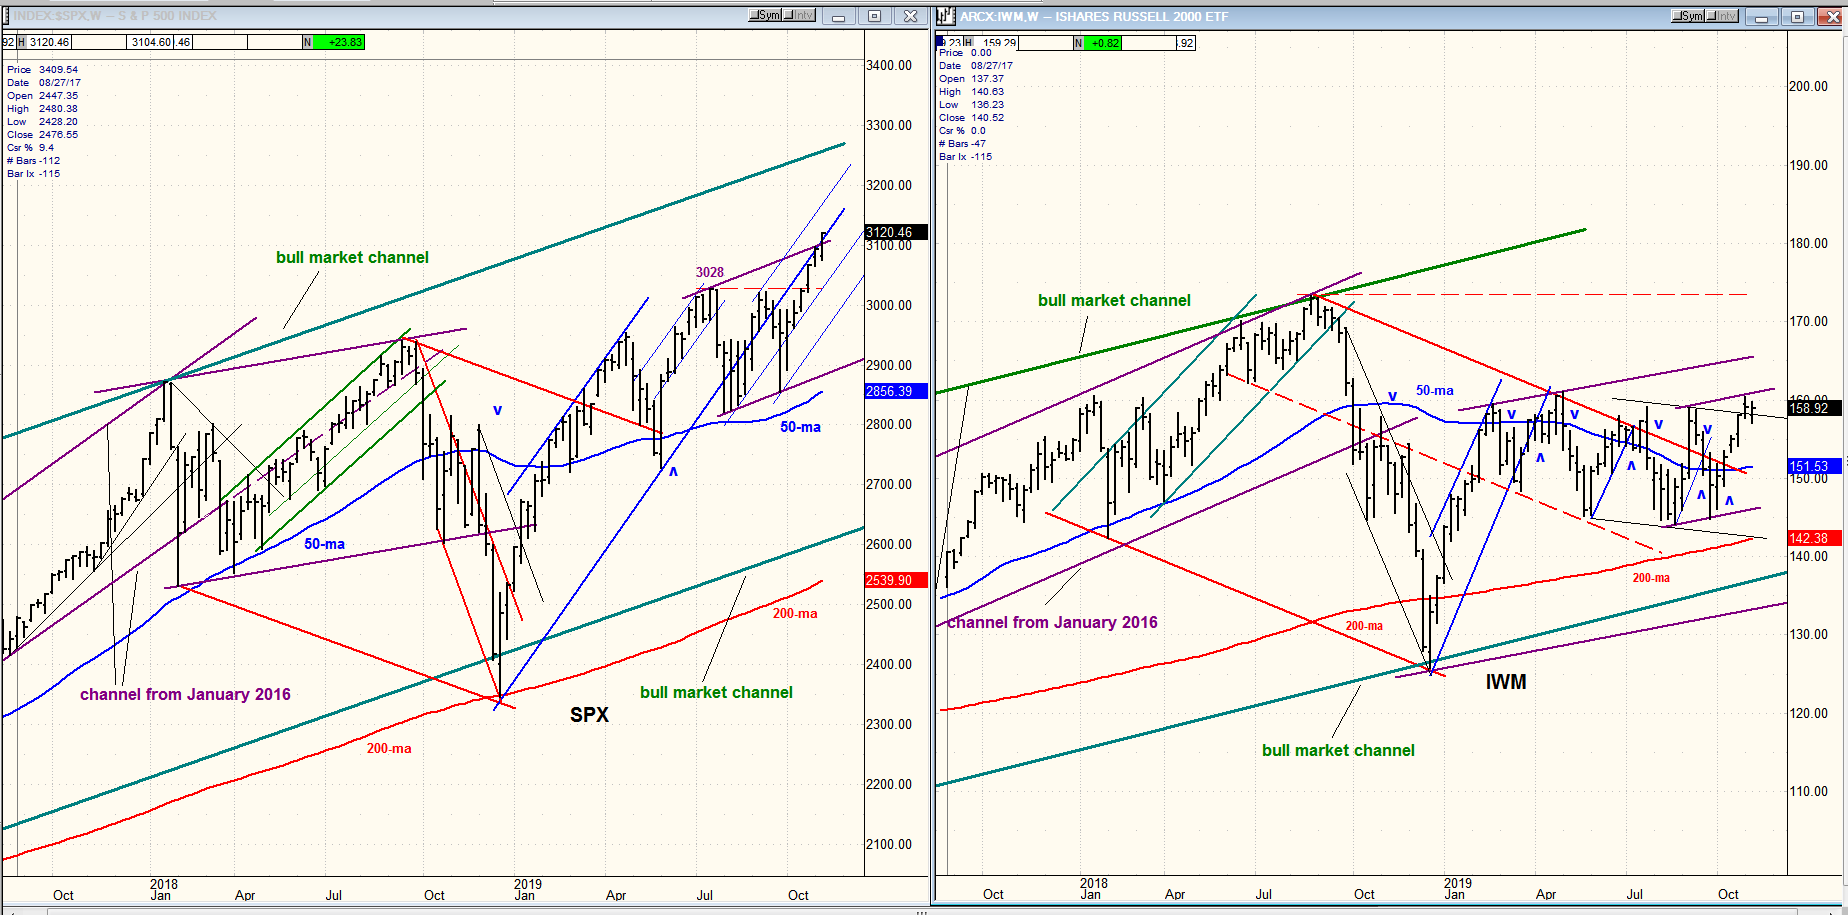
On the weekly chart, SPX seems to be overcoming some potential resistance, but the strength of the entire move from 2856 is less surprising if we consider that this was most likely the low of the 40-wk cycle.
Market Analysis (All charts are courtesy of QChart)
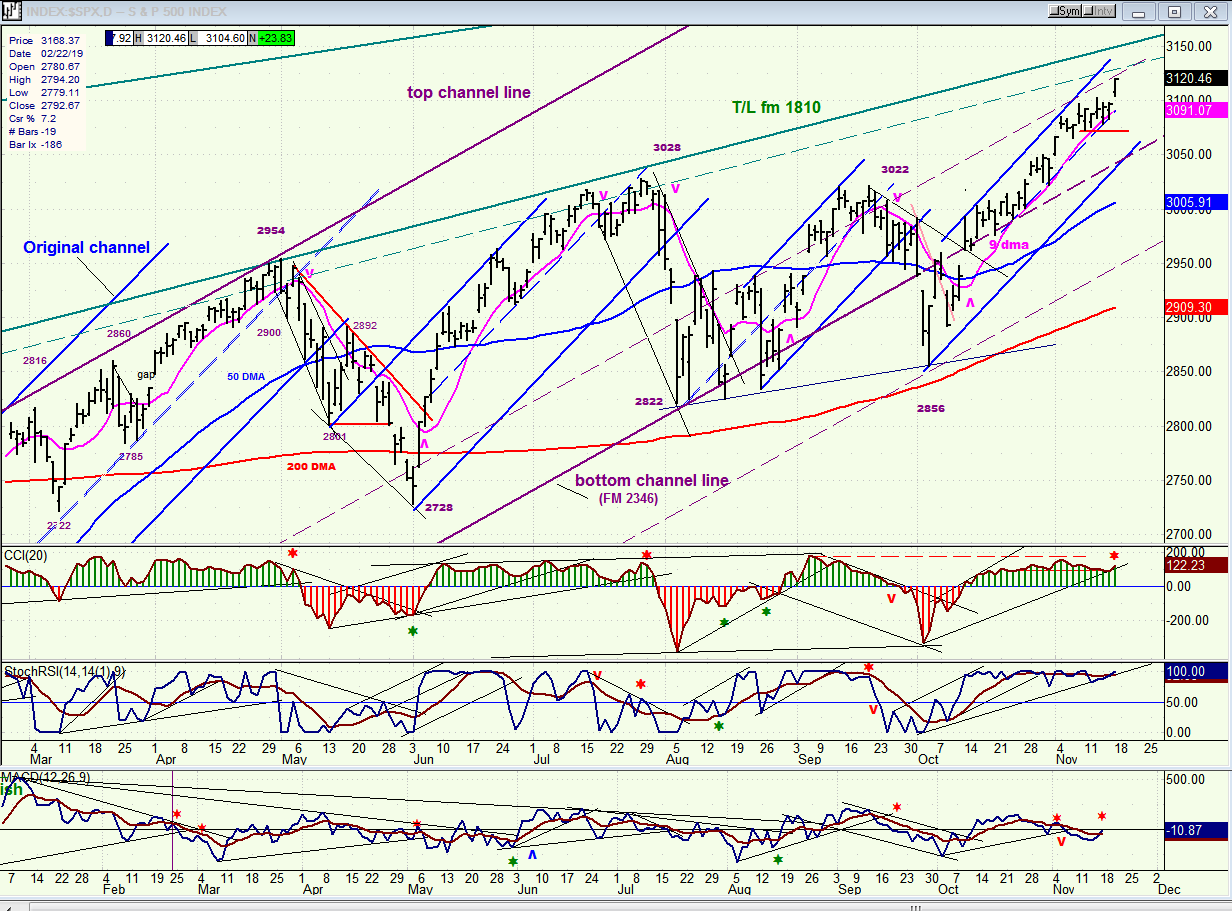
SPX daily chart
Since 2856 SPX has been rising in the top half of a short-term channel, one of three which have channel lines parallel to the original channel from 2346. The previous two came to an end soon after price moved into the lower half of the channel so that, considering the present state of the market (as described above), we should probably expect the same outcome with the current uptrend. By Thursday, we seemed ready to do just that, but another wave of buying appeared which took the index -- as well as most other major ones -- to a new all-time high. The only exception was the NYSE composite index which has yet to exceed its January 2018 high.
Considering the current market condition, we could almost consider Friday’s move a technical aberration, especially if the move comes to an end and reverses quickly; unless, of course, we just keep on going, which would have me scratch my head in disbelief. But, as previously mentioned, we need to let the market decide when to call it quits and not jump the gun.
Negative divergence continues to show despite Friday’s exuberance.
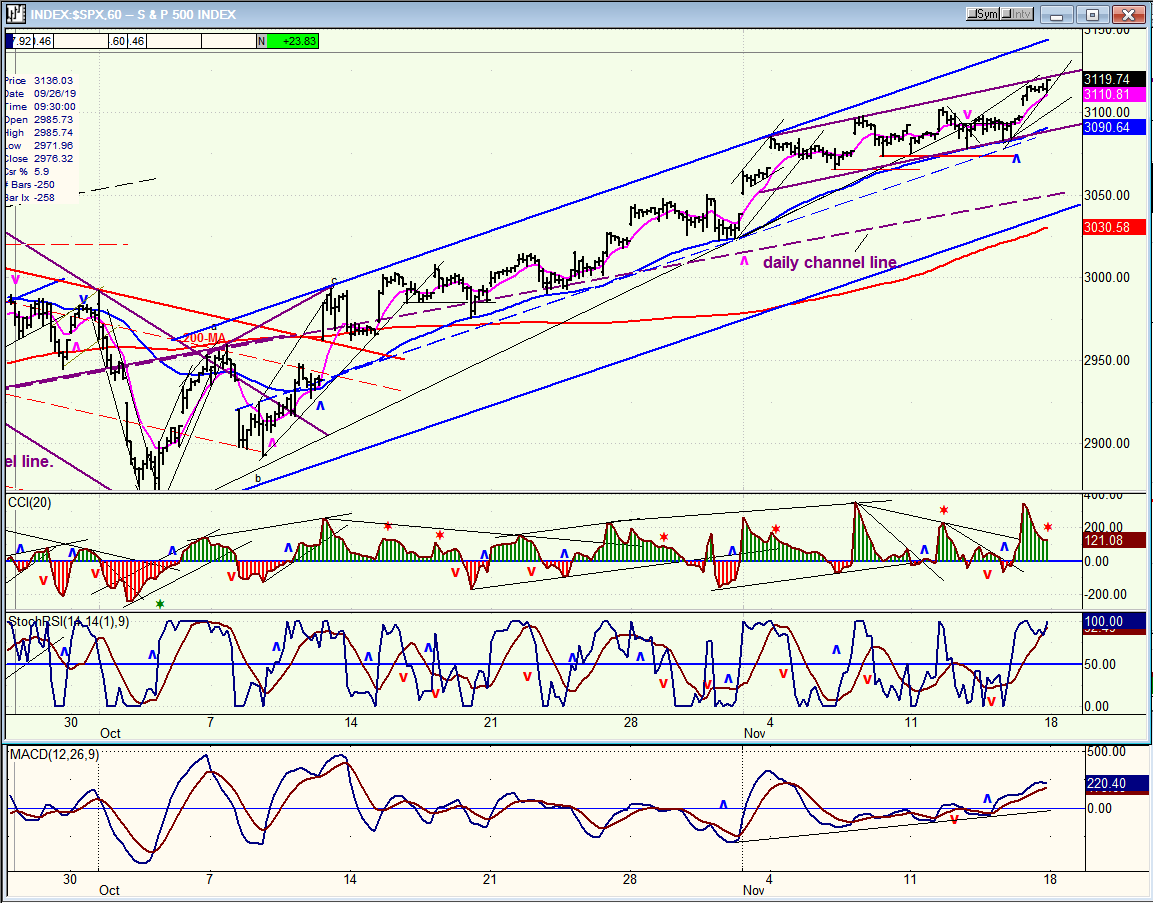
SPX hourly chart
On the 60m chart we can better see the deceleration which is taking place at the top of the trend from 2856. After touching the top trend line for the last time at the beginning of the month, prices started moving away from it with each successive high, forming a narrow distribution channel with the 50-hr MA acting as the bottom trend line for the past week or so. Had we not gotten that little bullish trade news Thursday night, we would probably… Well this is not what happened, so we must pay close attention to what comes next.
This market will have to completely change its spots to move much higher, but that does not exclude some additional price appreciation to conclude that little end-of-the-week surge which, by the way, does not show as very aggressive buying on the A-Ds. A net difference of 722 is not representative of a 24-point move for the day. Perhaps that concluding push was the result of options expiration.
Some not very reliable negative divergence shows on the CCI and we’ll just have to wait until we see Monday’s action to get a better feel for what is to follow.
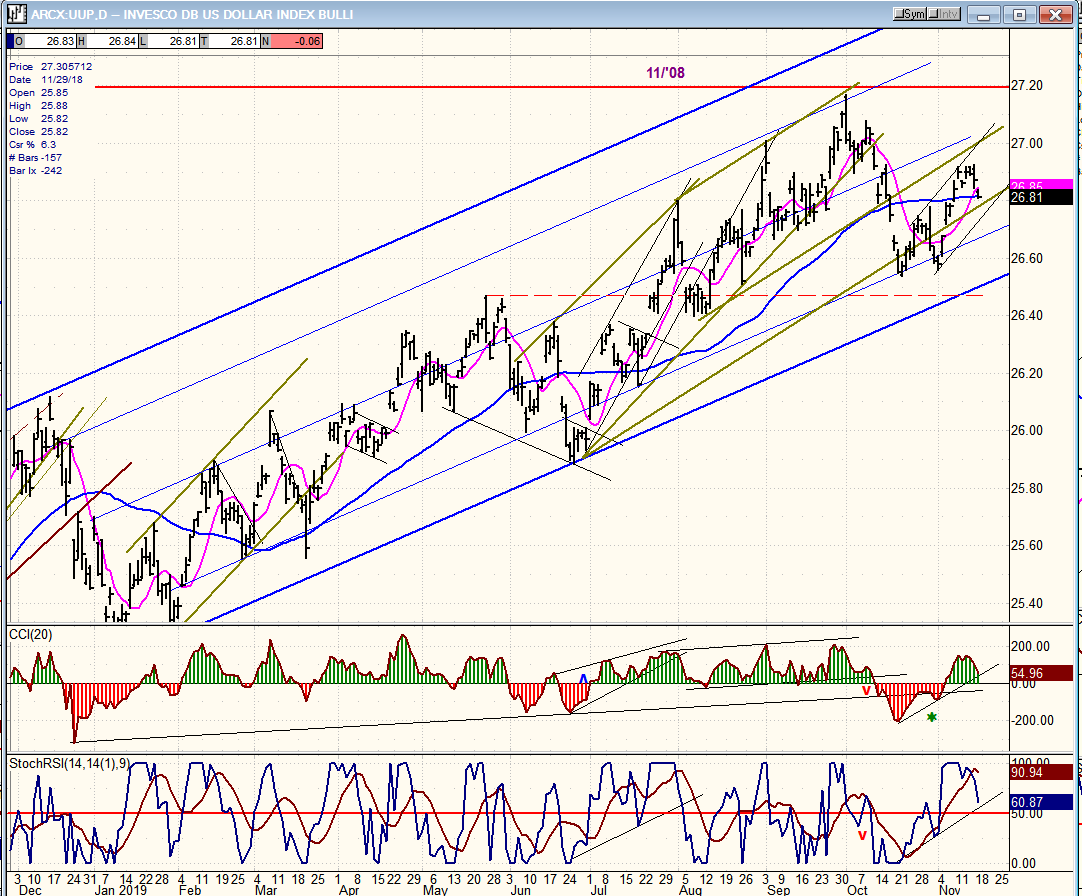
UUP (dollar ETF) daily
UUP has started a correction, but the degree of its magnitude is not yet determined. The key to its definition will be whether or not it breaks out of the blue channel, which could signal the start of an intermediate correction.
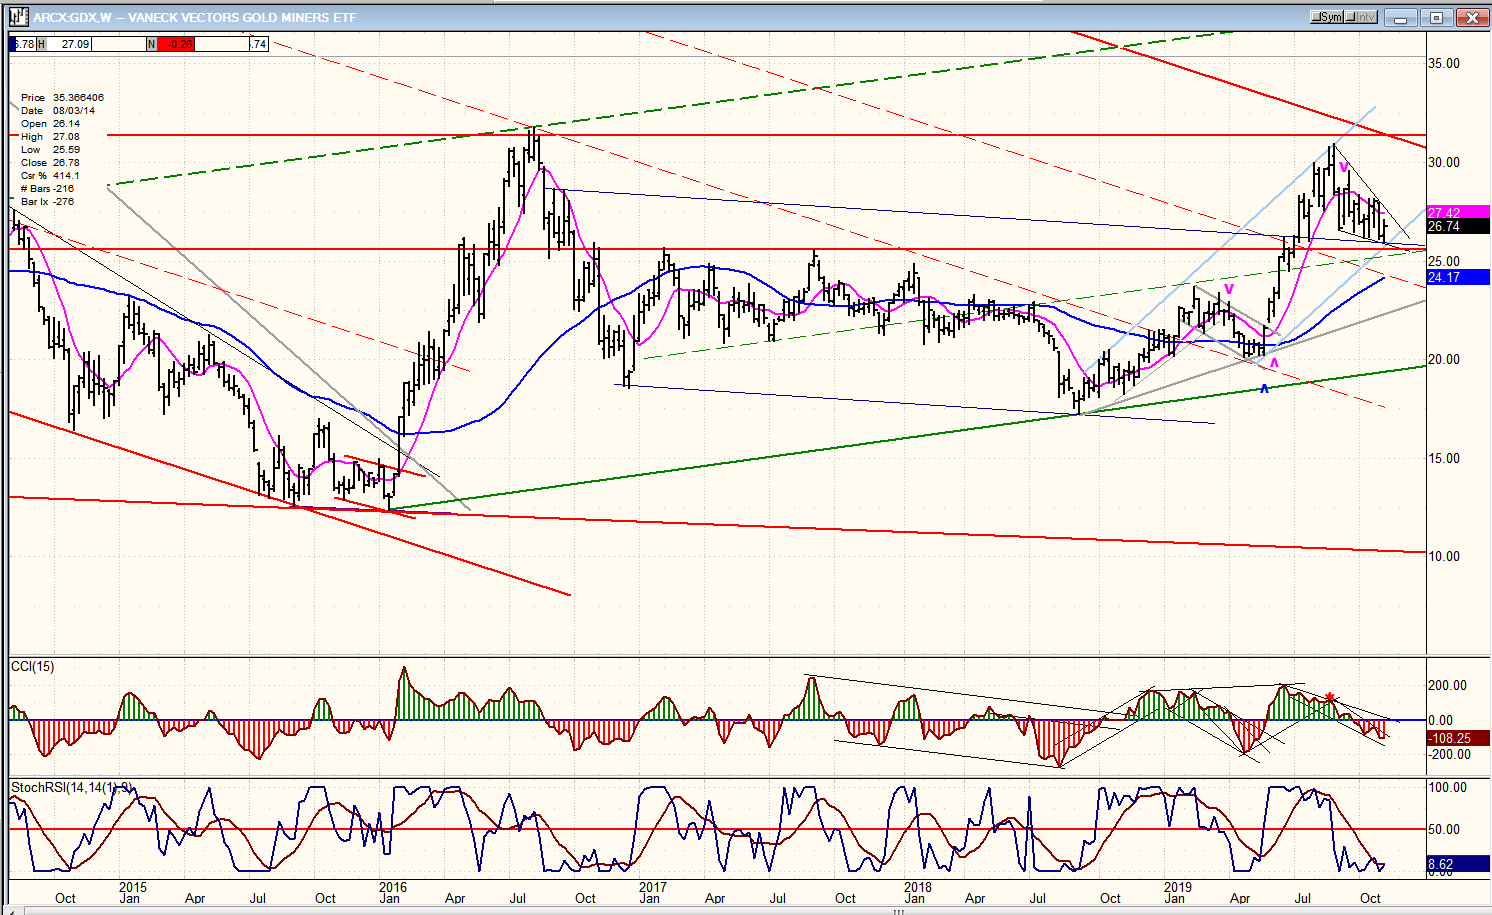
GDX (Gold miners ETF) weekly
The weekly chart shows that between late 2015 and mid 2019 GDX created a base which is capable of supporting a move far higher than has already occurred. To confirm this, it will have to get above the horizontal red line which is drawn across the previous 31.64 top. This would also put it outside of the broad corrective channel which formed after the 2011 peak . The current pattern looks positive and has strong support starting at 25.50. Reaching down to that level would also complete a 50% retracement of the previous uptrend. Holding the current correction to this parameter, and reversing would potentially be bullish short to intermediate term.
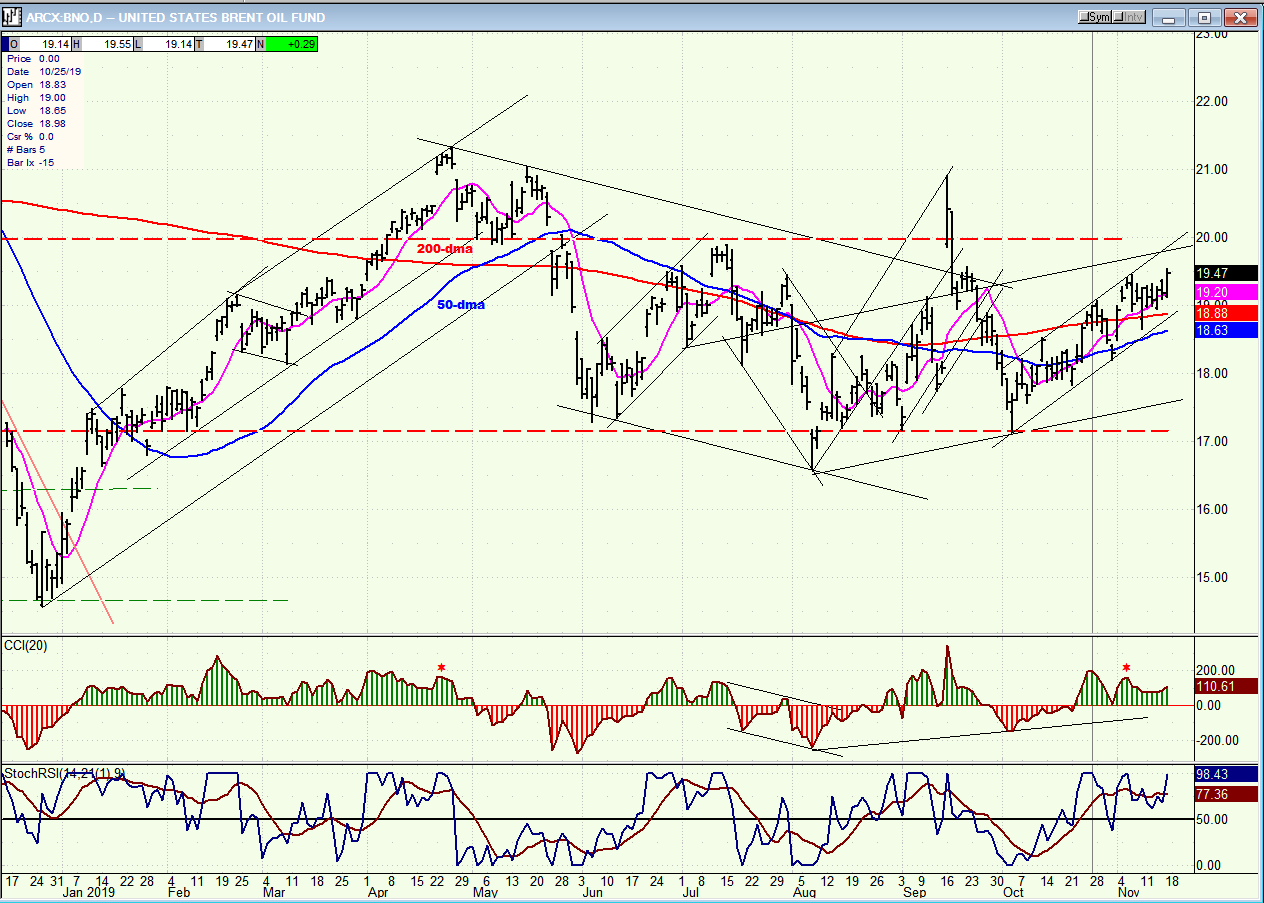
BNO (U.S. Brent oil fund) daily
Continued strength in the market has been favorable for BNO. This will end when the market begins to correct.
Summary
The continued advance in SPX is at least partially due to the recent bottoming of the 40-wk cycle. However, other cycles which are currently peaking are expected to neutralize its strength and become the dominant factor in the market’s future direction.
FREE TRIAL SUBSCRIPTON
With a trial subscription, you will have access to the same information that is given to paid subscribers, but for a limited time period. I think you will find that knowing how far a move can carry is one of the most useful benefits of this service, whether you are a trader or an investor -- especially when this price target is confirmed by reliable indicators which give advance warning of a market top or bottom. Furthermore, cycle analysis adds the all- important time element to the above price projections. For a FREE 4-week trial, further subscription options, payment plans, and for general information, I encourage you to visit my website at www.marketurningpoints.com.
The above comments about the financial markets are based purely on what I consider to be sound technical analysis principles. They represent my own opinion and are not meant to be construed as trading or investment advice, but are offered as an analytical point of view which might be of interest to those who follow stock market cycles and technical analysis.
********

When Andre Gratian was a stock broker years ago, a friend introduced him to technical analysis of the market. Consequently, it is not an exaggeration to say that Andre fell in love with this approach! Ever since then, it has become an increasingly important part of his professional life. Gratian has studied the works of Wyckoff, Edwards & Magee, Edward J. Dewey (cycles) and many others. However, one of my most profitable undertaking has probably been to study Point & Figure charting, which he finds invaluable in analyzing stocks and indices. If he were restricted to one methodology, this is the one that he would choose. This well-rounded background has given him what he feels to be a special insight into the stock market, facilitating the recognition of meaningful patterns and the ‘turning points’ in all trends, whether they be short or long term. Andre feels very comfortable discussing the stock market and passing on meaningful information to others. His subscribers include individuals and money managers throughout the world. Moreover, his Newsletters are currently published on several financial sites, here and abroad.
More from Gold-Eagle


