Technical Analysis Of The Markets


Current Position of the Market
SPX: Long-term trend – There are no clear signs that the bull market is over.
Intermediate trend – Most likely building an intermediate top.
Analysis of the short-term trend is done on a daily basis with the help of hourly charts. It is an important adjunct to the analysis of daily and weekly charts which discusses the course of longer market trends.
Where Are We?
Market Overview
Long-term trend: The bull market which started in 03/09 shows no sign of having run its course. A rough count taken on the long-term Point & Figure chart gives us a potential target of 3680+. A few weeks ago, it was not clear if structurally, SPX would retest its 12/18 low of 2346 or even surpass it before making a new high, but recent action appears to have eliminated this possibility. In EWT parlance, this means that 2346 was most likely wave 4 of the bull market and not just wave-A of 4, and that it was also the beginning of the final wave 5 of the bull market which has higher to go before coming to an end.
Intermediate trend: Based again on the long-term P&F chart, if 3160-3180 fails to bring about an intermediate top (likely), we could see the index run up to ~3240 after a minor correction has taken place.
Short-term trend: The count for the current bullish phase taken on the long-term P&F chart called for ~3180, a pause, and then 3240. Refined with a short-term P&F chart, we could see the first top at 3150-3160. That was the high achieved on Wednesday.
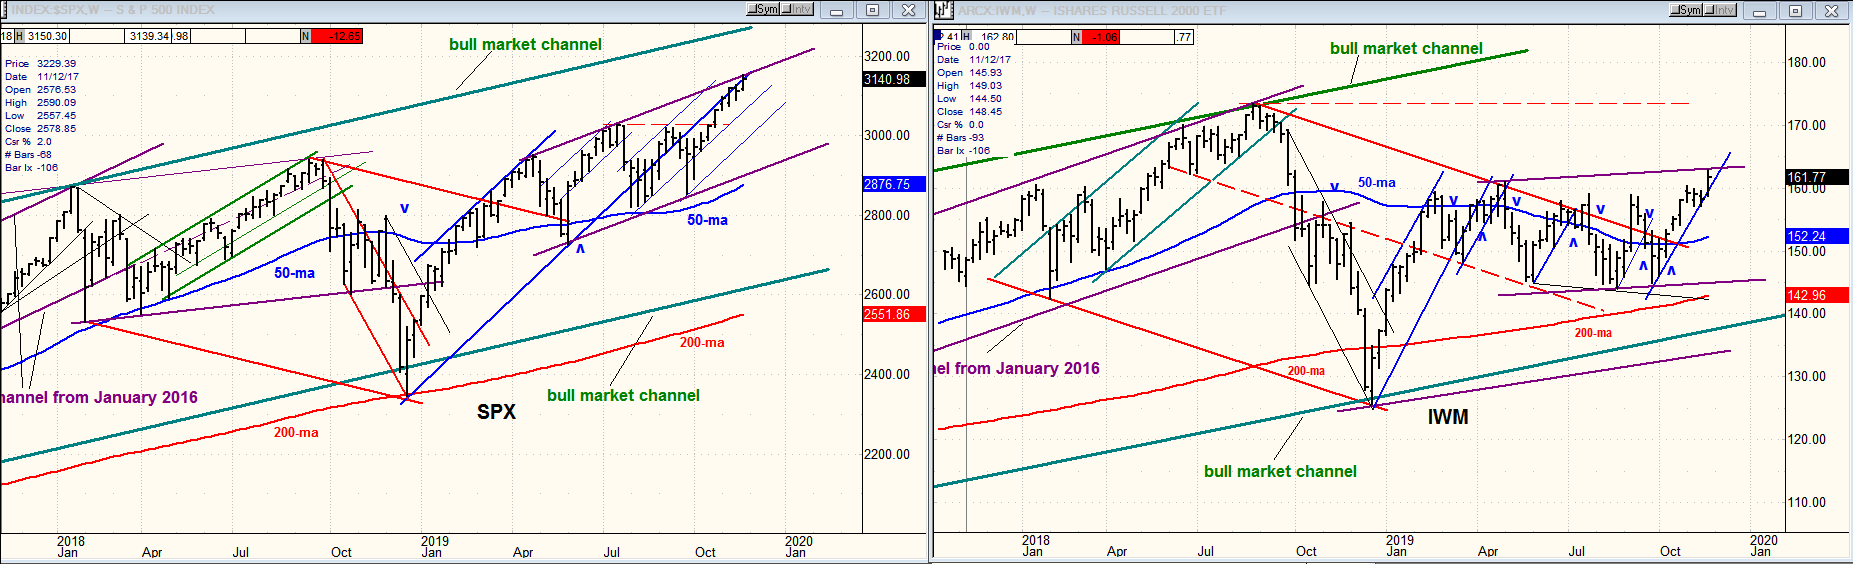
Neither SPX, nor IWM is showing signs of an important top forming at the weekly level. Last week, both made new 2019 highs. For the SPX this is also a new all-time high, but nothing has changed in the relative strength between the two. Longer-term, IWM is still relatively weaker than SPX by a wide margin. Apparently, this has no short-term import; but an increase in the IWM relative weakness could precede an intermediate term reversal.
Market Analysis (All charts are courtesy of QChart)
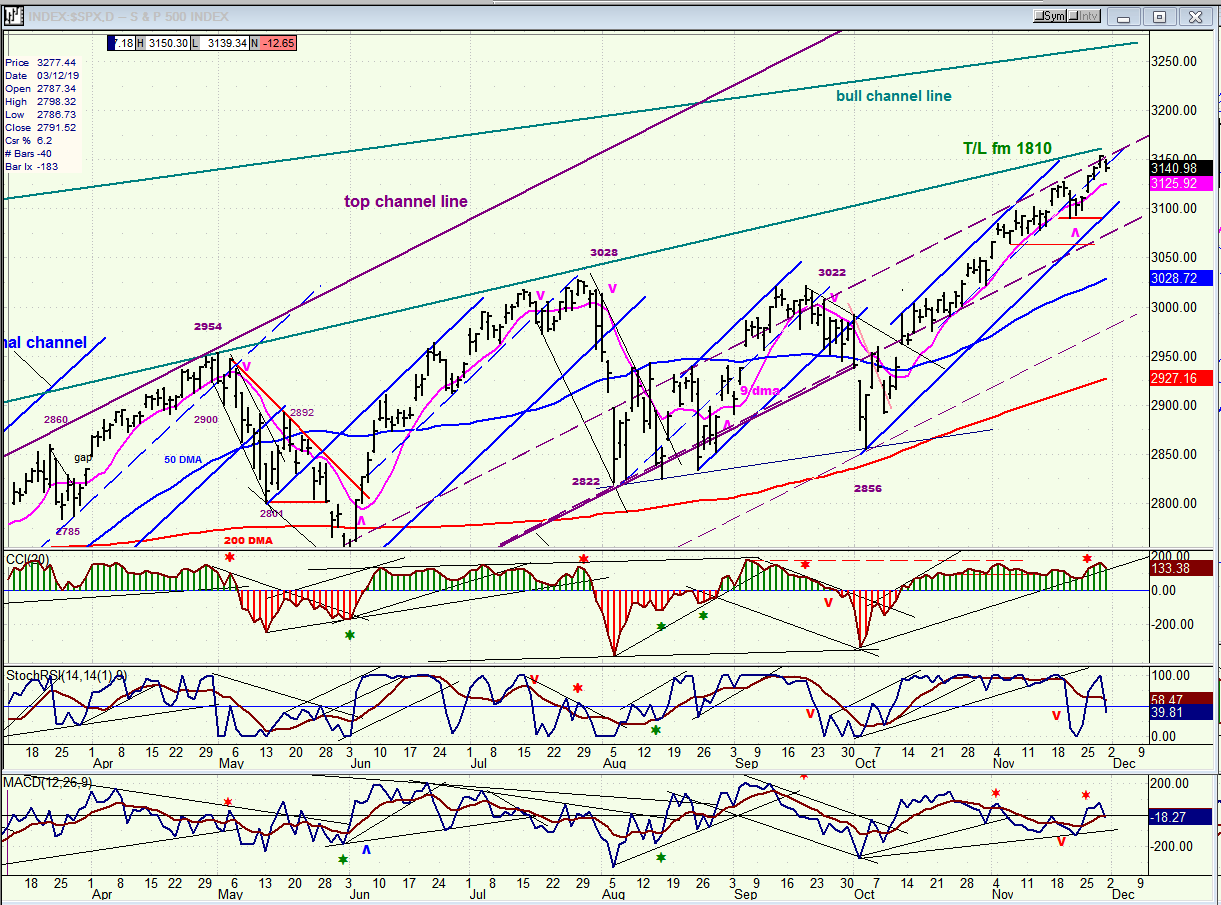
SPX daily chart
SPX made a new high last week but hit resistance from a couple of trend lines which pushed it back down on Friday. This has caused additional deceleration to the trend from 2856, as well as another close slightly below the dashed mid-channel line which could lead to additional weakness over the next few days. As long as it remains above 2990, SPX remains in a short-term uptrend. The entire pattern is very similar to that of the short-term uptrend from early June whereby the first break of the blue dashed line was followed by one more little up-wave which led to a short-term reversal when prices turned down again. This is what happened on Friday, but we will need some follow-through to the downside to start a downtrend.
There are several technical reasons to believe that we are in a reversal area for a minor top but we will need confirmation that this is the case. Last week I mentioned that we could get either a retest of that high, or possibly a new high. With that out of the way we now have a chance to decline into the cycle low due in the first half on December.
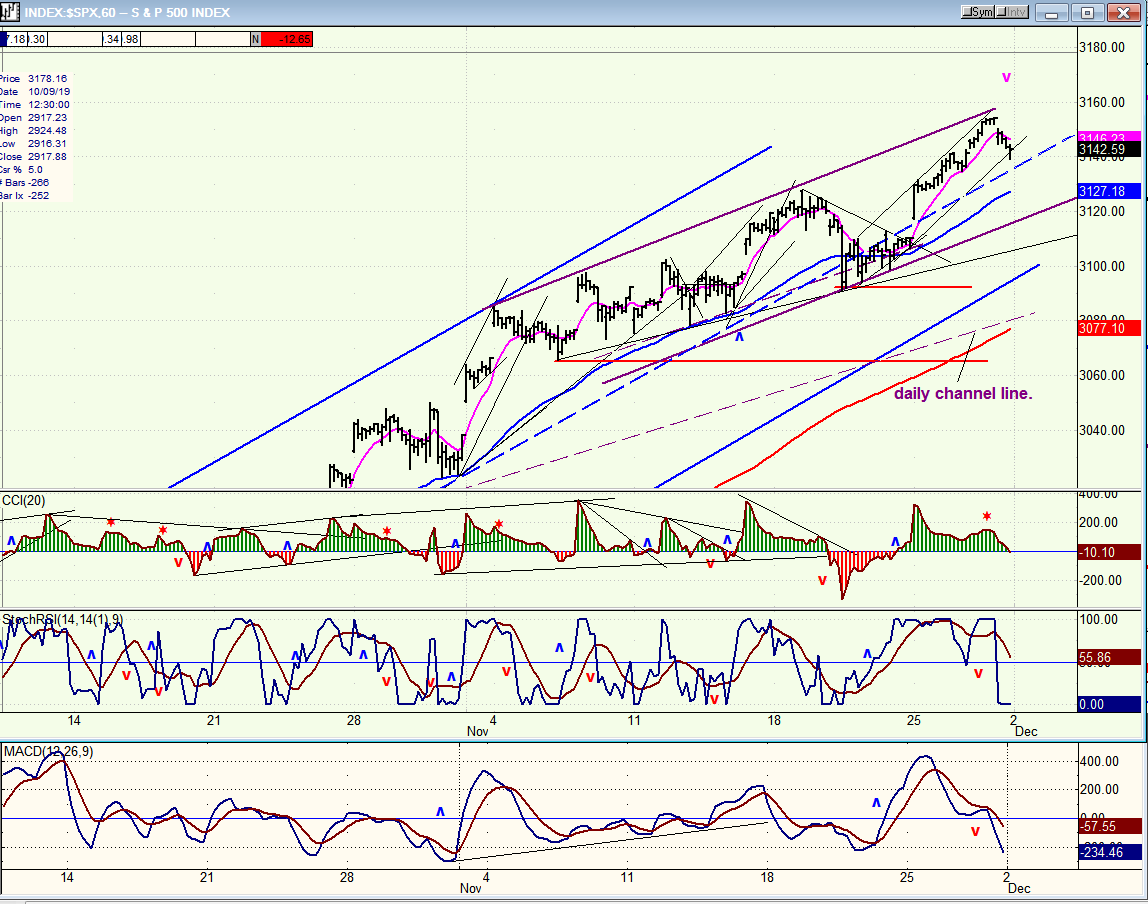
SPX hourly chart
P&F projections are not always exact, but they are usually pretty accurate. This is why the short-term target of 3150-3160 which was reached on Wednesday and followed by a pull-back on Friday may very well indicate that a pause in the uptrend has started. If that pull-back extends below 3125, we have a short-term top in place!
It is too soon to obtain a target from the P&F chart. However, Fibonacci retracement levels for the recent uptrend from 2856 can be useful as a substitute. If a short-term correction has started, it would be normal for the index to decline to about 3035 (.382) or even 2998 (.50).
With Friday’s close, the lower two indicators have given a strong sell signal, but the upper CCI has barely dipped into the red. A little more weakness that pushes beyond the blue 50hr MA would give us the confirmation we need.
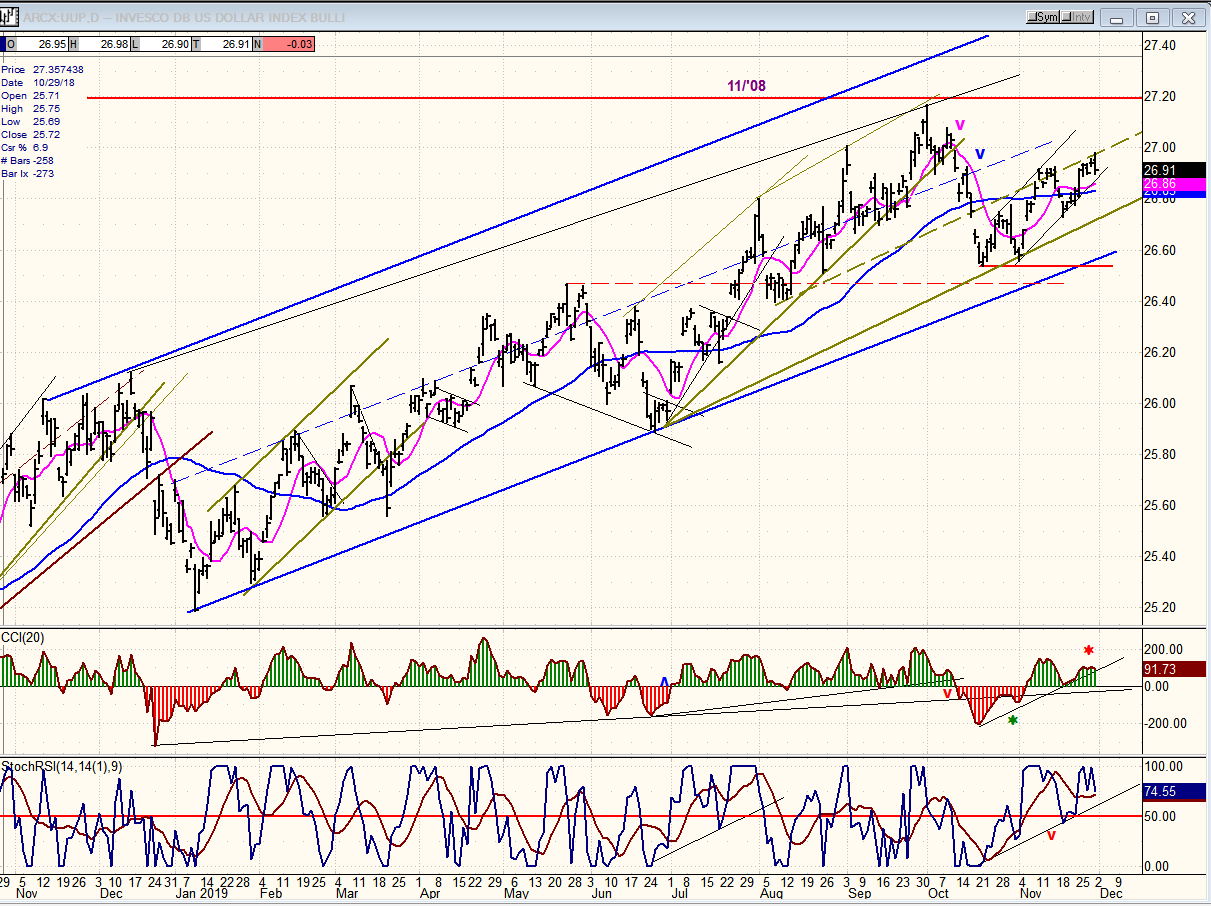
UUP (dollar ETF) daily
UUP turned down on Friday. If this is the end of the move from 10/21, the next decline could challenge the lower blue channel line. A close below 2675 would enhance that possibility.
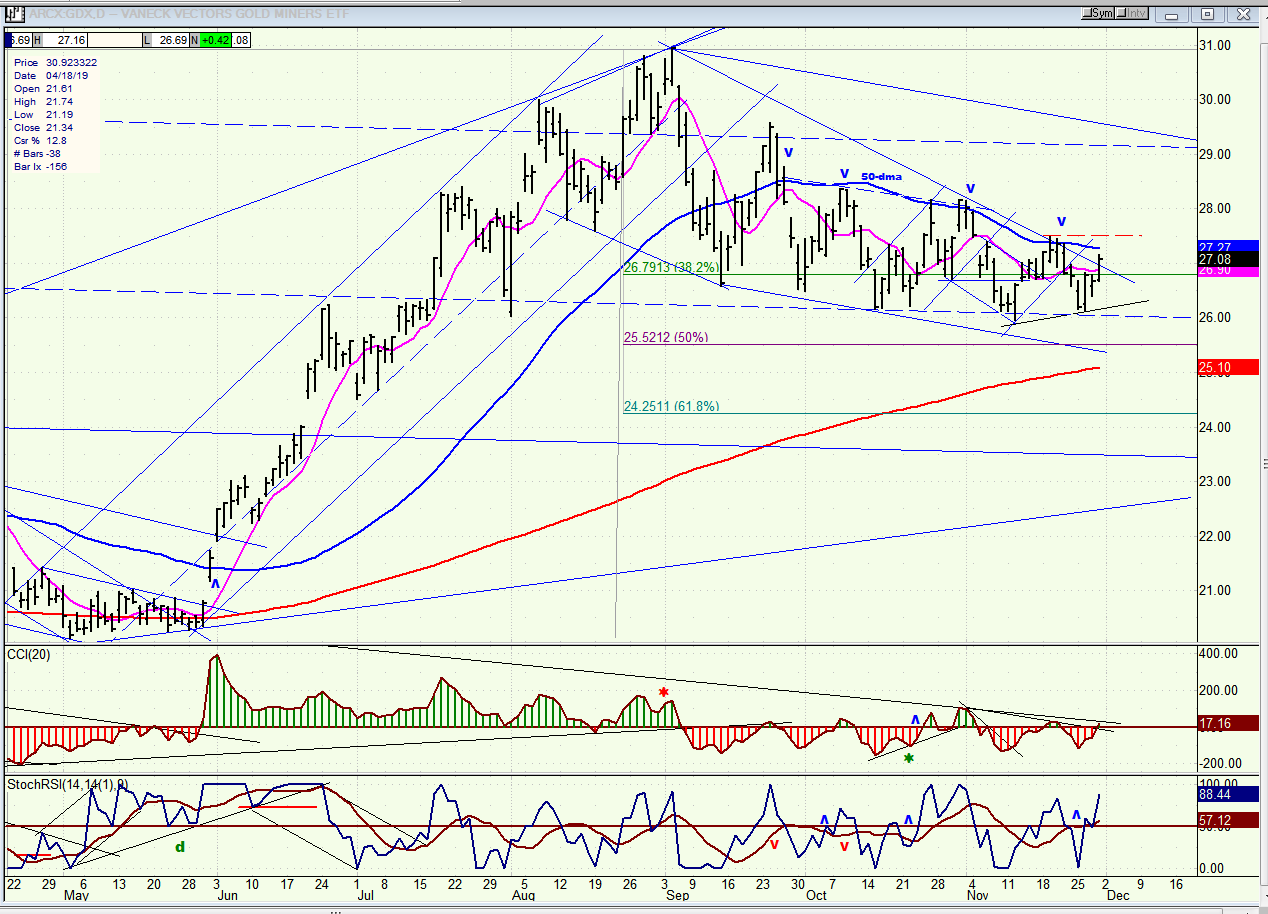
GDX (Gold miners ETF) weekly
GDX may have completed its correction with a successful retest of the 25.98 low. If the budding uptrend can take it beyond
27.50, it could mark the start of a new bullish phase aiming to complete the small base count to 33.50-34.50.
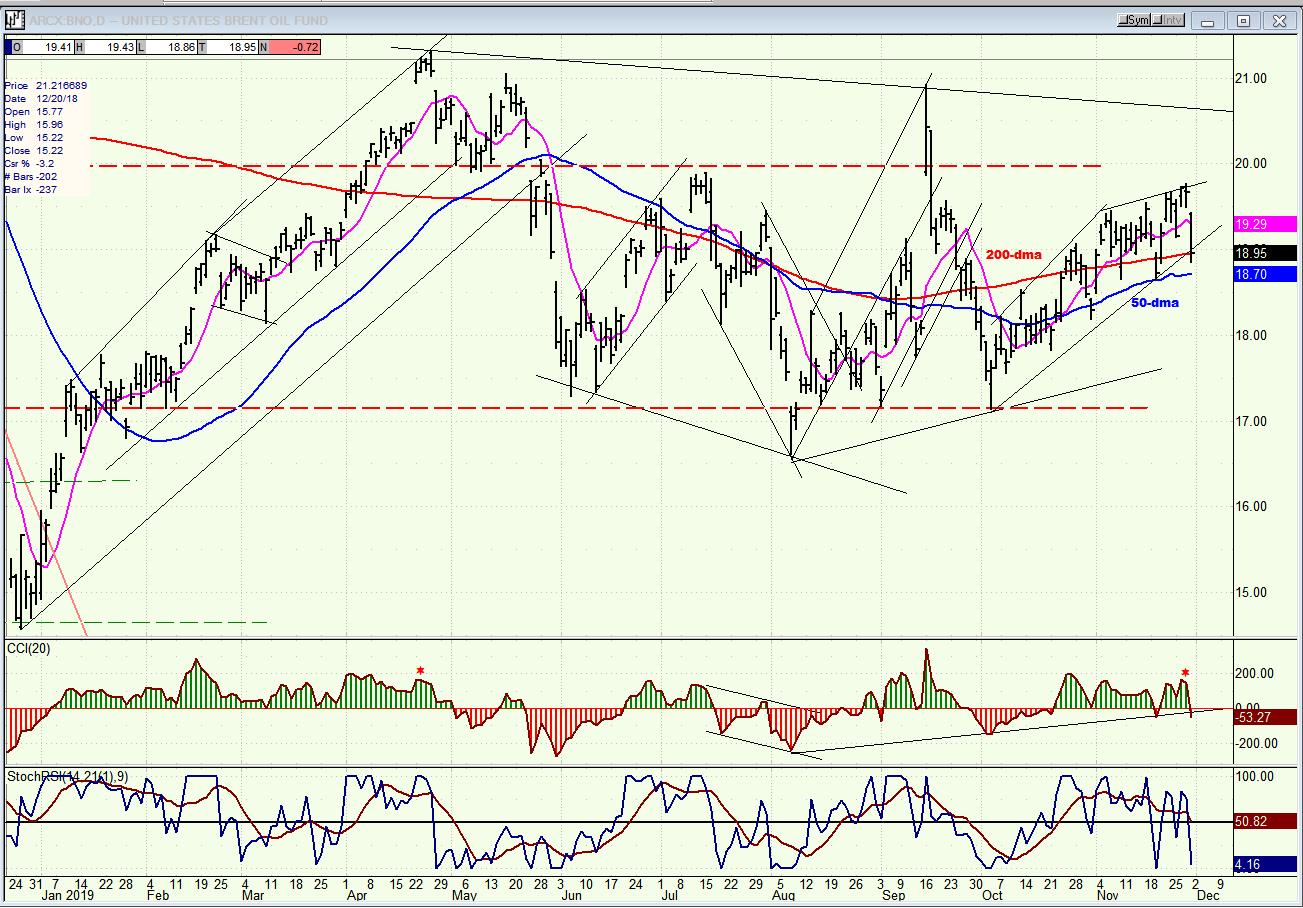
BNO (U.S. Brent oil fund) daily
Last week, I suspected that BNO was close to ending its rally from 17.15. Friday’s sharp decline to 18.95 which started with a gap opening looks like the beginning of something important. The fact that it was on light volume could be due to Friday being a shortened session with many traders on a four-day weekend. A move below 18.50 would be a bigger negative.
Summary
A short-term top may have been reached last Wednesday. If so, a near-term correction to about 3035- is a good possibility.
FREE TRIAL SUBSCRIPTON
With a trial subscription, you will have access to the same information that is given to paid subscribers, but for a limited time period. I think you will find that knowing how far a move can carry is one of the most useful benefits of this service, whether you are a trader or an investor -- especially when this price target is confirmed by reliable indicators which give advance warning of a market top or bottom. Furthermore, cycle analysis adds the all- important time element to the above price projections. For a FREE 4-week trial, further subscription options, payment plans, and for general information, I encourage you to visit my website at www.marketurningpoints.com.
The above comments about the financial markets are based purely on what I consider to be sound technical analysis principles. They represent my own opinion and are not meant to be construed as trading or investment advice, but are offered as an analytical point of view which might be of interest to those who follow stock market cycles and technical analysis.
********

When Andre Gratian was a stock broker years ago, a friend introduced him to technical analysis of the market. Consequently, it is not an exaggeration to say that Andre fell in love with this approach! Ever since then, it has become an increasingly important part of his professional life. Gratian has studied the works of Wyckoff, Edwards & Magee, Edward J. Dewey (cycles) and many others. However, one of my most profitable undertaking has probably been to study Point & Figure charting, which he finds invaluable in analyzing stocks and indices. If he were restricted to one methodology, this is the one that he would choose. This well-rounded background has given him what he feels to be a special insight into the stock market, facilitating the recognition of meaningful patterns and the ‘turning points’ in all trends, whether they be short or long term. Andre feels very comfortable discussing the stock market and passing on meaningful information to others. His subscribers include individuals and money managers throughout the world. Moreover, his Newsletters are currently published on several financial sites, here and abroad.


