Technical Analysis Of The Markets


Current Position of the Market
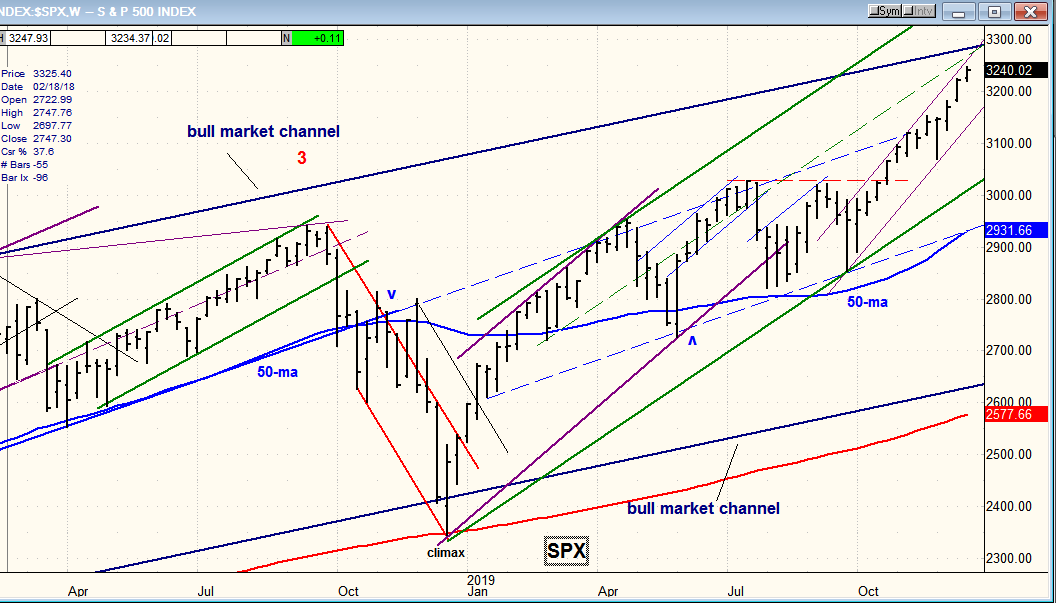
SPX: Long-term trend – There are no signs that the bull market is over.
Intermediate trend – Most likely near an intermediate top.
Analysis of the short-term trend is done on a daily the help of hourly charts. It is an important adjunct to the analysis of daily and weekly charts which discusses the course of longer market trends.
Market Review
Point & Figure Overview of SPX
Long-term trend: The bull market which started in 03/09 shows no sign of having run its course. A rough count taken on the long-term Point & Figure chart gives us a potential target to as high as 4080. P&F does not predict time, only price. (no change)
Intermediate trend: The 3240 target was met on Friday 12/27/19. If it is valid for bringing a top of intermediate proportion, we should now see some congestion (distribution) form in this area.
Market Analysis (All charts are courtesy of QChart)
SPX-IWM weekly charts
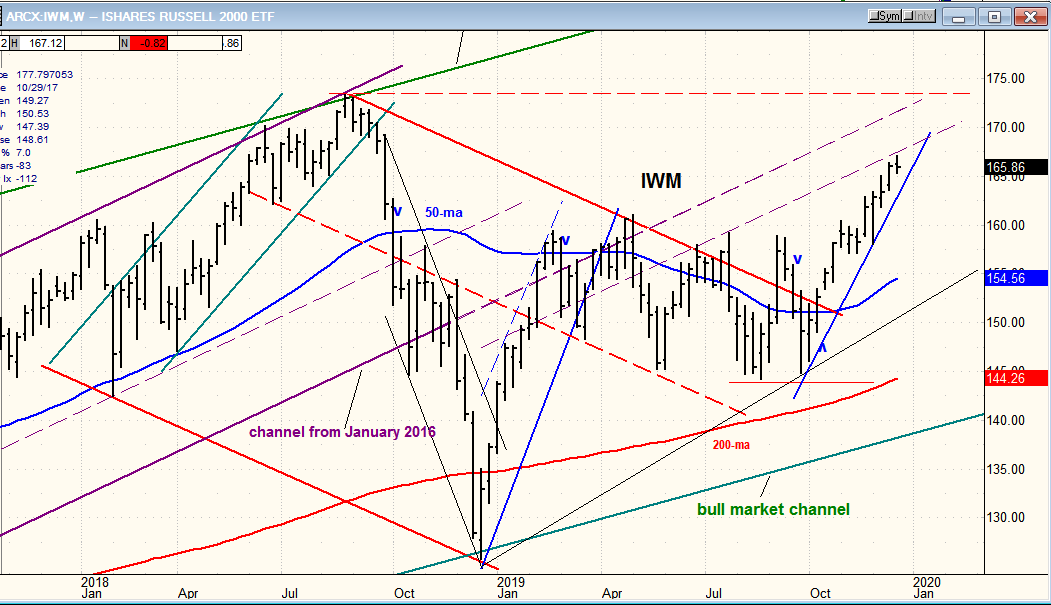
Another weekly high for both indexes and another all-time high for SPX which reached the 3240 P&F projection. It now has a fair chance of ushering in an intermediate high which, based on cycles, could give us a price correction into July 2020, but a valid top will have to be confirmed by the indicators. Since we do not even have an hourly sell signal, we cannot yet be certain that 3240 will be a high point. Based on the long-term P&F chart, 3270-3300 are the next potential price targets if 3240 does not bring a reversal.
If 3240 does bring about a temporary price reversal, we could correct down to the 3025 support level, but we’ll discuss the extent of the correction once we have a confirmed top.
IWM only displayed minor relative weakness at this top. XBD was a little more assertive, but the TRAN has been telling us to expect a correction for some time. All these indexes have often preceded a reversal in the market.
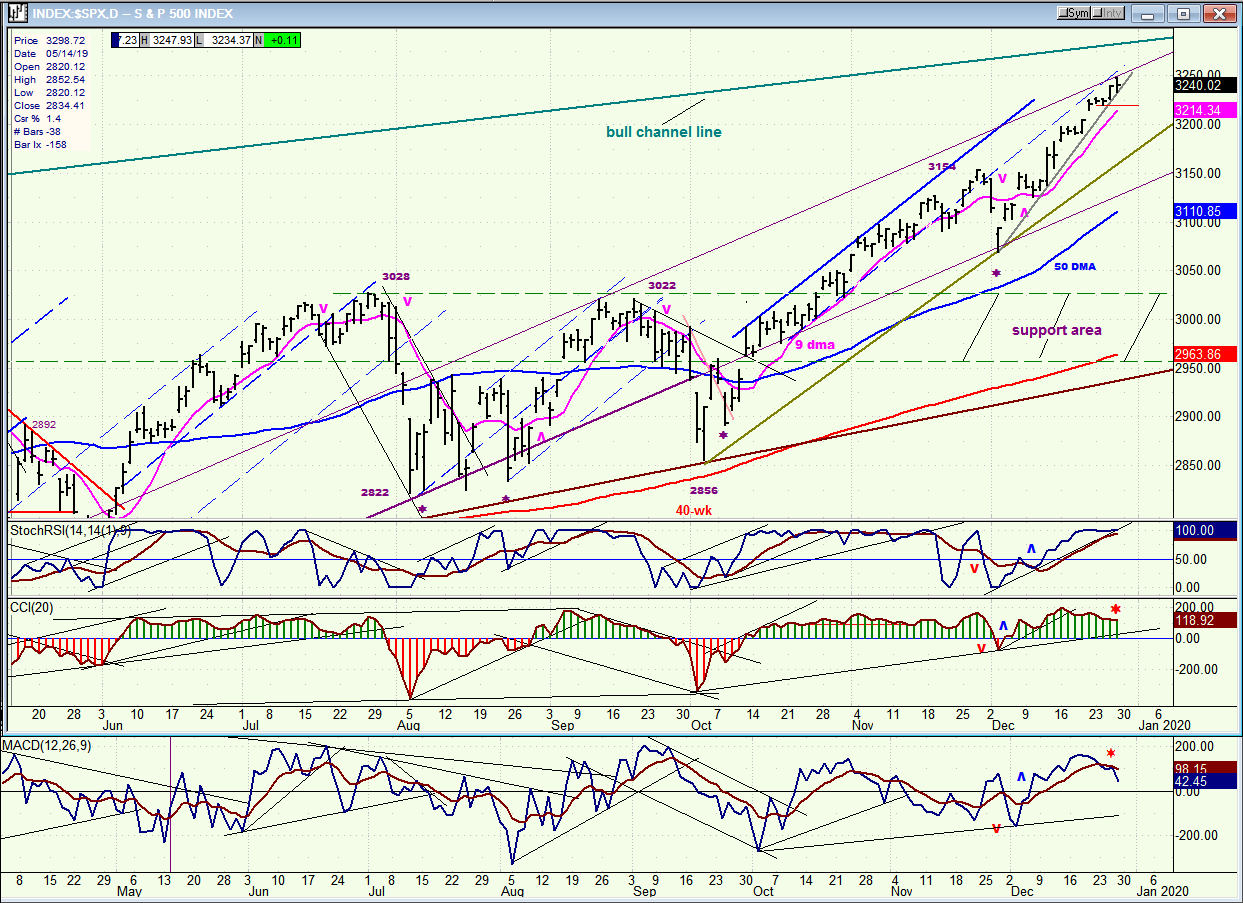
SPX daily chart
Continued strength in the index has taken it within 50 points of its bull market channel top . The low of the channel currently runs at about 2680 -- a reminder that, in spite of its ten-plus years longevity, this bull is still very much alive.
With a high of 3248 on Friday, SPX has slightly exceeded the 3240 P&F projection which is deemed worthy of ending the uptrend from 2856 (ushered in by the 40-wk cycle) and bringing about an intermediate correction. Early signs of a top are appearing in the oscillators in the form of negative divergence, but until we get something more substantial, we cannot be certain that this level will not be exceeded. We do not even see distinct price deceleration in the daily chart.
Friday’s price action does suggest that some decent profit-taking occurred at the day’s high. From 3248, the index corrected 13 points before rebounding into the close while A-Ds ended the day negative. We can best notice the signs of a topping action on the hourly chart (next).
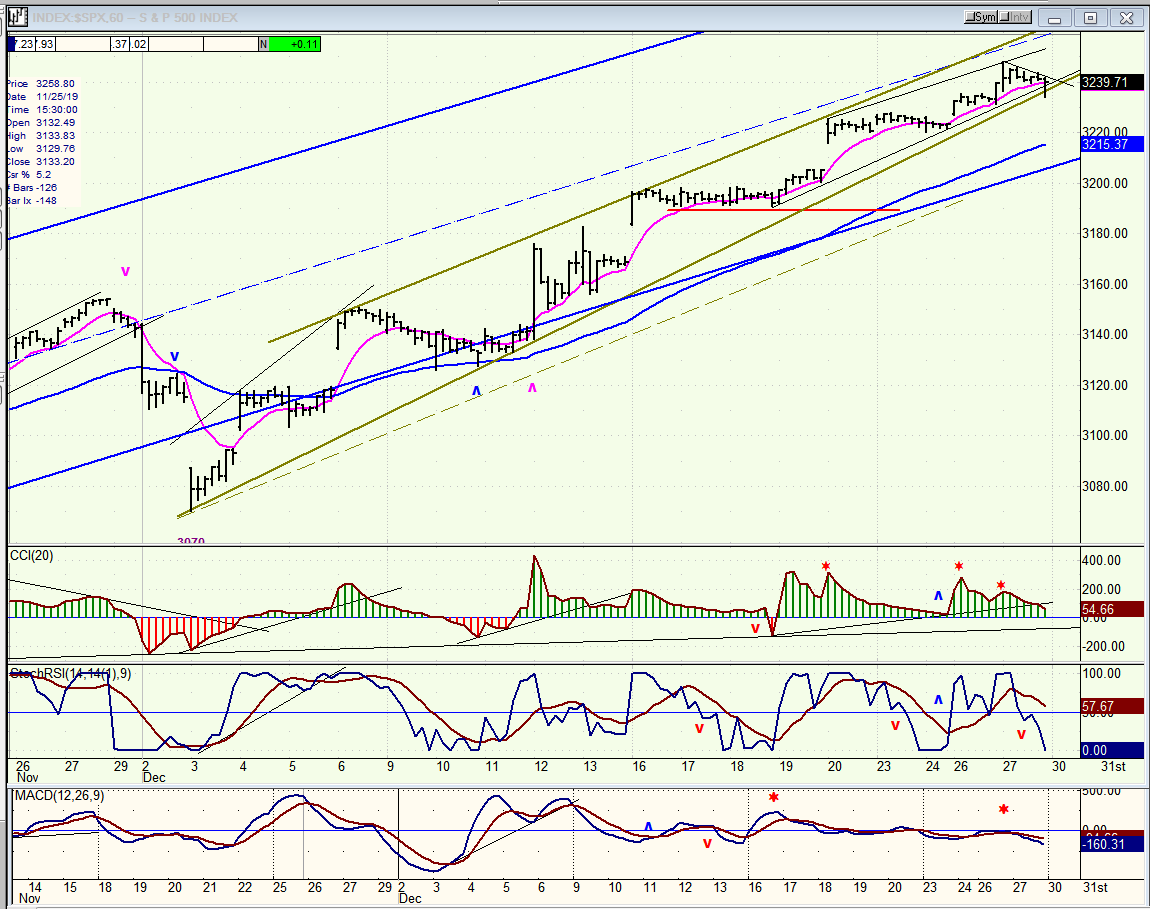
SPX hourly chart
If we are about to reverse the trend from 2856, topping behavior should show far more clearly in the hourly chart, and this is indeed the case.
Here we do see some deceleration and, on Friday, the trend line from 3070 was breached and only saved from being broken by a rally in the last 10 minutes of trading. But most of the evidence is concentrated in the oscillators. Two of them have already given a sell signal while the CCI, which is riddled with negative divergence appears anxious to make it three. However, in order to get a confirmed sell signal which would appear on the daily chart, we would need to close below 3215. That would take SPX below short-term support and give us a pretty good start toward confirming that a correction is taking hold.
A retest of Friday’s high would add to the congestion pattern which has already started on the P&F chart.
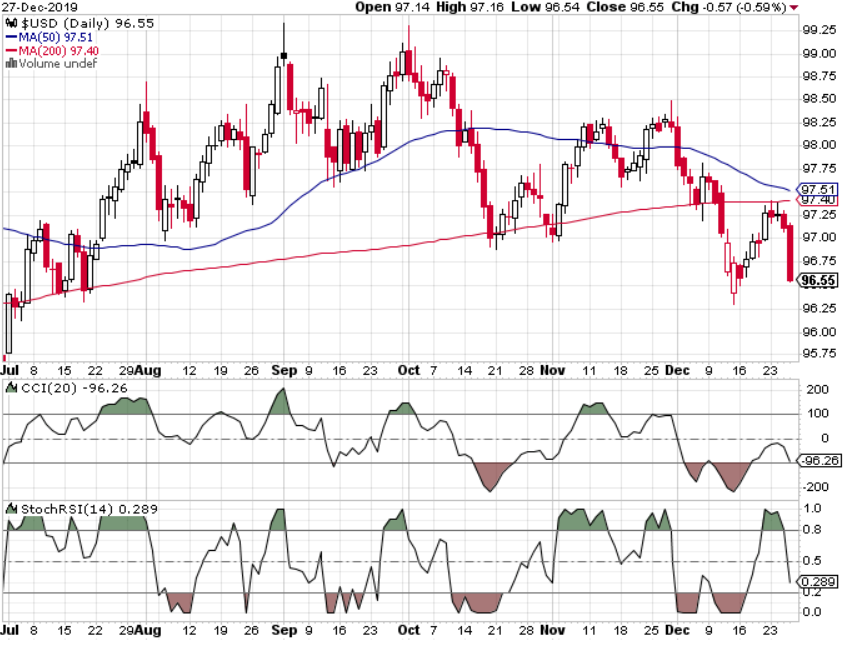
$USD daily (courtesy StockCharts)
The USD has begun to roll over and does not look ready to reverse (right away) the downtrend which it has started. Until we see evidence of a low forming in the indicators and in the price action, USD should keep heading lower over the near-term.
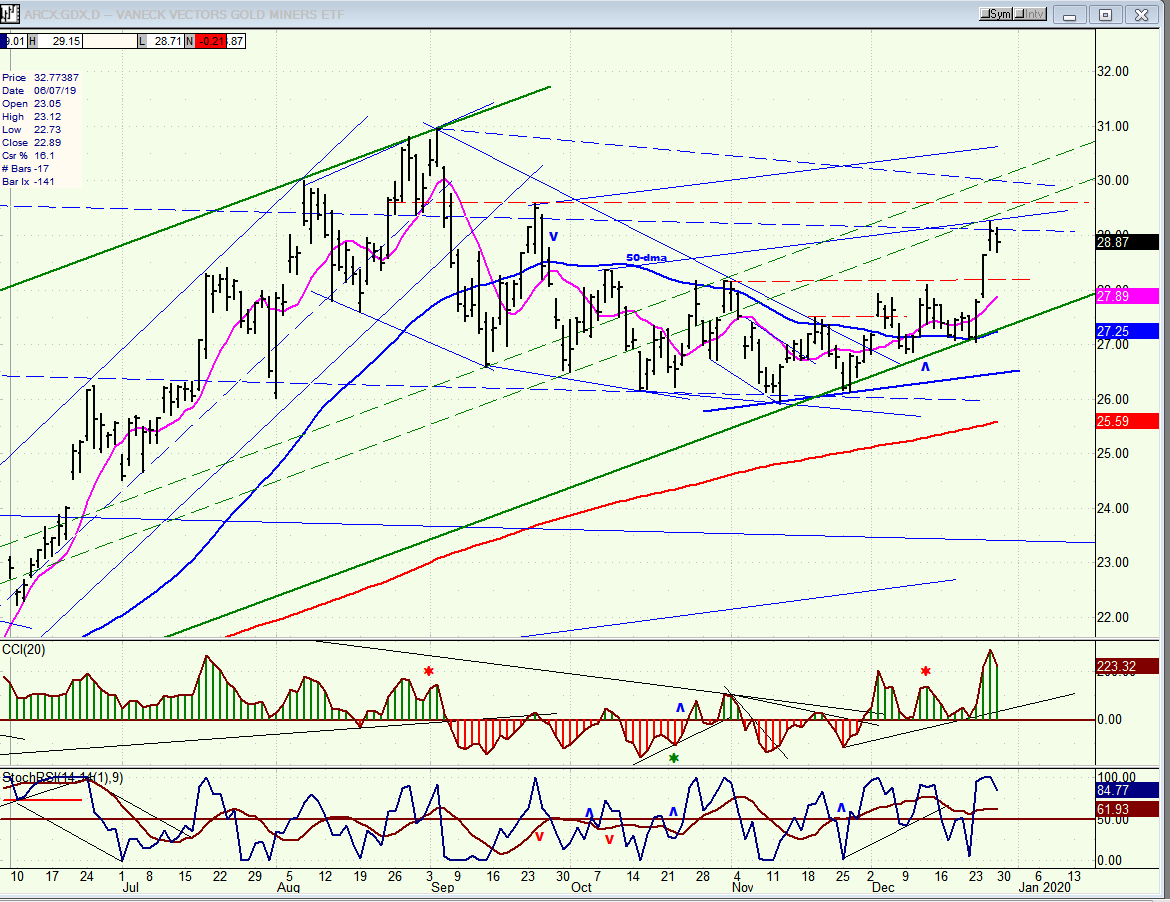
GDX (Gold miners ETF) weekly
GDX has now broken out and should be ready to move higher after a minor correction. Unless serious weakness begins to appear, we can expect the next move to be to ~31.00.
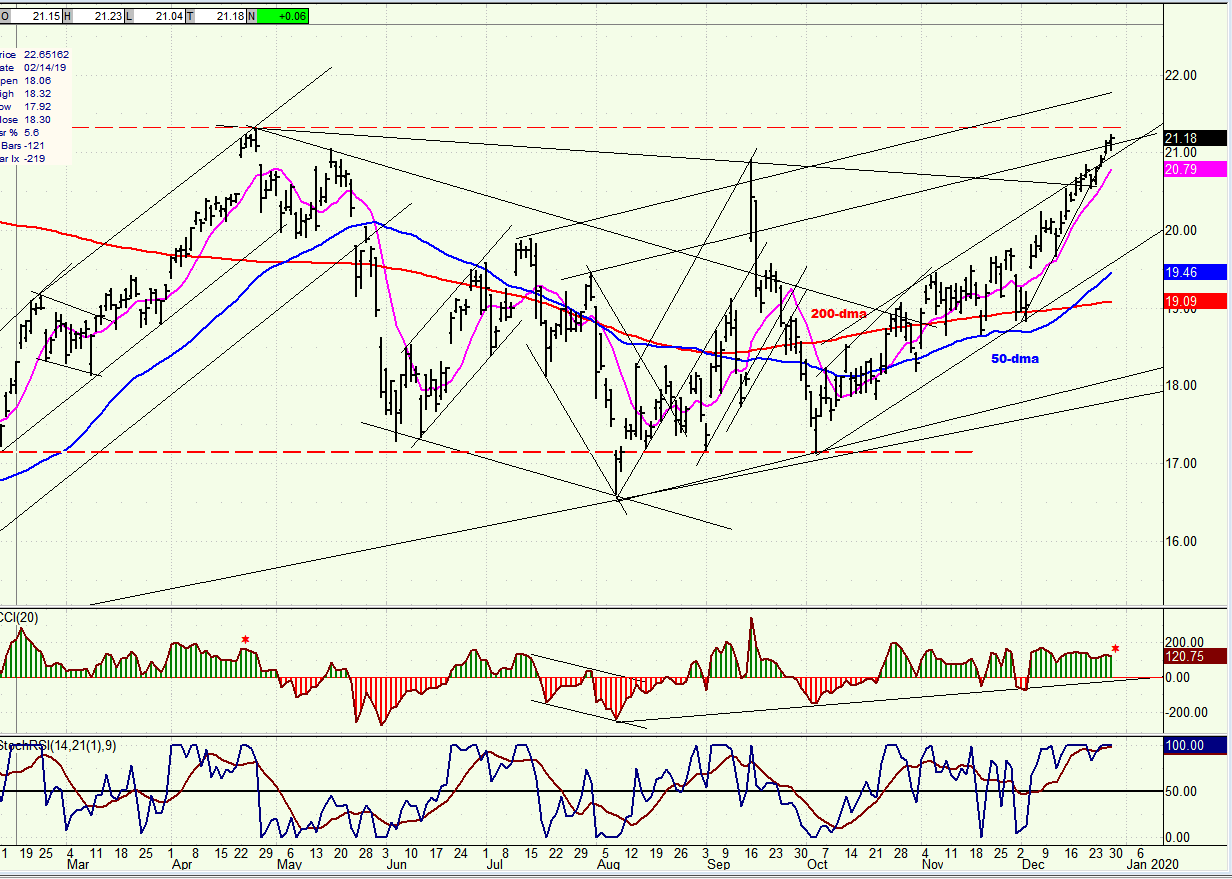
BNO (U.S. Brent oil fund) daily
The short-term trend shows the potential for a move to 22.00 before reversing. Despite negative divergence in the CCI, the oscillators have yet to turn down.
Summary
After by-passing the 3180 mark, SPX has now reached 3240 which is a better bet for at least a pause in the uptrend from 2856; even if we do not get an intermediate reversal right away.
I would like to wish everyone a happy, healthy and prosperous new year
FREE TRIAL SUBSCRIPTON
With a trial subscription, you will have access to the same information that is given to paid subscribers, but for a limited time period. I think you will find that knowing how far a move can carry is one of the most useful benefits of this service, whether you are a trader or an investor -- especially when this price target is confirmed by reliable indicators which give advance warning of a market top or bottom. Furthermore, cycle analysis adds the all- important time element to the above price projections. For a FREE 4-week trial, further subscription options, payment plans, and for general information, I encourage you to visit my website at www.marketurningpoints.com.
The above comments about the financial markets are based purely on what I consider to be sound technical analysis principles. They represent my own opinion and are not meant to be construed as trading or investment advice, but are offered as an analytical point of view which might be of interest to those who follow stock market cycles and technical analysis.
********

When Andre Gratian was a stock broker years ago, a friend introduced him to technical analysis of the market. Consequently, it is not an exaggeration to say that Andre fell in love with this approach! Ever since then, it has become an increasingly important part of his professional life. Gratian has studied the works of Wyckoff, Edwards & Magee, Edward J. Dewey (cycles) and many others. However, one of my most profitable undertaking has probably been to study Point & Figure charting, which he finds invaluable in analyzing stocks and indices. If he were restricted to one methodology, this is the one that he would choose. This well-rounded background has given him what he feels to be a special insight into the stock market, facilitating the recognition of meaningful patterns and the ‘turning points’ in all trends, whether they be short or long term. Andre feels very comfortable discussing the stock market and passing on meaningful information to others. His subscribers include individuals and money managers throughout the world. Moreover, his Newsletters are currently published on several financial sites, here and abroad.


