Technical Analysis Of The Markets
 share
share
 share
share
 share
share
 share
share
 share
share
Current Position of the Market
SPX Long-term trend: An “official” bear market has now been declared.
SPX Intermediate trend: Intermediate low mid-year.
Analysis of the short-term trend is done on a daily-basis with the help of hourly charts. It is an important adjunct to the analysis of daily and weekly charts which discuss longer market trends.
Approaching Short-term Low
Point & Figure overview of SPX
Long term trend: Only intermediate targets reliable at this time.
Intermediate trend: Maximum 2170-2030 this phase into mid-year after relief rally.
Important cycles followed
I follow only a few cycles that I consider reliable in my analysis. This is complemented by the analysis of Erik Hadik (www.insiidetrack.com).
The 80-d cycle is due on 4/8 then 6/8; 40-wk ~7/15; 4.5-yr or 9-yr ~7/15.
Market Analysis (Charts courtesy of QCharts)
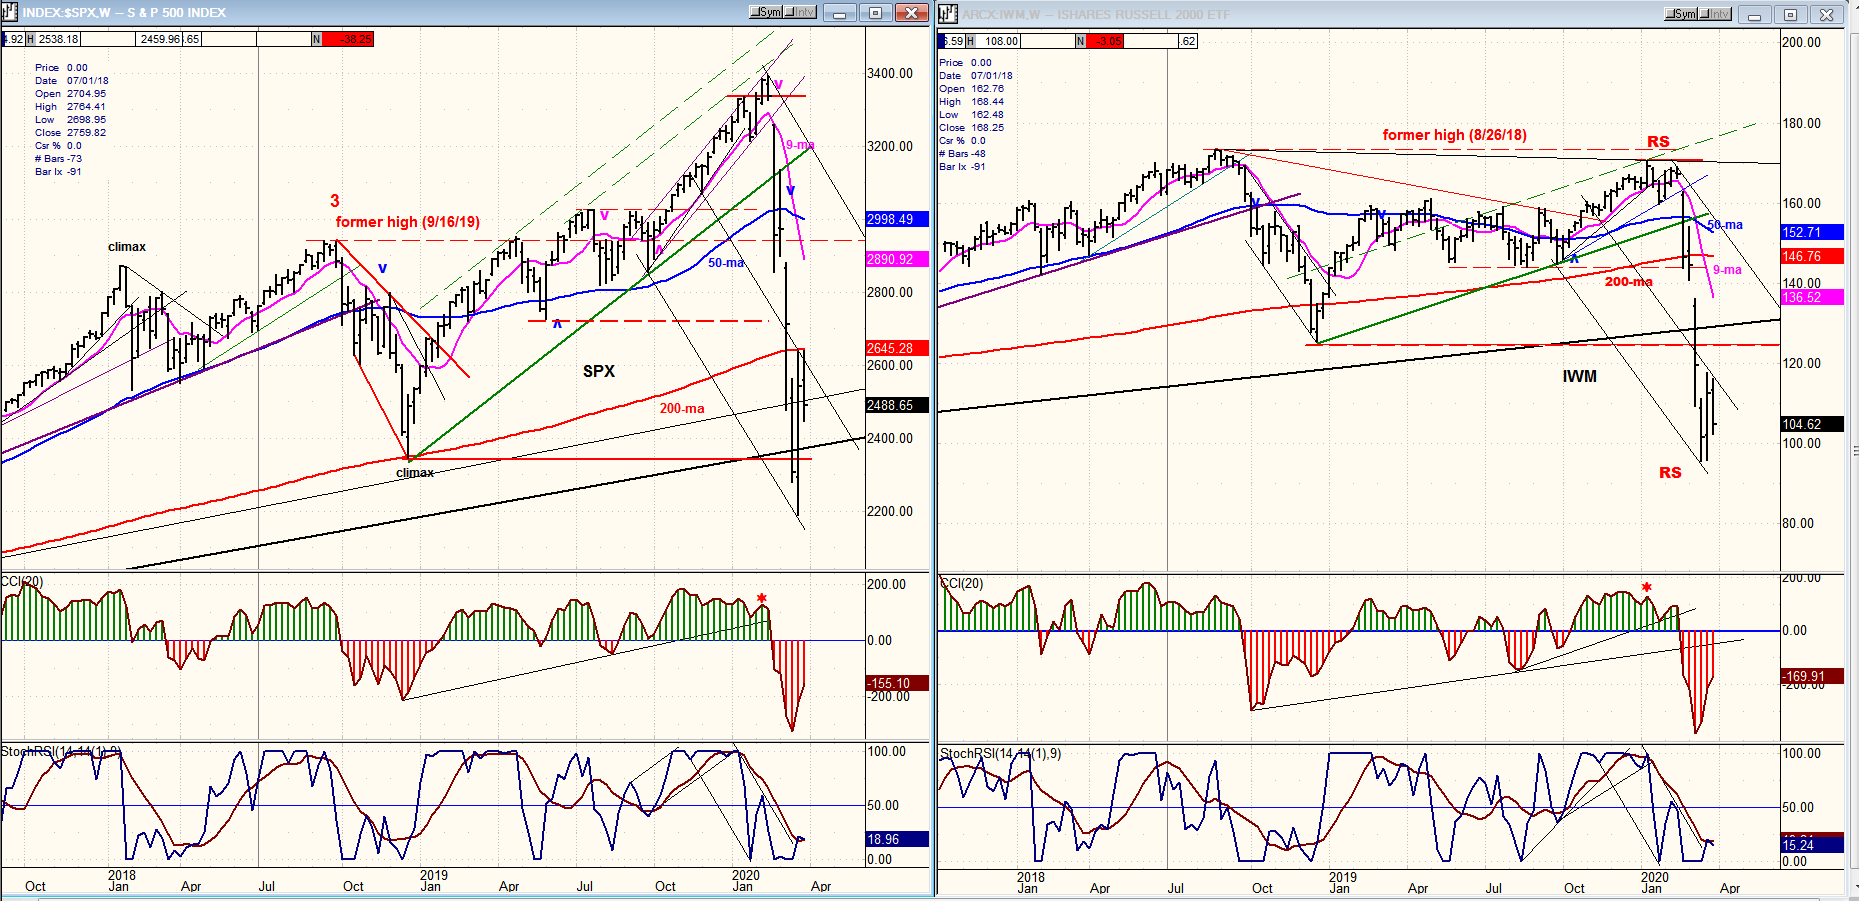
SPX- IWM weekly charts:
Both indices ended their initial countertrend rallies and are pulling back. For the SPX, it will most likely be a retest of the low while the IWM could make a marginal new low, emphasizing its relative weakness to the SPX and thereby suggesting that this is only a temporary low which is likely to be surpassed after the next countertrend rally has completed.
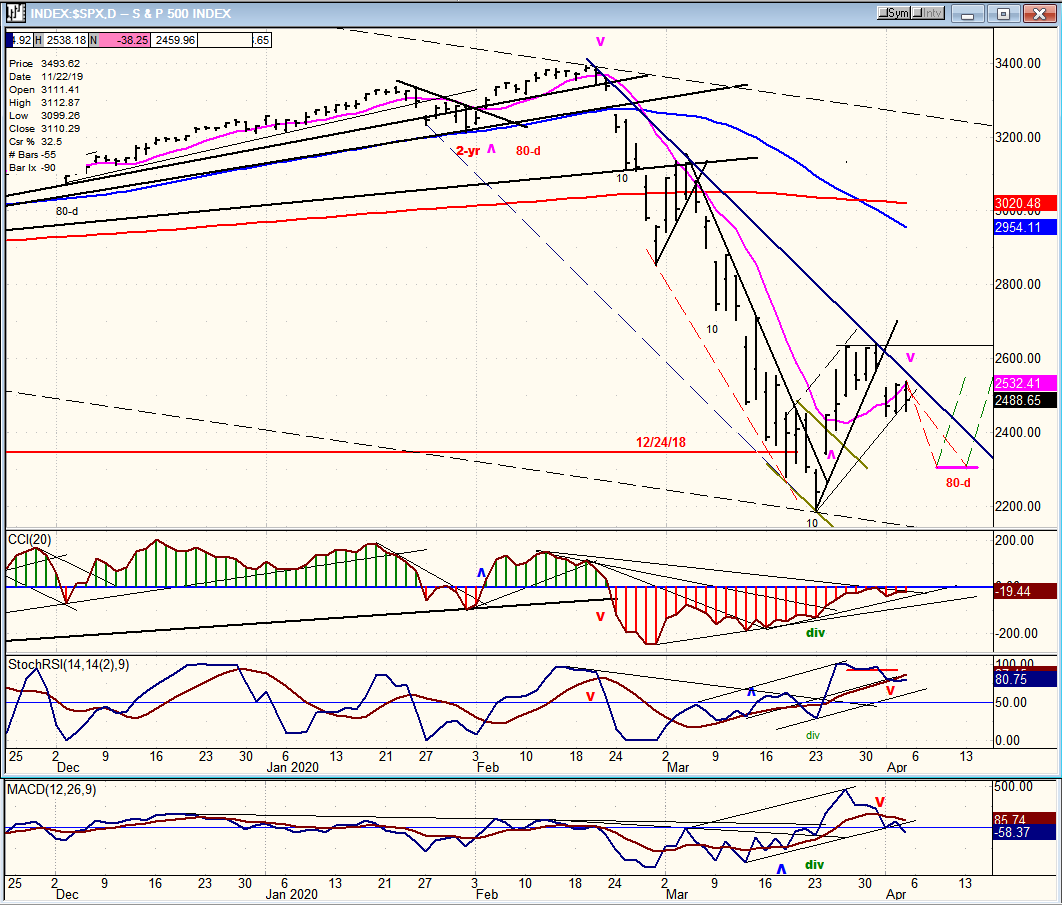
SPX daily chart
The first (partial) countertrend rally came to a halt at 2616, a little beyond the .318 retracement of the third wave of the current decline, but shy of a .50 retracement. I have marked the ideal low (2300) for the 80-day (Hurst) cycle which has a good record for time consistency of ~45 trading days. So, next week’s low would most lilkely be the b-wave of a corrective wave of the full countertrend rally which could extend into May before wave 5 takes over and pushes the index to a new low into about July 15, thereby ending what is likely the first phase of the decline from 2393. There is too much uncertainty about what lies beyond that date to determine what the full extent of this correction will turn out to be; but that should clear up as we move along since the market tends to give us advance warning of what comes next. Although, the only real advance warning we had before the price avalanche was the persistent (and still persisting) relative weakness of IWM. There were other signs that the market was overbought and that a correction was due, but not of this magnitude. It qualifies as a black swan event!
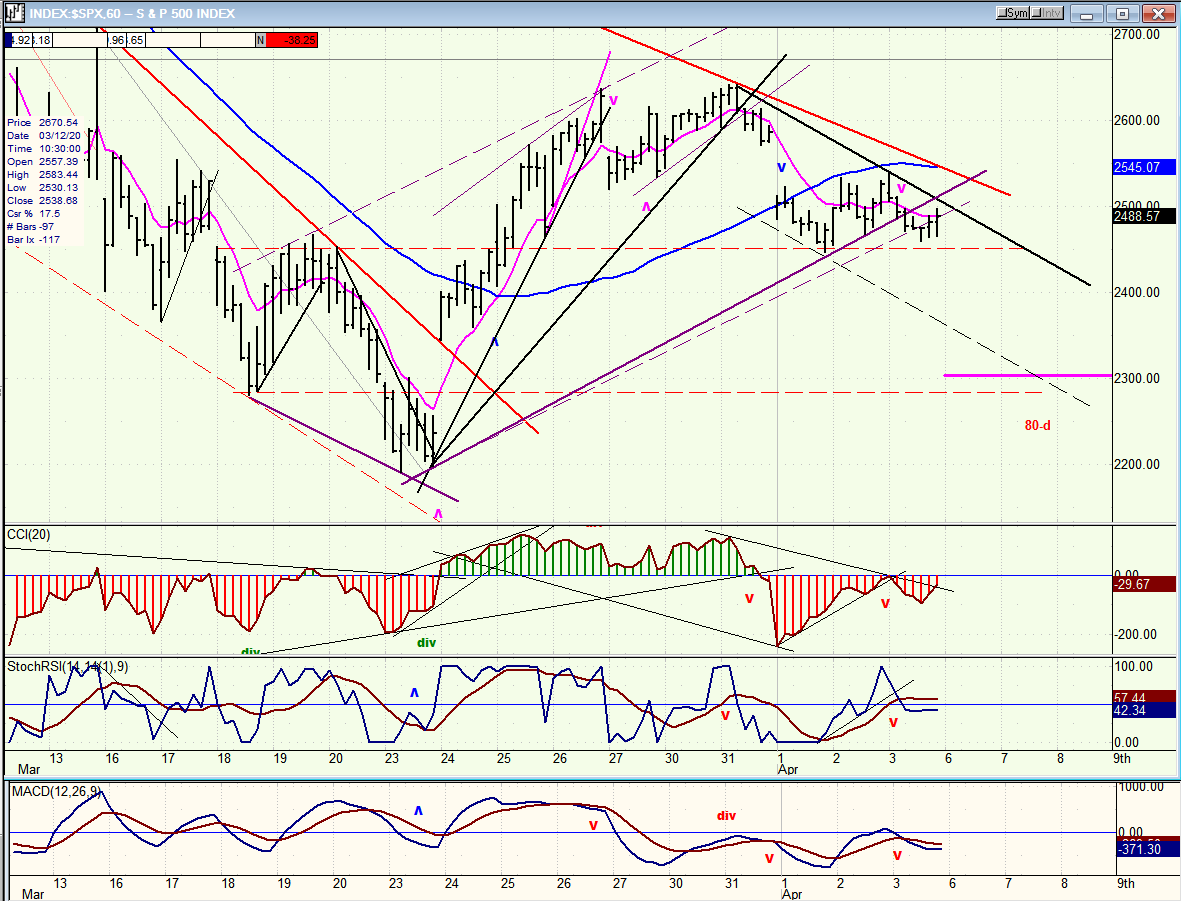
SPX hourly chart
SPX made an initial top at 2637, quickly pulled back a few points and crawled back to 2641 before making what is essentially a double top and finally succumbing to the downward pressure of the declining 80-day cycle whose ideal low has been posted on the daily chart.
A couple of days of consolidation/support was provided by the peak of the last countertrend bounce of the original decline, and this held up the current downward motion of the index until Friday’s close. If, by chance, the 80-day cycle bottomed a few days early, then Monday should see a resurgence of buying take place. This is possible since the pull-back into Wednesday consisted of a .382 retracement of the countertrend rally from 2192 to 2641, but not probable because this would cut the 80-day cycle short of its normal ~45-day phase by several days. A better bet would be for the retracement to continue for a few more days to what is an also probable P&F projection to ~2300, as determined by the double top congestion count. But the price pattern as well as the oscillators will keep us in suspense until Monday (with a sneak-peek Sunday provided by the futures) before confirming what the next near-term time frame will bring.
UUP (dollar ETF)
UUP was buffeted by the market decline and the Feds reaction to it, and made an abnormal chart pattern from which it is recovering. It has retraced 50% of that pattern’s width and is settling down into a more normal routine. The retracement coincided with a move back down into its 3-mo low, finding support at its 50-dma and bouncing. The up phase of the cycle should support it for a while until it is ready to peak and bring prices back down into the next 3-mo low. A move into the broken channel line at about 27.50 is likely before the next reversal.

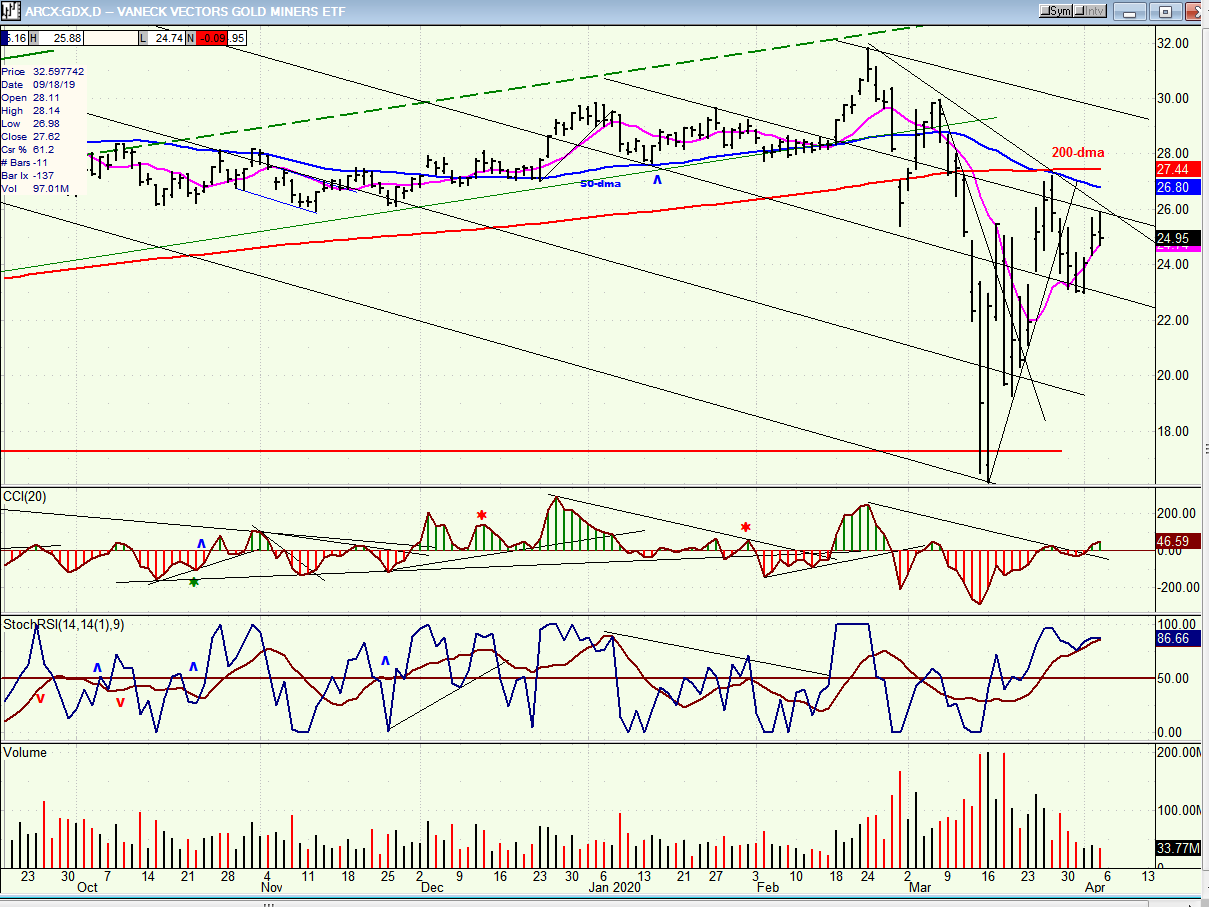
GDX (gold miners)
The market turbulence also had its effect on GDX, which had a sharp decline that undercut the September 2019 low by a small margin before rallying strongly into its combined 50-dma and 200-dma -- a level which could prevent it from making significant upside progress for a while longer. Its current volatility could cause it to form a good base above the recent low before it is ready to resume its intermediate uptrend.
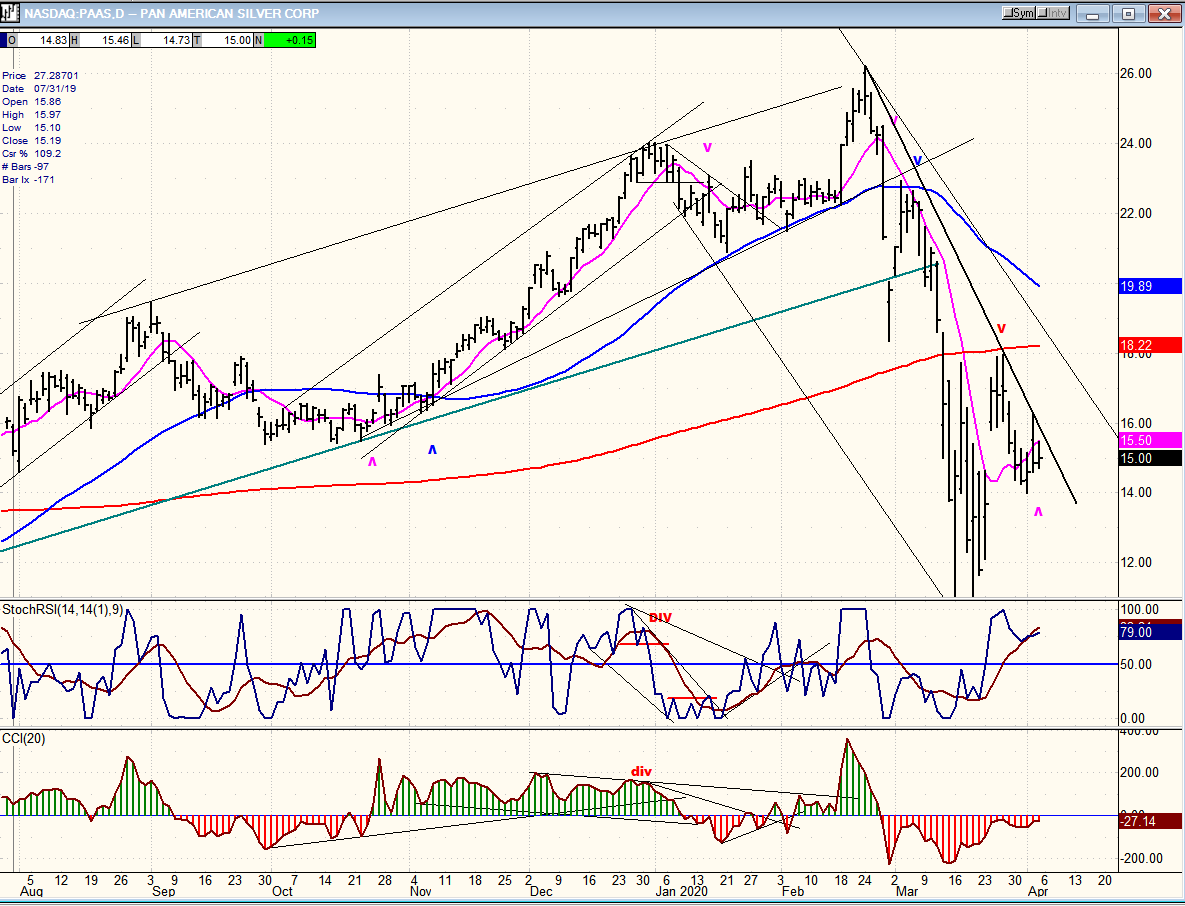
PAAS (Pan American Silver Corp)
Silver is in the same fix as gold, and it is likely that PAAS will model its pattern after that of GDX.
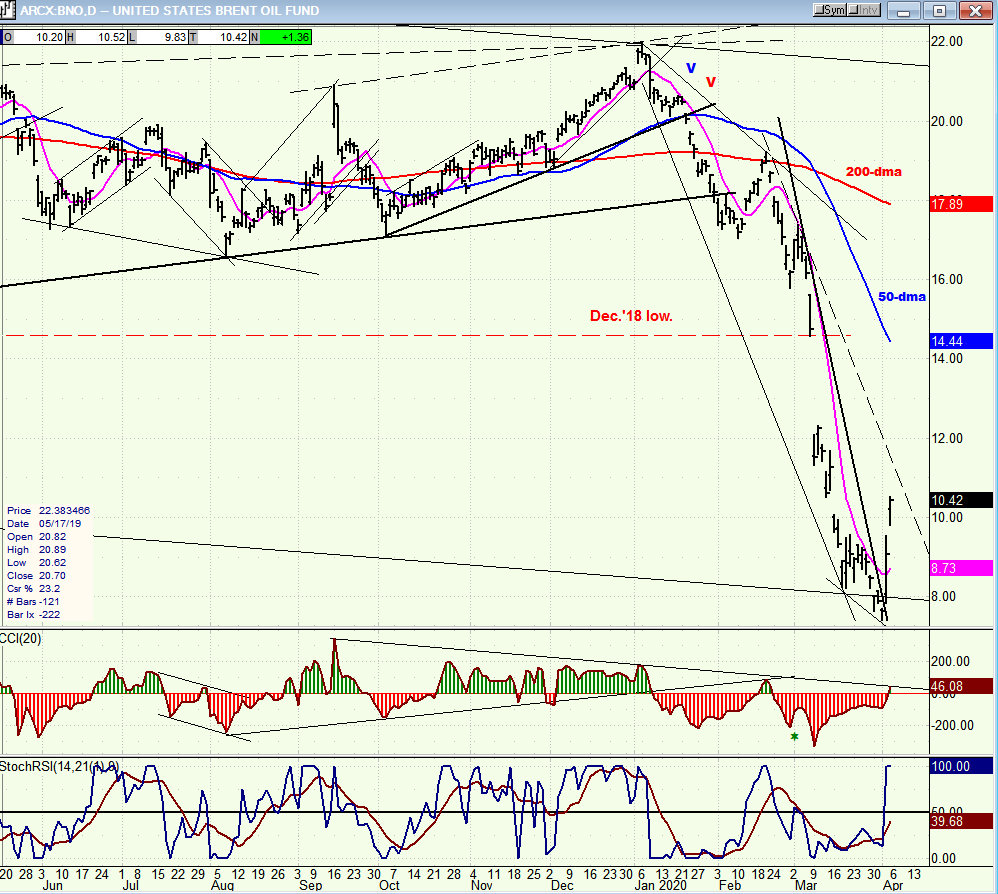
BNO (U.S. Brent Oil fund)
BNO rebounded along with crude on the news that oil production might shortly be decreased by OPEC and Russia. But any substantial move will have to wait until a sizable base has been formed and oil consumption has returned to normal.
Summary
SPX is likely to make its 80-day cycle low next week at a slightly lower level than where it closed Friday. After which, it can start on the c-wave of its countertrend rally.
Free trial subscription
With a trial subscription, you will have access to the same information that is given to paid subscribers, but for a limited time period. Over the years, I have developed an expertise in P&F charting (price projection), cycles (timing), some familiarity with EWT, and general technical analysis which enables me to warn subscribers of pending reversals in market trends and how far that trend can potentially carry. For a FREE 4-week trial, subscription options and payment plans, I encourage you to visit my website at www.marketurningpoints.com.
The above comments and those made in the daily updates and the Market Summary about the financial markets are based purely on what I consider to be sound technical analysis principles. They represent my own opinion and are not meant to be construed as trading or investment advice, but are offered as an analytical point of view which might be of interest to those who follow stock market cycles and technical analysis.
********
share
share
share
share
share

When Andre Gratian was a stock broker years ago, a friend introduced him to technical analysis of the market. Consequently, it is not an exaggeration to say that Andre fell in love with this approach! Ever since then, it has become an increasingly important part of his professional life. Gratian has studied the works of Wyckoff, Edwards & Magee, Edward J. Dewey (cycles) and many others. However, one of my most profitable undertaking has probably been to study Point & Figure charting, which he finds invaluable in analyzing stocks and indices. If he were restricted to one methodology, this is the one that he would choose. This well-rounded background has given him what he feels to be a special insight into the stock market, facilitating the recognition of meaningful patterns and the ‘turning points’ in all trends, whether they be short or long term. Andre feels very comfortable discussing the stock market and passing on meaningful information to others. His subscribers include individuals and money managers throughout the world. Moreover, his Newsletters are currently published on several financial sites, here and abroad.


