Technical Analysis Of The Markets


Current Position of the Market
SPX Long-term trend: An “official” bear market has now been declared.
SPX Intermediate trend: Intermediate low mid-year.
Analysis of the short-term trend is done on a daily-basis with the help of hourly charts. It is an important adjunct to the analysis of daily and weekly charts which discuss longer market trends.
Re-testing the Recent High
Point & Figure overview of SPX
Intermediate trend: Estimated top of countertrend rally ~2930 (?) May have fallen short of target!
Important cycles followed
I follow only a few cycles that I consider reliable in my analysis. This is complemented by the analysis of Erik Hadik (www.insiidetrack.com).
The 80-d cycle was due on 4/8(actual 4/3); comes next on 6/8; 40-wk ~7/15; 4.5-yr or 9-yr ~7/15.
Market Analysis (Charts courtesy of QCharts)
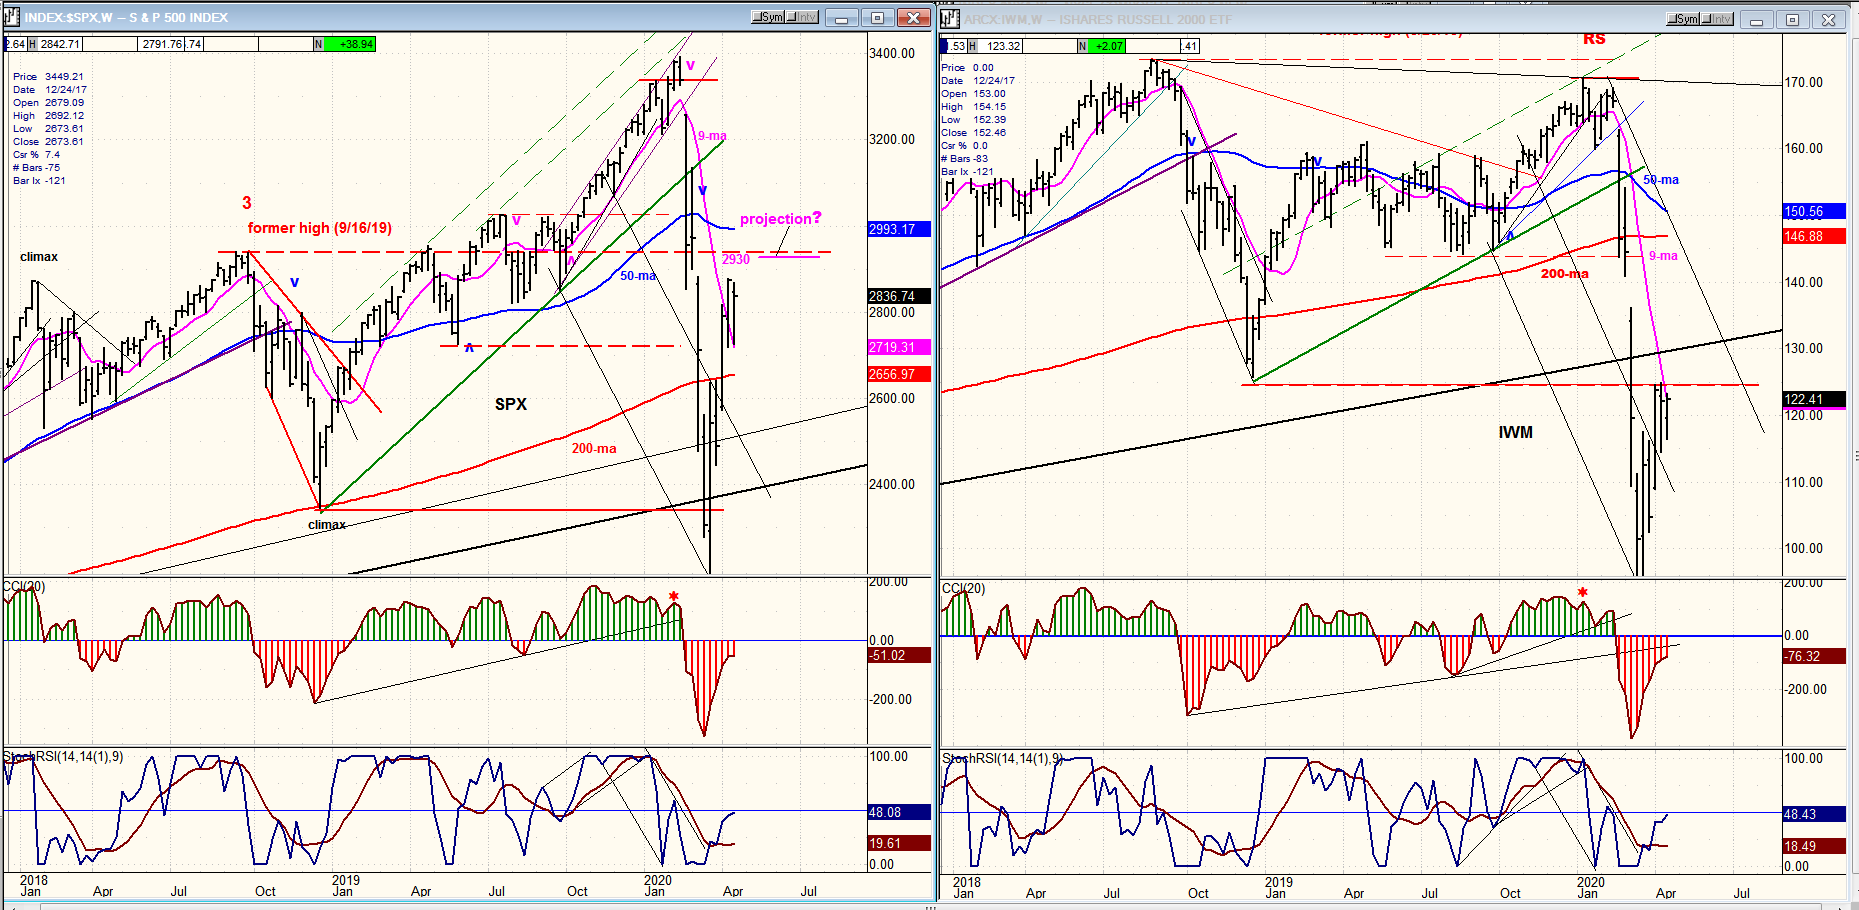
SPX- IWM weekly charts:
Both indices have now traded in a range for three weeks. This week’s rally looks as if it could be a re-test of the high made last week. The next reversal could be the beginning of a substantial decline if the SPX 2720 level is broken. IWM shows no sign of being willing to improve its relative strength to SPX.
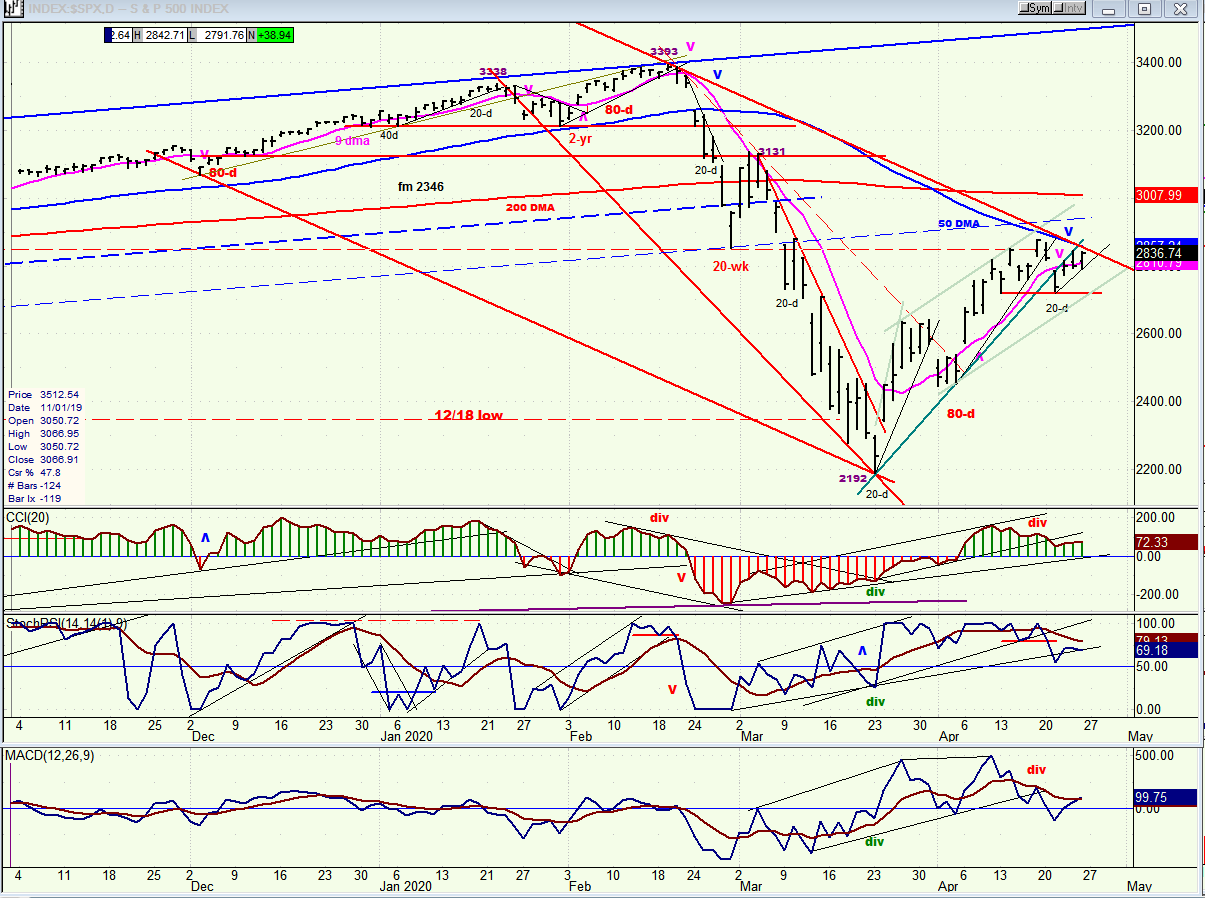
SPX daily chart
After making a high at 2879, SPX had a quick 52-point decline into the next minor cycle low, breaking the primary countertrend rally trend line in the process. The high fell short of the 2930 target which had been projected. The subsequent rally remained outside of the trend line and reached 2845, which looked as if it might be the high prior to the next reversal. But Friday’s rebound suggests that we could move a little higher (perhaps even make another try for the 2930 projection, although odds are poor) before rolling over to challenge the 2721 support.
The 2721 level is a very important level because all the trading which has taken place above it is likely to be distribution that, on the P&F chart, has the appearance of being a substantial top with a count already capable of taking the market to a new low. Frankly, after the initial low of 2192, I had not expected a bear market rally of this magnitude; but it gives the bulls who have remained invested a second chance to liquidate their positions before the next phase of the bear market gets underway. The damage which COVID-19 has already done to the world economy is far greater than that experienced during the “great recession” of 2008-2009. And when, with no economic recovery in sight, the full extent of the damage being done sets in, the stock market’s reaction could be even more severe than it has been, so far. At the very least, another substantial decline should take place into mid-year -- an important cycle bottom which could create a market low of intermediate proportion.
The indicators have started to display negative divergence and, unless strength returns immediately, it should be simply a matter of days before they roll over and give a full-fledged sell signal.
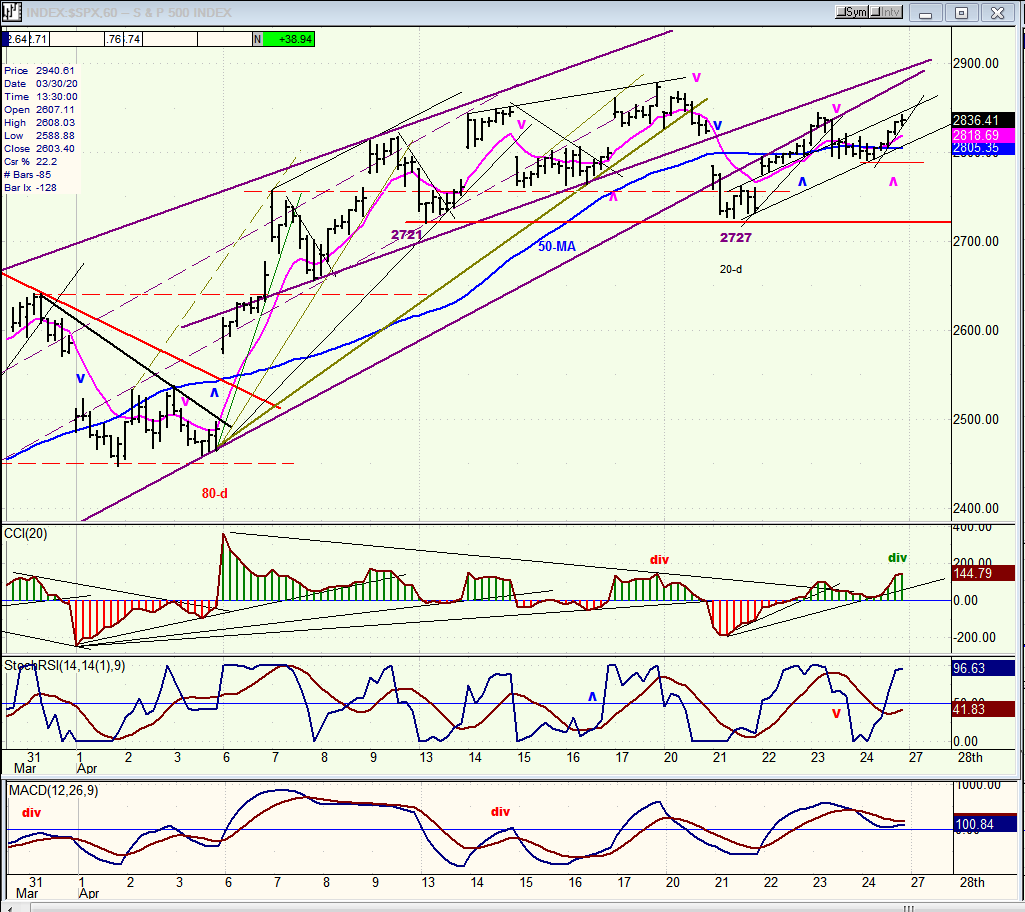
SPX hourly chart
The hourly chart breaks down the formation into more detail, allowing us to follow the rally from the last minor cycle low more closely. On this chart, the oscillators tell us that there should be a little more to go in the rally from 2727 before it comes to an end. Friday’s push has created some positive divergence in the CCI. This means that we may not be quite done with Friday’s rally. When we are, we should reverse and challenge the 2721-2727 support line. Breaking it should start (continue) the second phase of the decline.
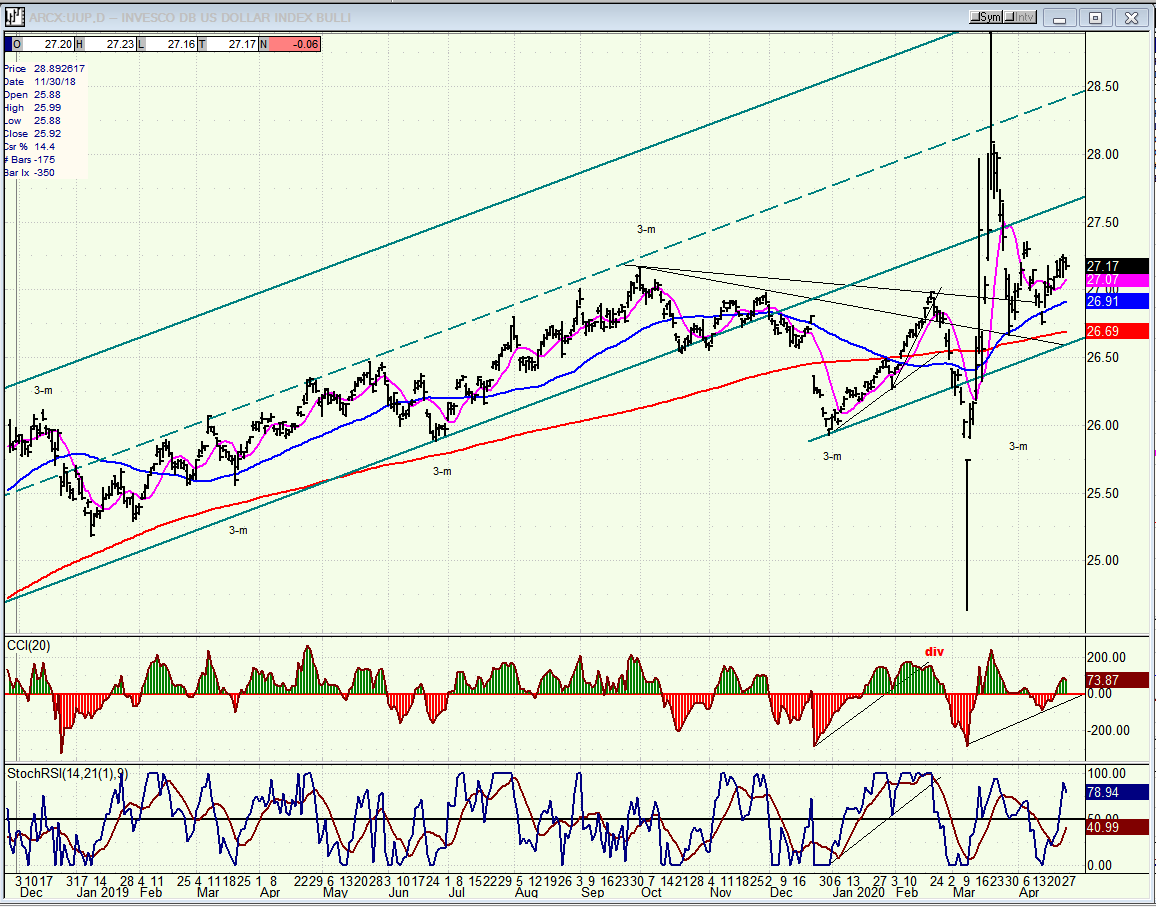
UUP (dollar ETF) daily
After making a new high, UUP had a sharp retracement, found support on its 50-dma, and has had a small rebound which is holding and may continue to do so until it gets pulled down again by the 3-m cycle (which it appears to follow closely). The indicators are suggesting that it is currently in a short-term uptrend with no sign of an immediate reversal.
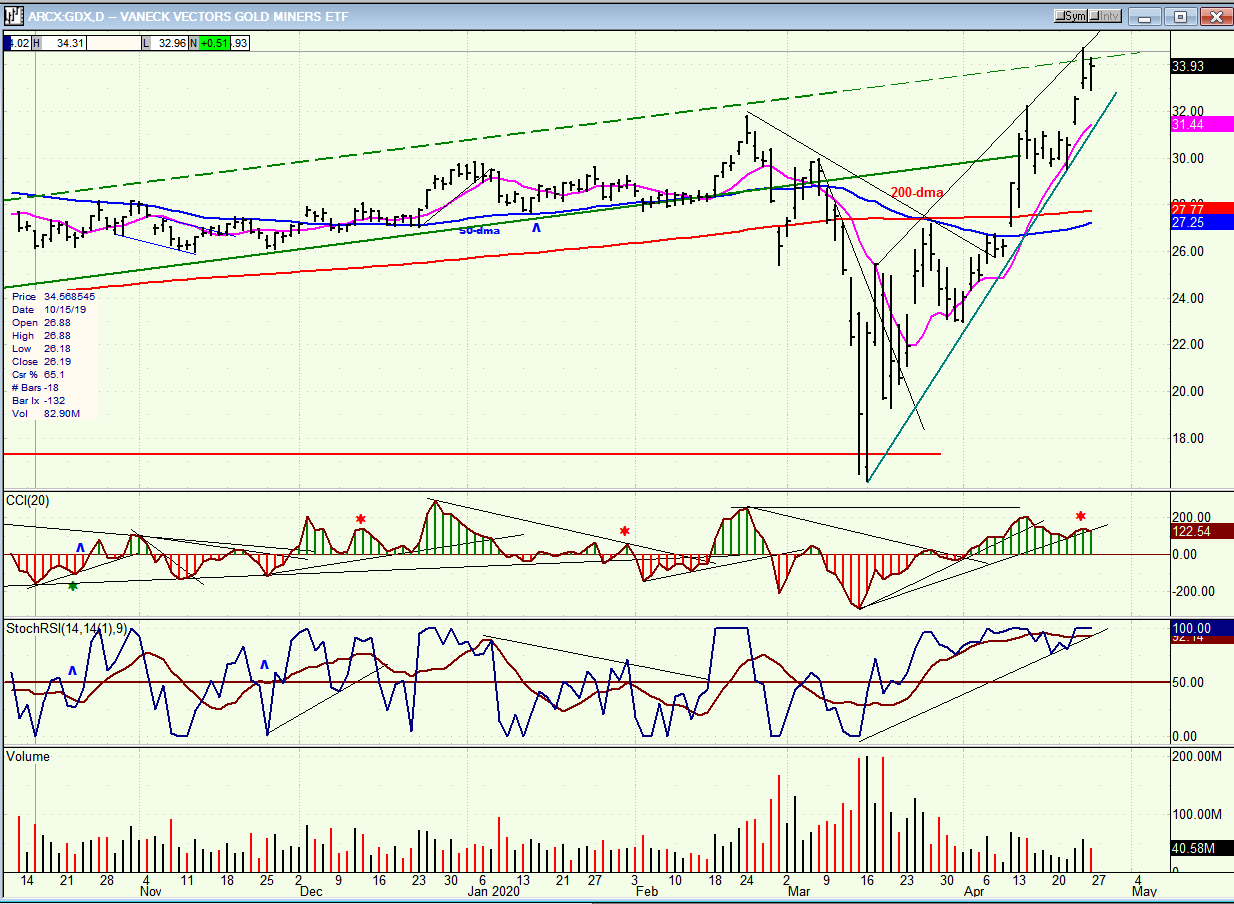
GDX (gold miners) daily
GDX had a sharp decline followed by a sharp rally to a new intermediate high. Last week, it may have met an interim projection which should create a short-term pull-back. We’ll monitor that retracement to see when it is ready to continue its uptrend. After completing this retracement, GDX should reach 39-40 for an intermediate high.
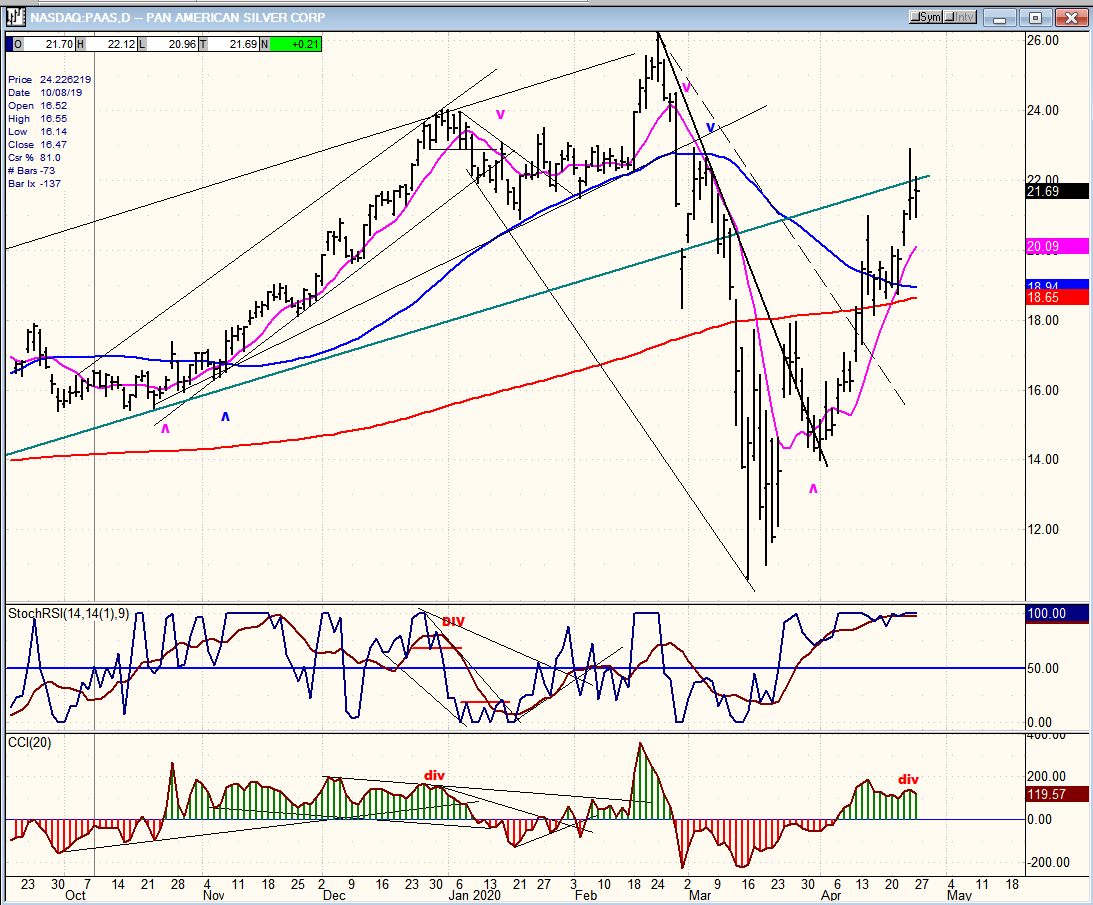
PAAS (Pan American Silver Corp) daily
PAAS has also reached a near-term target (near 23) and should also have a short-term retracement. Longer-term, it has a target of about 41, but I do not have a time projection for it. On a fairly short-term basis, 31 is attainable.
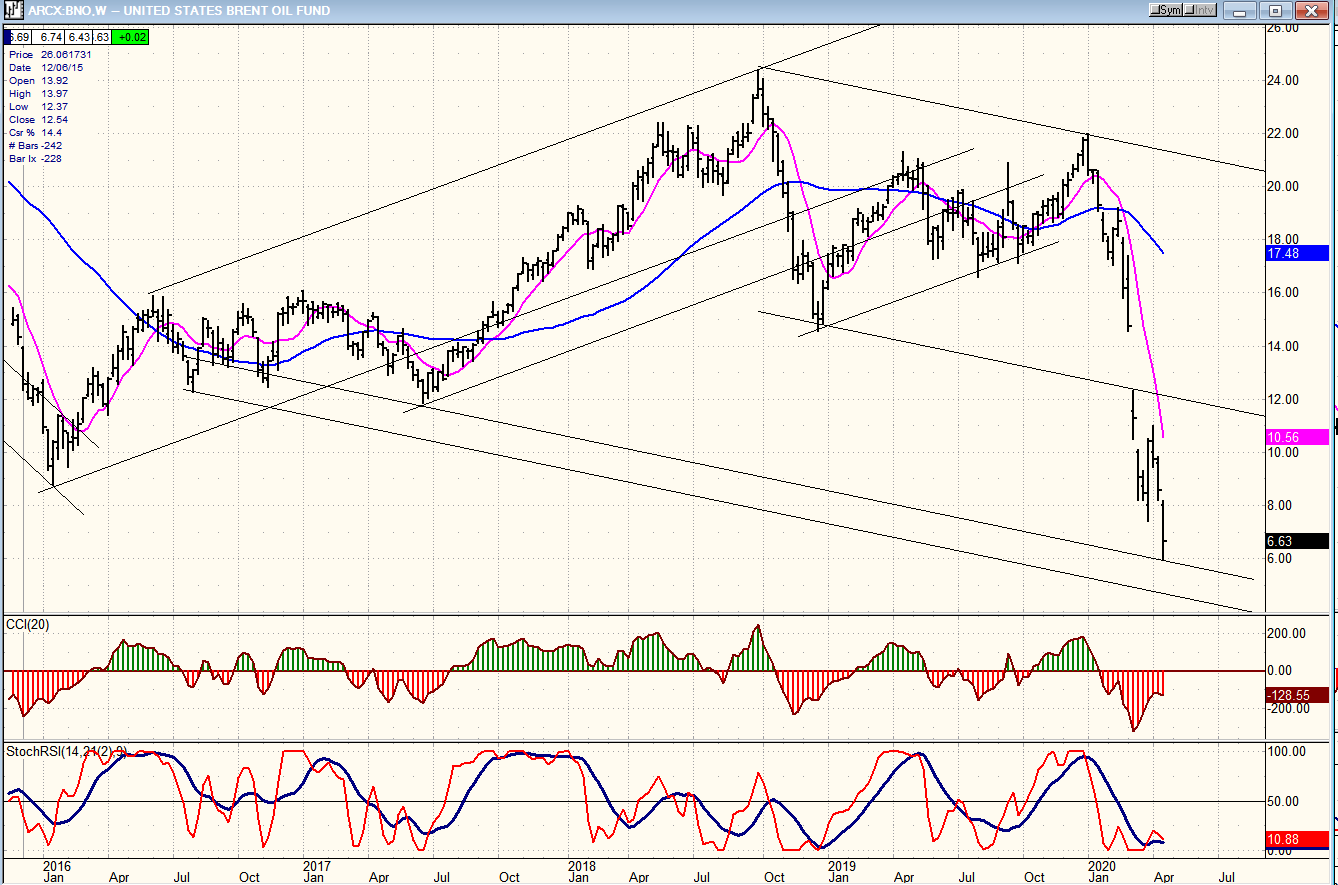
BNO (U.S. Brent Oil fund) weekly
BNO has made a new low and could find temporary support on a parallel line, but this is not likely to be the end of its decline before reaching its final destination.
Summary
SPX is making a secondary top which may simply need a finishing touch. The next short-term reversal should quickly re-test the 2720 level, and once it is broken, a new low is likely, possibly by mid-year.
Free trial subscription
With a trial subscription, you will have access to the same information that is given to paid subscribers, but for a limited time period. Over the years, I have developed an expertise in P&F charting (price projection), cycles (timing), some familiarity with EWT, and general technical analysis which enables me to warn subscribers of pending reversals in market trends and how far that trend can potentially carry. For a FREE 4-week trial, subscription options and payment plans, I encourage you to visit my website at www.marketurningpoints.com.
The above comments and those made in the daily updates and the Market Summary about the financial markets are based purely on what I consider to be sound technical analysis principles. They represent my own opinion and are not meant to be construed as trading or investment advice, but are offered as an analytical point of view which might be of interest to those who follow stock market cycles and technical analysis.
********

When Andre Gratian was a stock broker years ago, a friend introduced him to technical analysis of the market. Consequently, it is not an exaggeration to say that Andre fell in love with this approach! Ever since then, it has become an increasingly important part of his professional life. Gratian has studied the works of Wyckoff, Edwards & Magee, Edward J. Dewey (cycles) and many others. However, one of my most profitable undertaking has probably been to study Point & Figure charting, which he finds invaluable in analyzing stocks and indices. If he were restricted to one methodology, this is the one that he would choose. This well-rounded background has given him what he feels to be a special insight into the stock market, facilitating the recognition of meaningful patterns and the ‘turning points’ in all trends, whether they be short or long term. Andre feels very comfortable discussing the stock market and passing on meaningful information to others. His subscribers include individuals and money managers throughout the world. Moreover, his Newsletters are currently published on several financial sites, here and abroad.


