Technical Analysis Of The Markets


Gold
Short-Term Update:
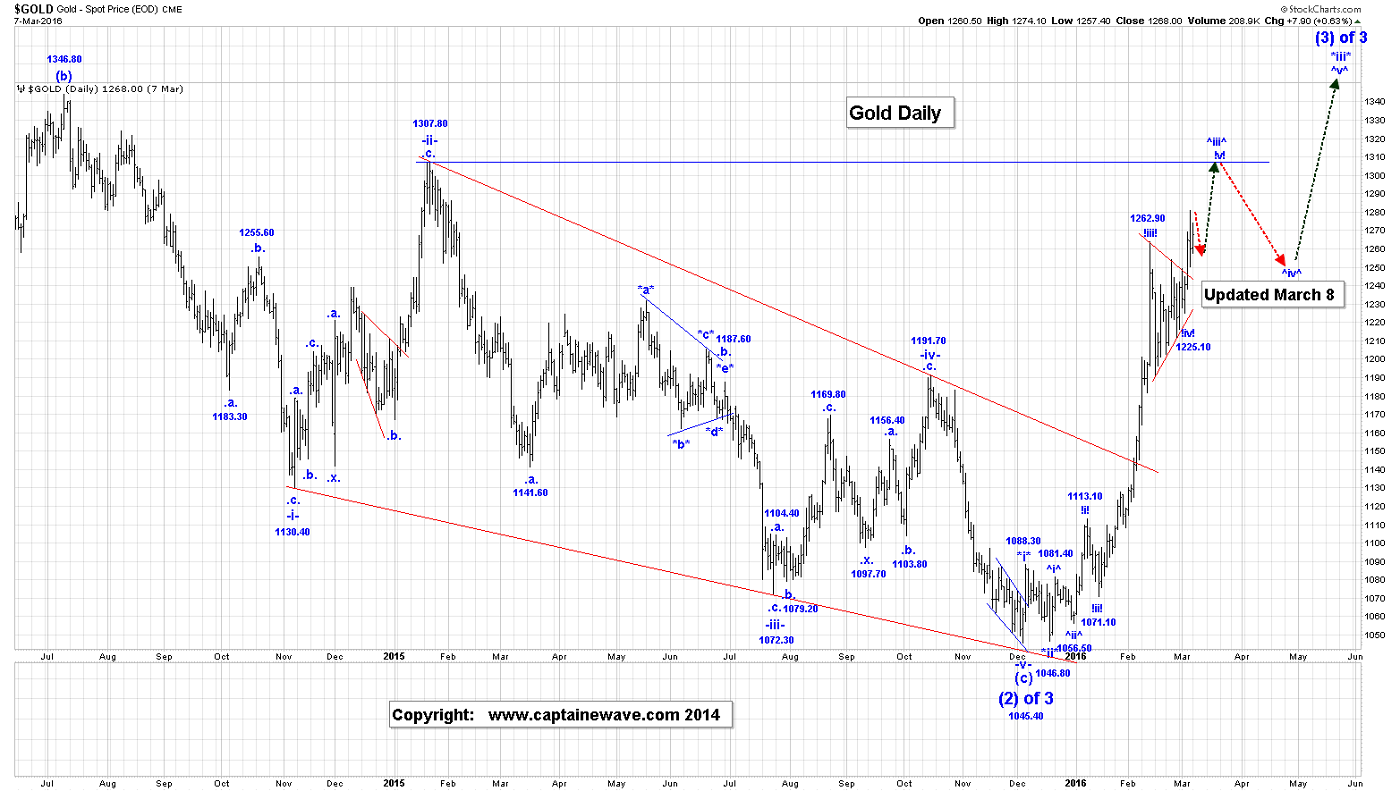
Gold Rallied to a high of 1279.00 in the overnight session, at the time that this Post was being written. In order to confirm that all of wave !v! is NOT complete at the 1280.60 high, we need to gold to move above that high in a sharp rally in the next day or so.
Our projected high of the end of wave !v! and ^iii6 is still the 1308ish level. On the Intraday Chart we also do have evidence of a possible bullish triangle formation that appears complete near the 1266.30 low.
Our initial count for wave (3) of 3 is as follows:
*i* = 1088.30
*ii* = 1046.80;
*iii*:
^i^ = 1081.40;
^ii^ = 1056.60;
^iii^:
!i! = 1113.10;
!ii! = 1071.10;
!iii! = 1263.40, 1262.90 (Daily Continuous Futures);
!iv! =1225.30;
!v! = 1280.60, if complete to complete all of wave ^iii^;
^iv^ drop will be next.
Longer-Term Update

Based on the current count, gold is still working on its first impulsive sequence out of its wave (2) of 3 low, and we still have a long way to go before this sequence is complete.
We are now working on our wave !v! thrust, and have satisfied all of the minimum requirements for that wave, but we expect further upside, more likely to our 1308 level.
Projection for the end of wave *iii* is:
*iii* = 6.25*i* = 1314.90.
Active Trading Positions: Long 20 positions, with puts at 1085.00!
Crude
Short-Term Update:
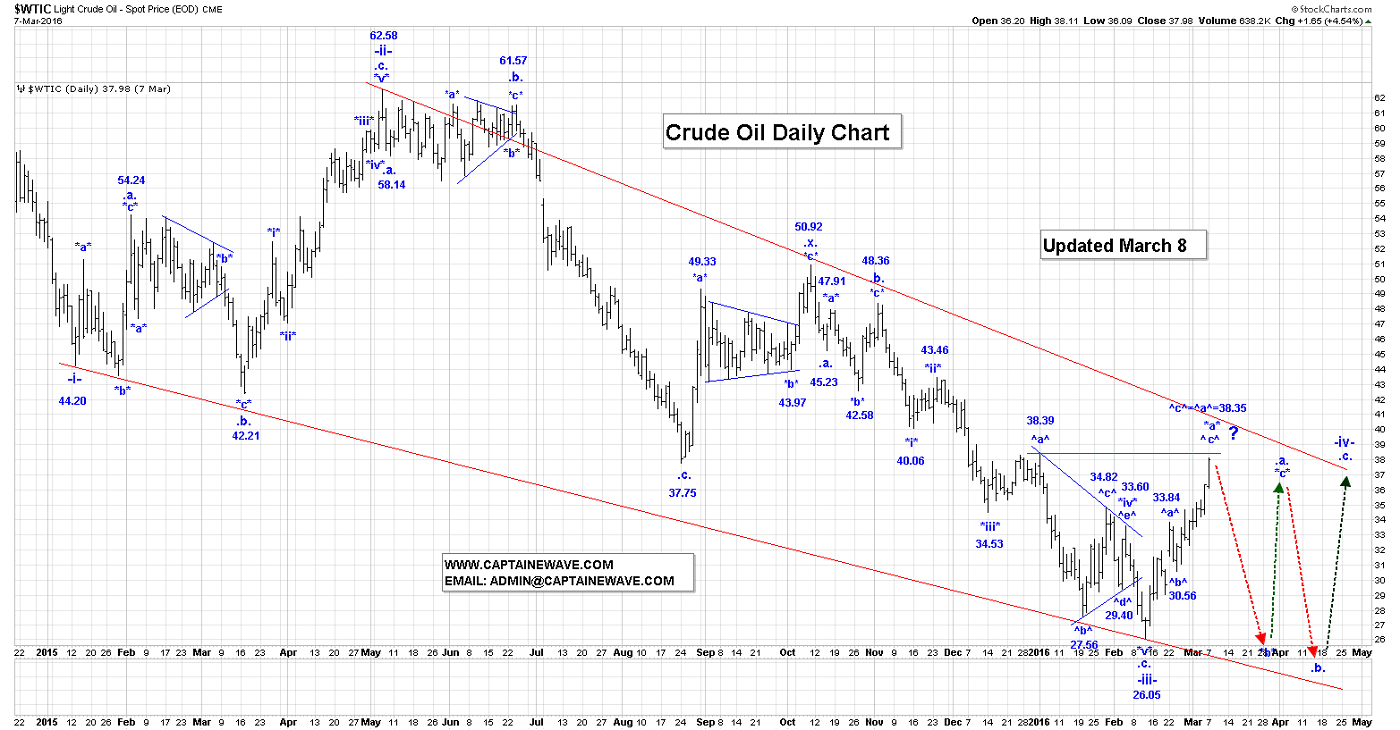
Crude reached a high of 38.37, in the overnight session at the time that this Post was being written. We have previous high of 38.39, as you can see on the attached Daily Crude Chart.
In spite of this great upside action, we still believe that we are coming very close to end of wave *a*, and that the next big event in the market is going to be a major drop in wave *b*, that is going to see crude drop back to the 26.05 level in wave *b*.
Our current count for all of wave -iv- is:
.a.:
*a*:
^a^ = 33.84;
^b^ = 30.56
^c^= 38.37, if complete to complete just wave *a* of .a. Note that ^c^=^a^=38.35.
No change to our Suncor comments; we expect wave (ii) to end soon.
Long-Term Update
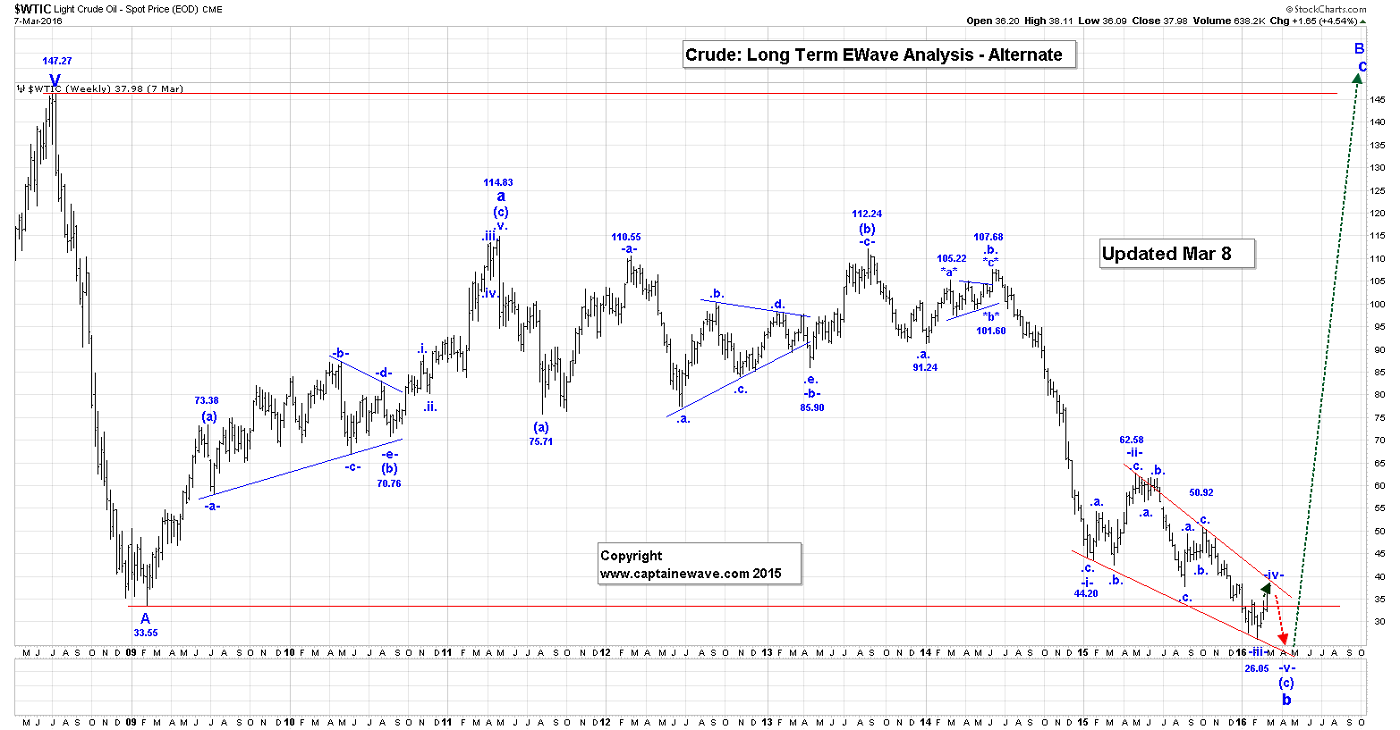
Wave -iii- is complete at the 26.05 low and we should now be rallying in wave -iv-, as the next big event in the market. Expect a big drop in wave *b*, after wave *a* ends.
Active Trading Positions: We are short Suncor at 24.75, risking to 28.50, and will also go long Suncor at 13.00!
S&P500:
Short-Term Update
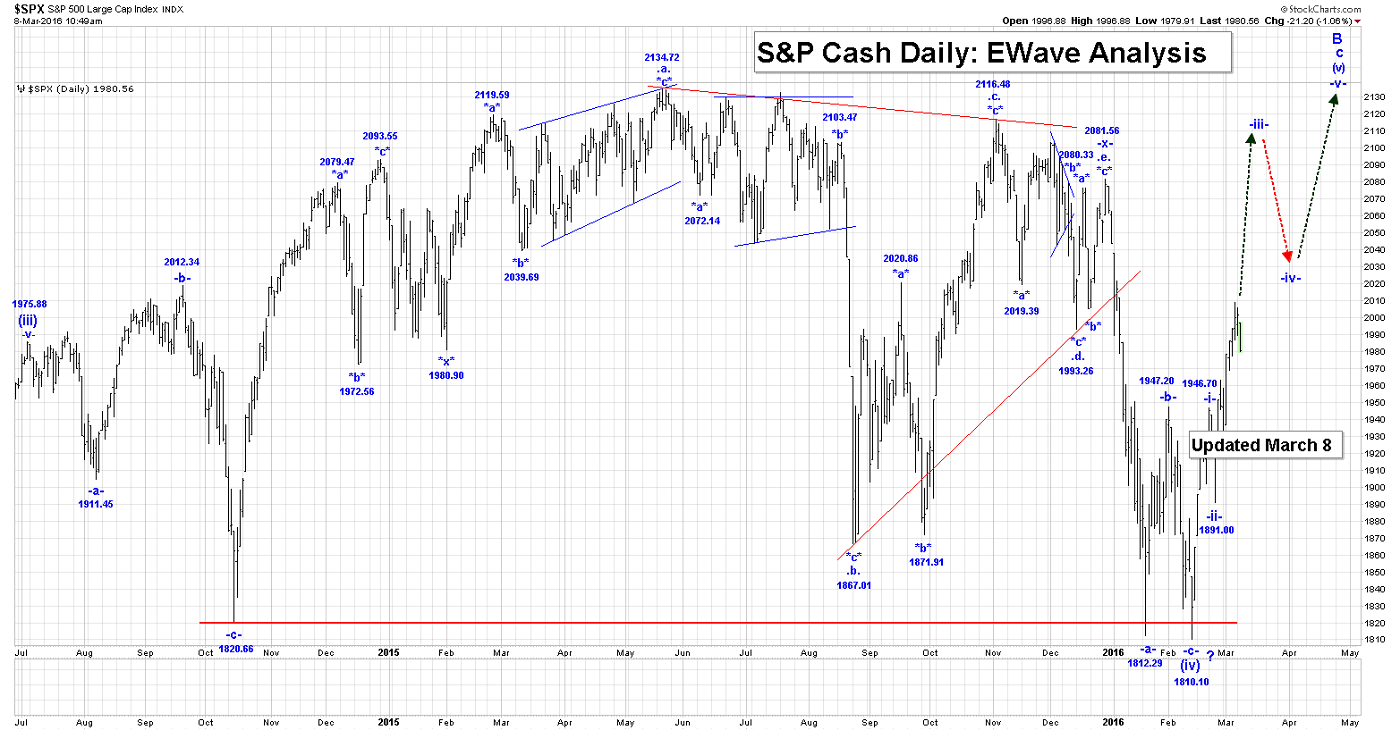
The S&P Futures are down about 9 points in the overnight session, at the time that this Post is being written. We suggested in yesterday’s Posts that the S&P is probably due for a small correction, but in the medium term we are still in wave -iii- of (v). If our current thinking is correct, then we should expect higher prices within wave -iii- to continue.
Our projected high for the end of wave -iii- is :
-iii- = 1.618-i- = 2112.02
Long-Term Update
Wave -i- of (v) is complete at the 1946.70 high, and wave -ii- at 1891.00. We are now rallying in wave -iii- of (v).
Active Trading Positions: Flat!
USDX
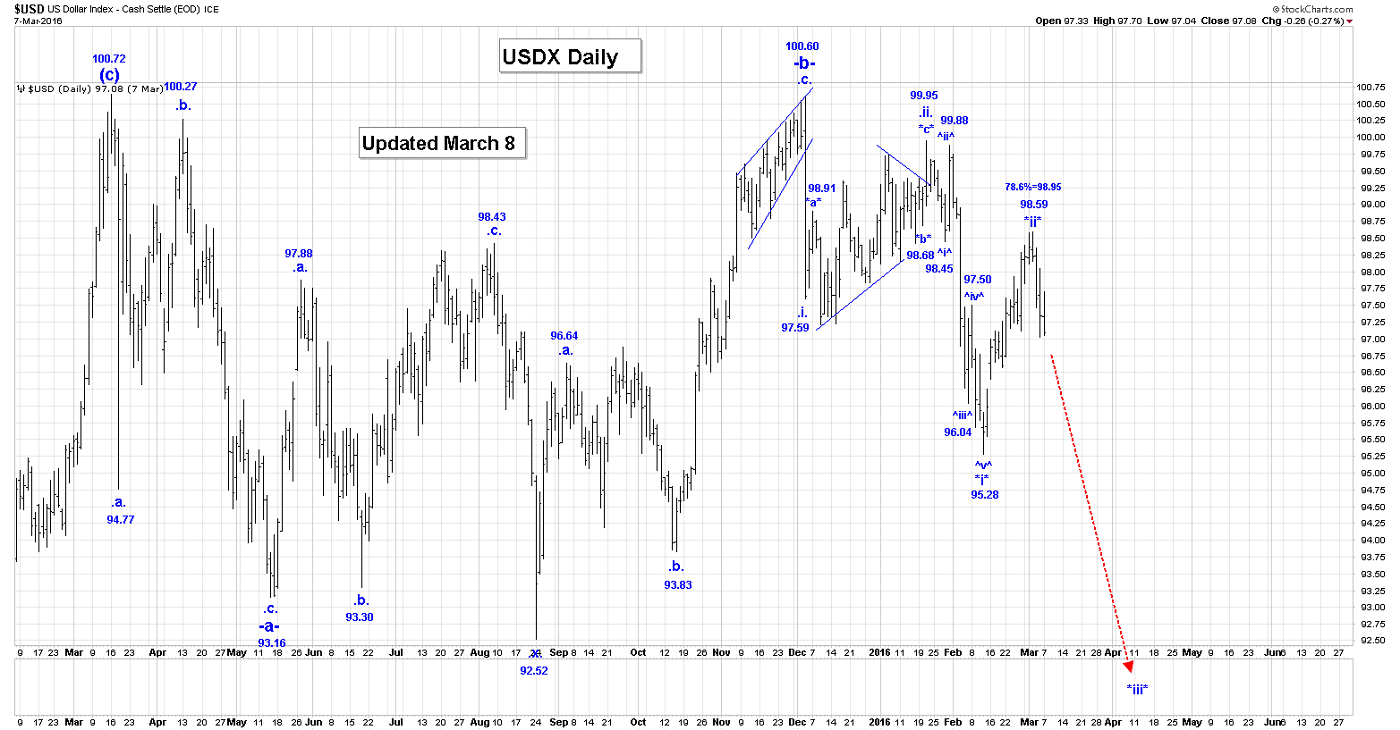
Short-Term Update
The USDX dropped to a low of 96.91, in the overnight session, before rallying back to the 97.10 level, at the time that this Post was being written.
As you can see on the attached daily USDX chart, we believe that all of wave *ii* ended at 98.59, and that we have started our sharp drop down in wave *iii*.
Our first target for the end of wave *iii* is 91.03, so we should expect wave *iii* to subdivide as it drops, in a 5 wave impulsive sequence. Although on the Intraday Chart it is not clear, but it could be possible that we have the following count within wave *iii*:
^i^ = 97.03;
^ii^ = 97.70, if complete, although this rally is a little short of our 50% retracement level which is 97.81.
^iii^ drop is now.
It could be possible that wave ^ii^ is going to become more complex and rally back to the 97.70 high, but more likely at least to our 50% retracement level of 97.81, before all of that wave ends, and wave ^iii^ lower begins.
Projections for the end of wave *iii* are:
*iii*= 1.618*i*=91.03;
*iii*= 2.618*i* = 86.36
Our current count for wave -c- is:
.i. = 97.59;
.ii. = 99.95
.iii.:
*i*:
^i^ = 98.45;
^ii^ = 99.88;
^iii^ = 96.04;
^iv^ = 97.50:
^v^ = 95.28, to complete all of wave *i*;
*ii* = 98.59;
*iii* is now underway, and now subdividing.
We have the following projections of all of the wave .iii. drop:
.iii. = 1.618.i. = 94.53;
.iii. -= 2.618.i. = 91.18;
.iii. = 4.236 i = 85.76.
We lowered our stop on our short positions to 98.60, in the Morning Post.
Long-Term Trading Update
We should be falling sharply in wave .iii. in the next couple of weeks or months. Within wave .iii., we are now falling in wave *iii*, with wave *ii* ending at 98.59.
Active Trading Positions: We are short at 97.90, risking to 98.60!
NG
Short-Term Update
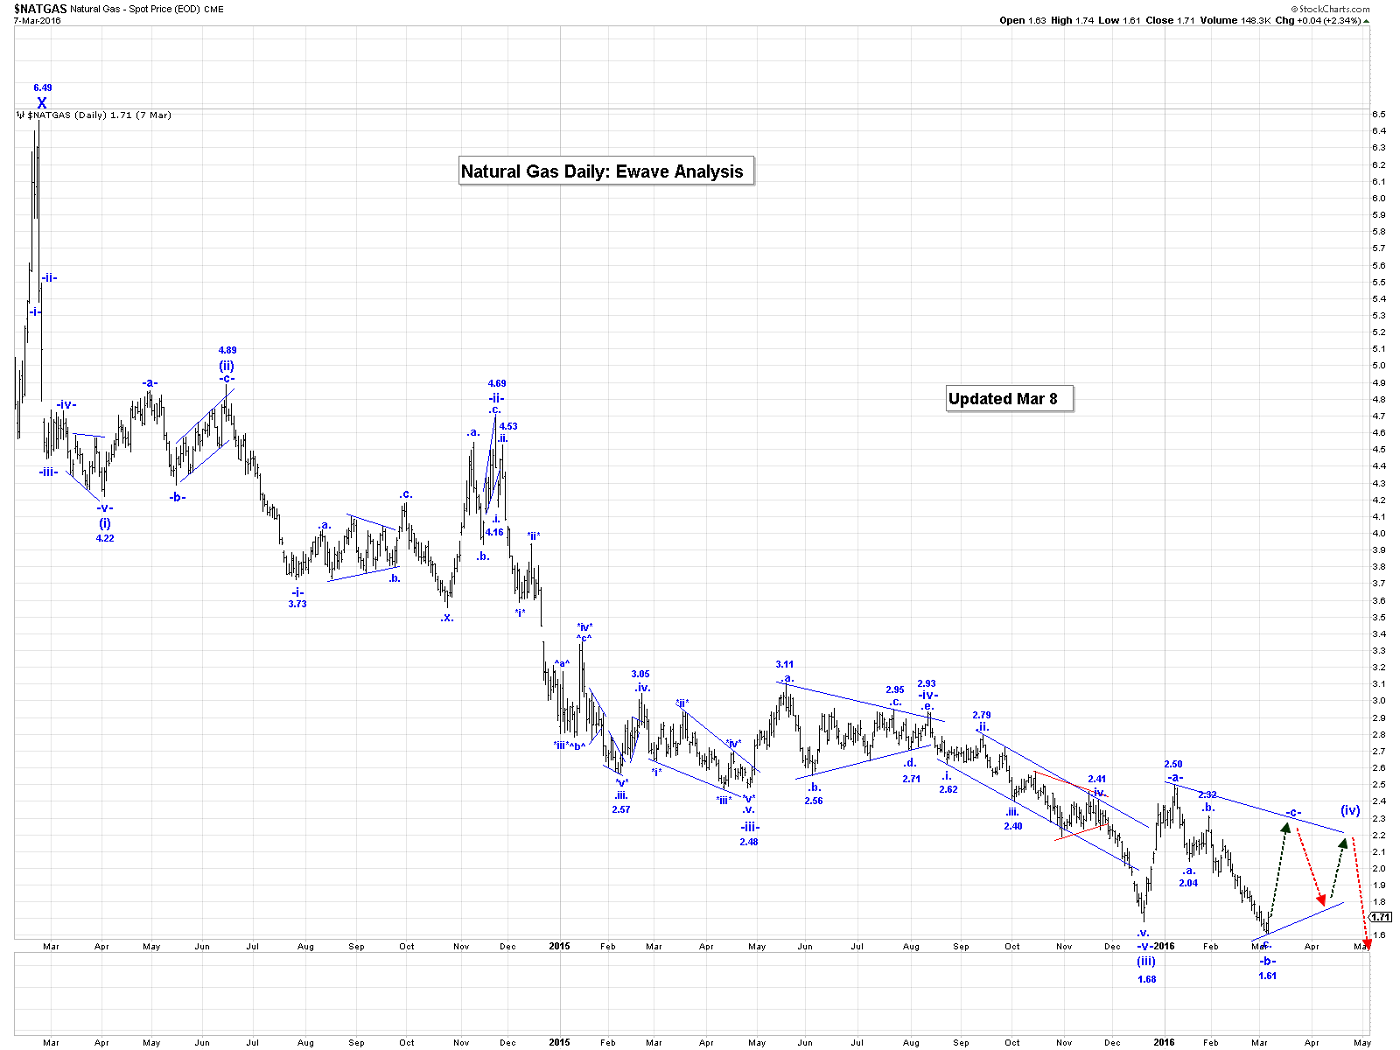
NG rallied back to the 1.740 high in the overnight session, at the time that this Post was being written. We could now be rallying in wave -c- of our wave (iv) triangle. That triangle looks like:
-a- = 2.50;
-b- = 1.61, if complete;
-c- rally is now underway.
Wave -c- cannot rally above the wave -a- high of 2.50, for our current triangle formation to remain valid.
The other option is that all of wave (iv) ended at 2.50 and that the current drop is all of wave (v). In this option a major low in NG is at hand, and this low will complete all of our wave a.
The ensuing wave b rally could see NG rally to the 5.50 level!
Long Term Trading Update
It looks like wave (iv) has become a triangle.
Active Trading Positions: Flat!
HUI/GDX and Selected Gold Stocks
If gold breaks above the 1280.60 high, then we should expect sharply higher prices in the GDX and all of our selected gold stocks.
ABX
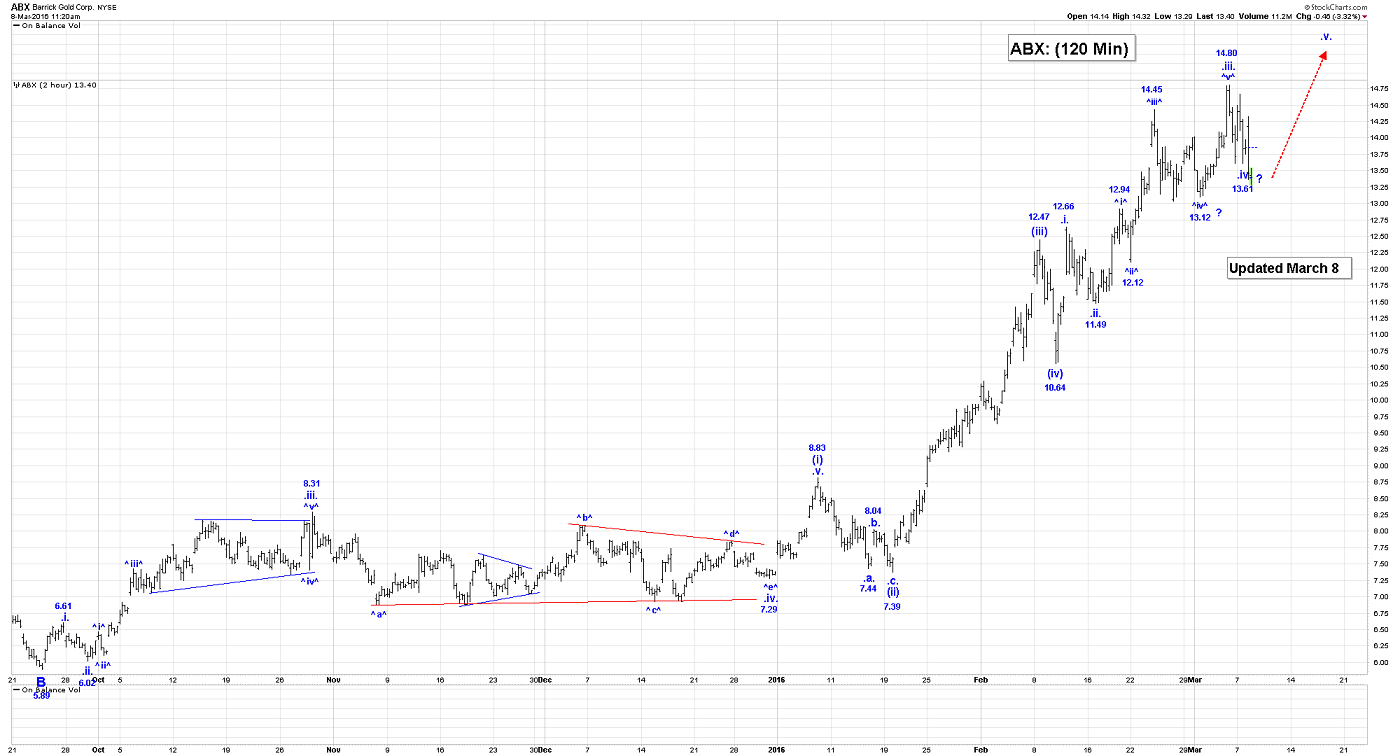
We have attached the 120 Min Chart. In the short term, we are not sure that all of wave ^iv^ is complete at the 13.13 low, which would then through into questions whether wave .iii. ended at 14.80 and the wave .iv. low of 13.61.
We will need to see how this market trades in the next few days or so, so hopefully clear up the short term analysis.
Our current count is:
.i. =12.66;
.ii. = 11.49.
.iii.:
^i^ =12.94;
^ii^ = 12.12;
^iii^= 14.45;
^iv^ = 13.12;
^v^= 14.80, if complete, to complete all of wave .iii.
.iv. =13.61, if complete.
.v. is next.
GDX
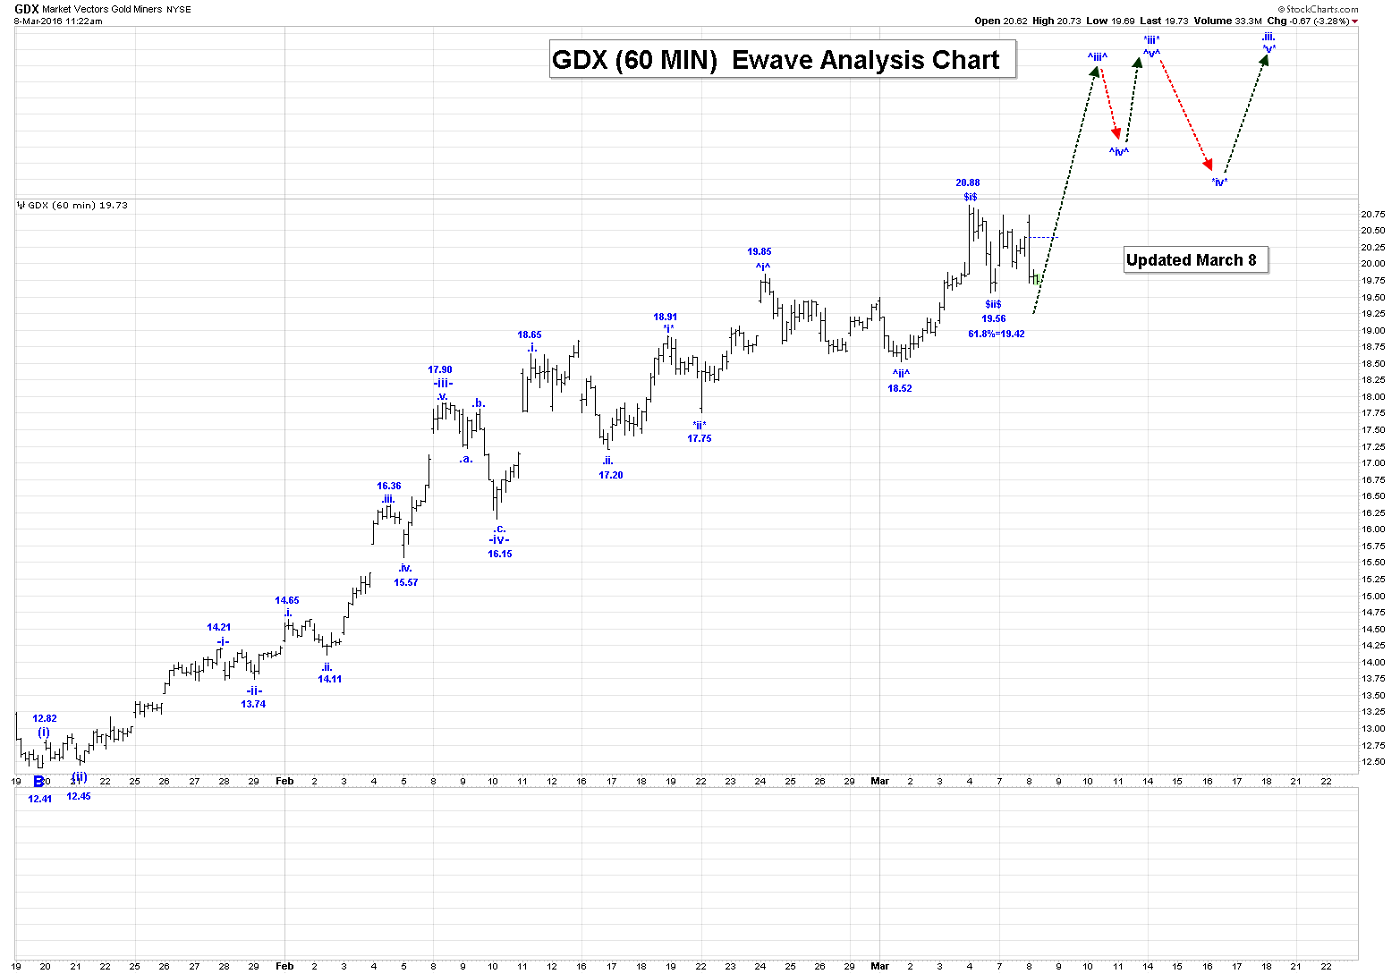
Our current count within wave ^iii^ looks like:
$i$ = 20.88;
$ii$ = 19.56, if complete. Note the 61.8% retracement level is 19.42.
$iii$ rally is next.
SSO (Silver Standard): Ewave analysis is coming soon, as it appears to be buying out Claude Resources.
Long-Term
The GDX and all of our selected stocks/indices have finally completed their respective wave B lows. We are still expecting higher prices, as we complete our first impulsive sequence out of their respective wave B lows.
Active Trading Positions: We are long the GDX, ABX, KGC, NEM, CRJ, and TSX:XGD with no stops!
********
Email: [email protected]
Website: www.captainewave.com
Risk: CAPTAINEWAVE.COM IS AN IMPERSONAL ADVISORY SERVICE. AND THEREFORE, NO CONSIDERATION CAN OR IS MADE TOWARD YOUR FINANCIAL CIRCUMSTANCES. ALL MATERIAL PRESENTED WITHIN CAPTAINEWAVE.COM IS NOT TO BE REGARDED AS INVESTMENT ADVICE, BUT FOR GENERAL INFORMATIONAL PURPOSES ONLY. TRADING STOCKS DOES INVOLVE RISK, SO CAUTION MUST ALWAYS BE UTILIZED. WE CANNOT GUARANTEE PROFITS OR FREEDOM FROM LOSS. YOU ASSUME THE ENTIRE COST AND RISK OF ANY TRADING YOU CHOOSE TO UNDERTAKE. YOU ALSO AGREE TO BEAR COMPLETE RESPONSIBILITY FOR YOUR INVESTMENT RESEARCH AND DECISIONS AND ACKNOWLEDGE THAT CAPTAINEWAVE.COM HAS NOT AND WILL NOT MAKE ANY SPECIFIC RECOMMENDATIONS OR GIVE ADVICE TO YOU OR ANY OF ITS CLIENTS UPON WHICH THEY SHOULD RELY. CAPTAINEWAVE.COM SUGGESTS THAT THE CLIENT/MEMBER TEST ALL INFORMATION AND TRADING METHODOLOGIES PROVIDED AT OUR SITE THROUGH PAPER TRADING OR SOME OTHER FORM OF TESTING. CAPTAINEWAVE.COM, ITS OWNERS, OR ITS REPRESENTATIVES ARE NOT REGISTERED AS SECURITIES BROKER-DEALERS OR INVESTMENT ADVISORS EITHER WITH THE U.S. SECURITIES AND EXCHANGE COMMISSION OR WITH ANY STATE SECURITIES REGULATORY AUTHORITY. WE RECOMMEND CONSULTING WITH A REGISTERED INVESTMENT ADVISOR, BROKER-DEALER, AND/OR FINANCIAL ADVISOR. IF YOU CHOOSE TO INVEST WITH OR WITHOUT SEEKING ADVICE FROM SUCH AN ADVISOR OR ENTITY, THEN ANY CONSEQUENCES RESULTING FROM YOUR INVESTMENTS ARE YOUR SOLE RESPONSIBILITY.
ALL INFORMATION POSTED IS BELIEVED TO COME FROM RELIABLE SOURCES. CAPTAINEWAVE.COM DOES NOT WARRANT THE ACCURACY, CORRECTNESS, OR COMPLETENESS OF INFORMATION AVAILABLE FROM ITS SERVICE AND THEREFORE WILL NOT BE LIABLE FOR ANY LOSS INCURRED. DUE TO THE ELECTRONIC NATURE OF THE INTERNET, THE CAPTAINEWAVE.COM WEBSITE, ITS E-MAIL & DISTRIBUTION SERVICES AND ANY OTHER SUCH "ALERTS" COULD FAIL AT ANY GIVEN TIME. CAPTAINEWAVE.COM WILL NOT BE RESPONSIBLE FOR UNAVAILABILITY OF USE OF ITS WEBSITE, NOR UNDELIVERED E-MAILS, OR "ALERTS" DUE TO INTERNET BANDWIDTH PROBLEMS, EQUIPMENT FAILURE, OR ACTS OF GOD. CAPTAINEWAVE.COM DOES NOT WARRANT THAT THE TRANSMISSION OF E-MAILS, OR ANY "ALERT" WILL BE UNINTERRUPTED OR ERROR-FREE. CAPTAINEWAVE.COM WILL NOT BE LIABLE FOR THE ACTS OR OMISSIONS OF ANY THIRD PARTY WITH REGARDS TO CAPTAINEWAVE.COM DELAY OR NON-DELIVERY OF THE CAPTAINEWAVE.COM NIGHTLY EMAILS OR "ALERTS". FURTHER, WE DO NOT RECEIVE ANY FORM OF PAYMENT OR OTHER COMPENSATION FOR PUBLISHING INFORMATION, NEWS, RESEARCH OR ANY OTHER MATERIAL CONCERNING ANY SECURITIES ON OUR SITE OR PUBLISH ANY INFORMATION ON OUR SITE THAT IS INTENDED TO AFFECT OR INFLUENCE THE VALUE OF SECURITIES.
THERE IS NO GUARANTEE PAST PERFORMANCE WILL BE INDICATIVE OF FUTURE RESULTS. NO ASSURANCE CAN BE GIVEN THAT THE RECOMMENDATIONS OF CAPTAINEWAVE.COM WILL BE PROFITABLE OR WILL NOT BE SUBJECT TO LOSSES. ALL CLIENTS SHOULD UNDERSTAND THAT THE RESULTS OF A PARTICULAR PERIOD WILL NOT NECESSARILY BE INDICATIVE OF RESULTS IN FUTURE PERIODS. THE RESULTS LISTED AT THIS WEBSITE ARE BASED ON HYPOTHETICAL TRADES. PLAINLY SPEAKING, THESE TRADES WERE NOT ACTUALLY EXECUTED. HYPOTHETICAL OR SIMULATED PERFORMANCE RESULTS HAVE CERTAIN INHERENT LIMITATIONS. UNLIKE AN ACTUAL PERFORMANCE RECORD, SIMULATED TRADES DO NOT REPRESENT ACTUAL TRADING. ALSO, SINCE THE TRADES HAVE NOT ACTUALLY BEEN EXECUTED, THE RESULTS MAY HAVE OVER OR UNDER COMPENSATED FOR THE IMPACT, IF ANY, OF CERTAIN MARKET FACTORS SUCH AS LACK OF LIQUIDITY. YOU MAY HAVE DONE BETTER OR WORSE THAN THE RESULTS PORTRAYED. NO REPRESENTATION IS BEING MADE THAT ANY ACCOUNT WILL OR IS LIKELY TO ACHIEVE PROFITS OR LOSSES SIMILAR TO THOSE SHOWN. NO INDEPENDENT PARTY HAS AUDITED THE HYPOTHETICAL PERFORMANCE CONTAINED AT THIS WEBSITE, NOR HAS ANY INDEPENDENT PARTY UNDERTAKEN TO CONFIRM THAT THEY REFLECT THE TRADING METHOD UNDER THE ASSUMPTIONS OR CONDITIONS SPECIFIED HEREAFTER. WHILE THE RESULTS PRESENTED AT THIS WEBSITE ARE BASED UPON CERTAIN ASSUMPTIONS BELIEVED TO REFLECT ACTUAL TRADING CONDITIONS, THESE ASSUMPTIONS MAY NOT INCLUDE ALL VARIABLES THAT WILL AFFECT, OR HAVE IN THE PAST AFFECTED, THE EXECUTION OF TRADES INDICATED BY CAPTAINEWAVE.COM. THE HYPOTHETICAL RESULTS ON THIS WEBSITE ARE BASED ON THE ASSUMPTION THAT THE CLIENT BUY AND SELLS THE POSITIONS AT THE OPEN PRICE OF THE STOCK. THE SIMULATION ASSUMES PURCHASE AND SALE PRICES BELIEVED TO BE ATTAINABLE. IN ACTUAL TRADING, PRICES RECEIVED MAY OR MAY NOT BE THE SAME AS THE ASSUMED ORDER PRICES.


