Technical Analysis Of The Markets


Current Position of the Market
SPX: Long-term trend – We are in an official bear market
Intermediate trend – Concluding initial rally in a downtrend.
Analysis of the short-term trend is done on a daily basis with the help of hourly charts. It is an important adjunct to the analysis of daily and weekly charts which discusses the course of longer market trends.
SPX Rolling Over?
Important Cycles
Next 80-day Hurst (45-td) cycle due ~6/08
Point & Figure Overview of SPX
Intermediate trend: 2650 minimum into 80-day cycle low
Market Analysis (Charts courtesy of QChart)
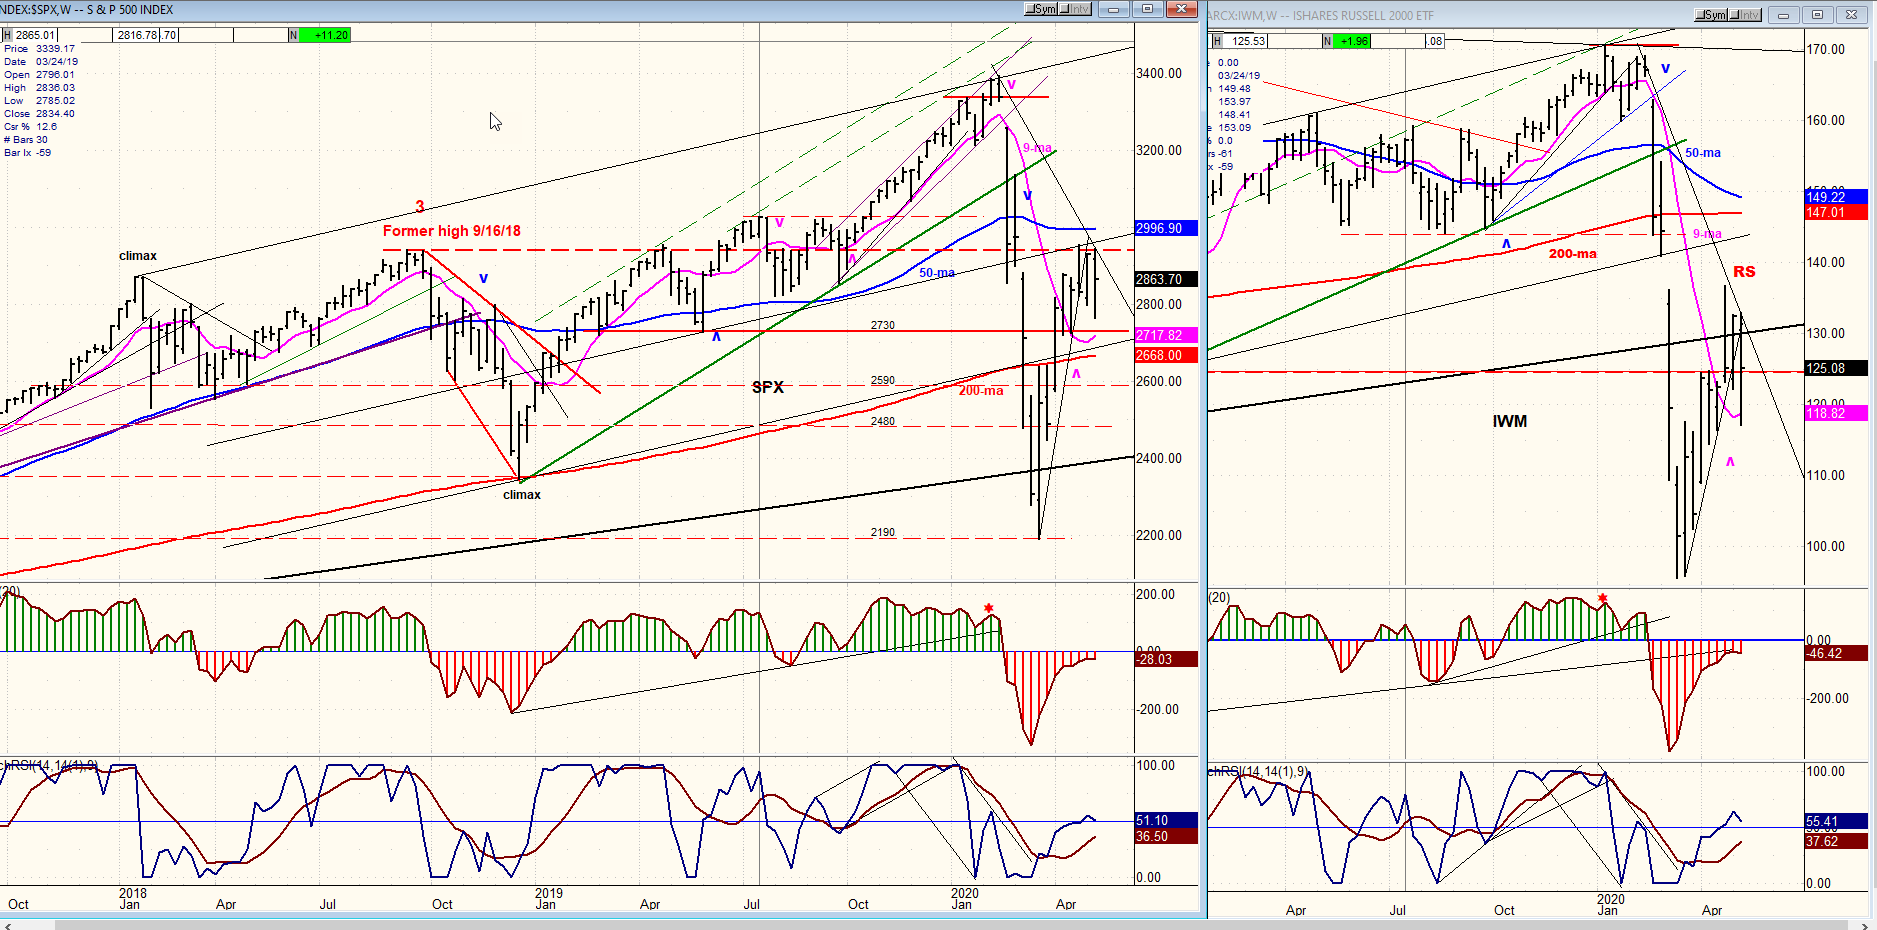
SPX-IWM weekly charts
The indexes made their highs two weeks ago, retested them last week, again found resistance, and closed in the middle of their weekly range. Note that the index made three consecutive weekly attempts at going beyond the 2018 high of 2941 and appears to have given up trying. This is a sign that the Hurst 80-day cycle is beginning to bring pressure on prices which should intensify and last into early June.
The P&F chart has made a top formation which could turn out to be a warning that a severe decline lies ahead. This formation is made up of several phases and the current phase from which the downside projection is derived has a minimum count to 2650. This represents the amount of selling pressure available to the next 80-day cycle, but it could legitimately be expanded to 2560 and even 2500 if 2650 is reached ahead of the cycle bottom.
IWM continues to lead SPX on the downside, both at the weekly and daily time frames.
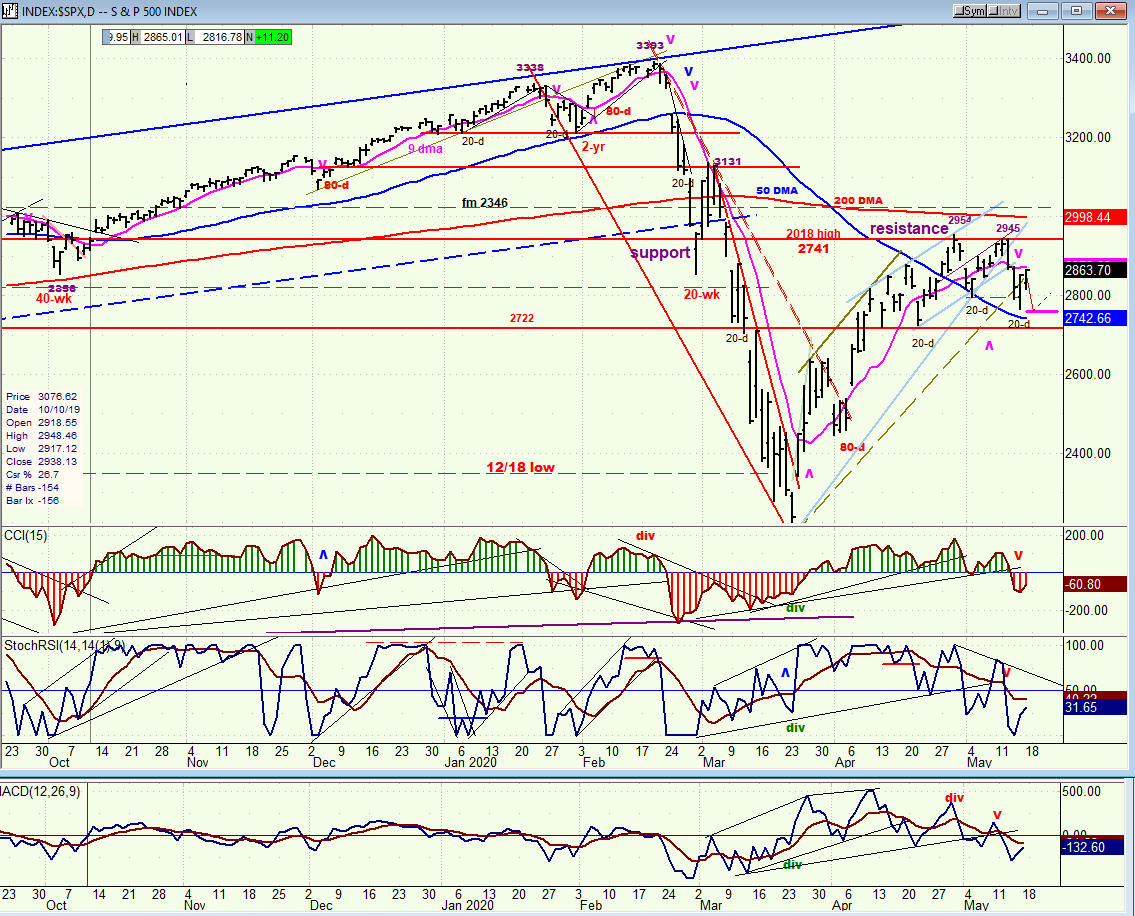
SPX daily chart
When SPX first declined from 3393, it found support at the October 2018 high of 2941 and bounced almost a hundred points to 3131 before dropping below it like a ton of lead! After regaining its footing at 2192 it rallied to 2641 before being pulled back down to 2447 by the previous 80-day cycle. That pull-back created a consolidation pattern on the P&F chart which gave us a count projecting the next move to ~2930. That target was very close to the former 11/18 high of 2941, suggesting that this is the area where SPX would next find resistance. Sure enough, after spending about two weeks at that level, first reaching 2955 before pulling back, and then 2945 on a second attempt, SPX is now beginning to succumb to the pressure exerted by the current 80-day cycle which is in its down phase and expected to bottom in the first week of June
Just as the count across the accumulation pattern of the P&F chart at 2447 provided us with an upside target to about 2930, the distribution pattern at the 2945 level is giving us a minimum target of 2650 (and probably lower) for the 80-day cycle low. Obviously, for these projections to be realized, it will be necessary for SPX to decline below 2720 over the next few days (we’ll discuss why that level is important when we analyze the hourly chart.) If 2720 holds and time is spent trading above it, we may only achieve 2650 by the time the 80-day cycle (aka 45-td cycle) makes its low.
The odds that SPX will continue its countertrend rally beyond 2955 are virtually nil! The best reason for this is that the daily indicators have given a sell signal and are showing no inclination to reverse, even after a hundred-point rally.
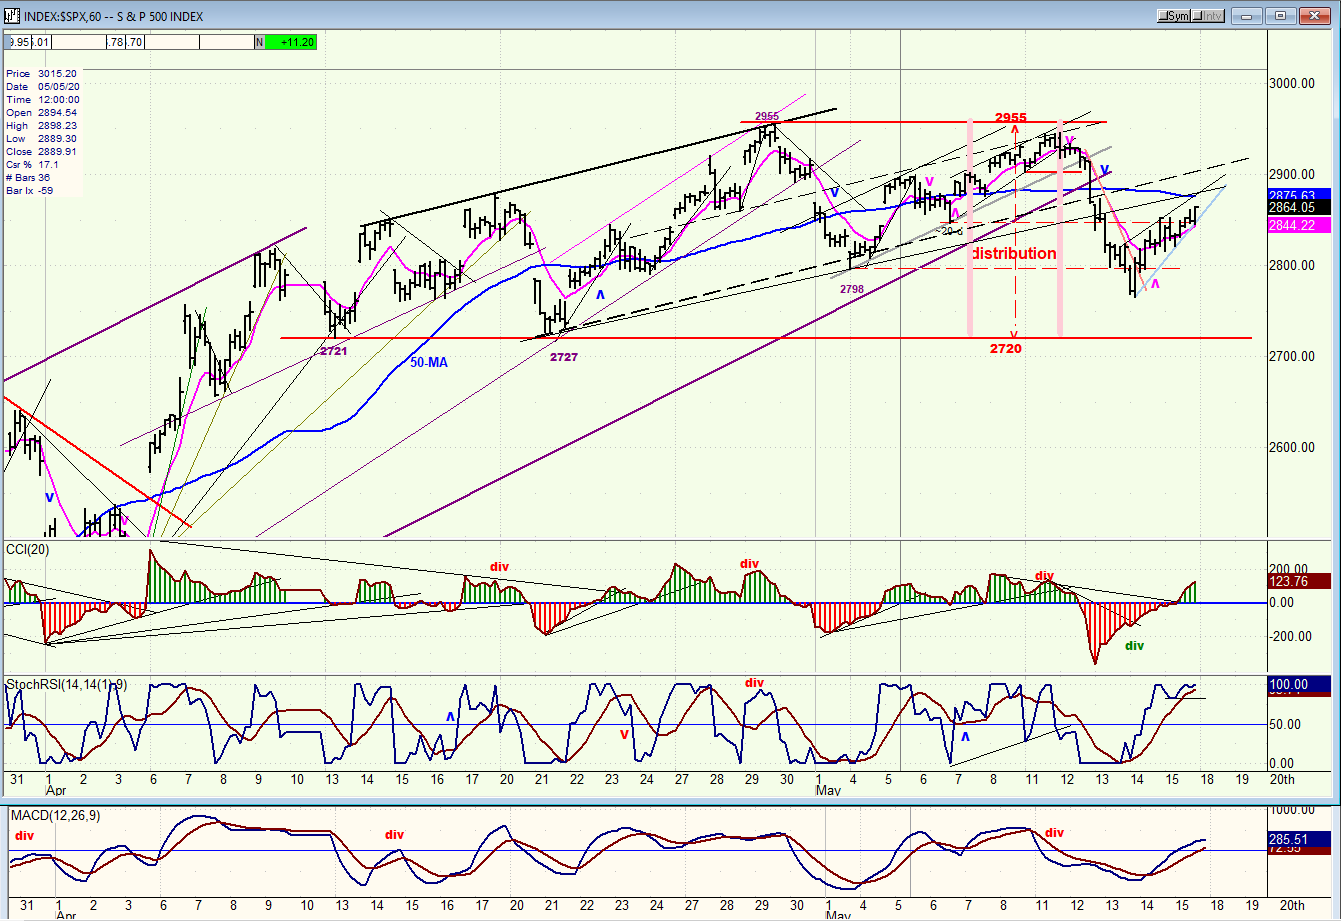
SPX hourly chart
What happens over the next few days will be important in assessing what will transpire between now and the middle of the year. The more weakness we experience over the short-term, the more weakness we should experience over the intermediate term! A move below 2720 over the next few days could indicate that the entire pattern above 2720 is distribution, projecting a potential new low into mid-July.
SPX is currently rebounding after its decline from 2945. As stated above, the odds are very much against continuing the countertrend pattern which started from 2192, but it could still rally a few more points before reversing. There is no divergence at the hourly level, yet; perhaps none is needed with the daily indicators in a sell mode. We’ll find out as early as Monday.
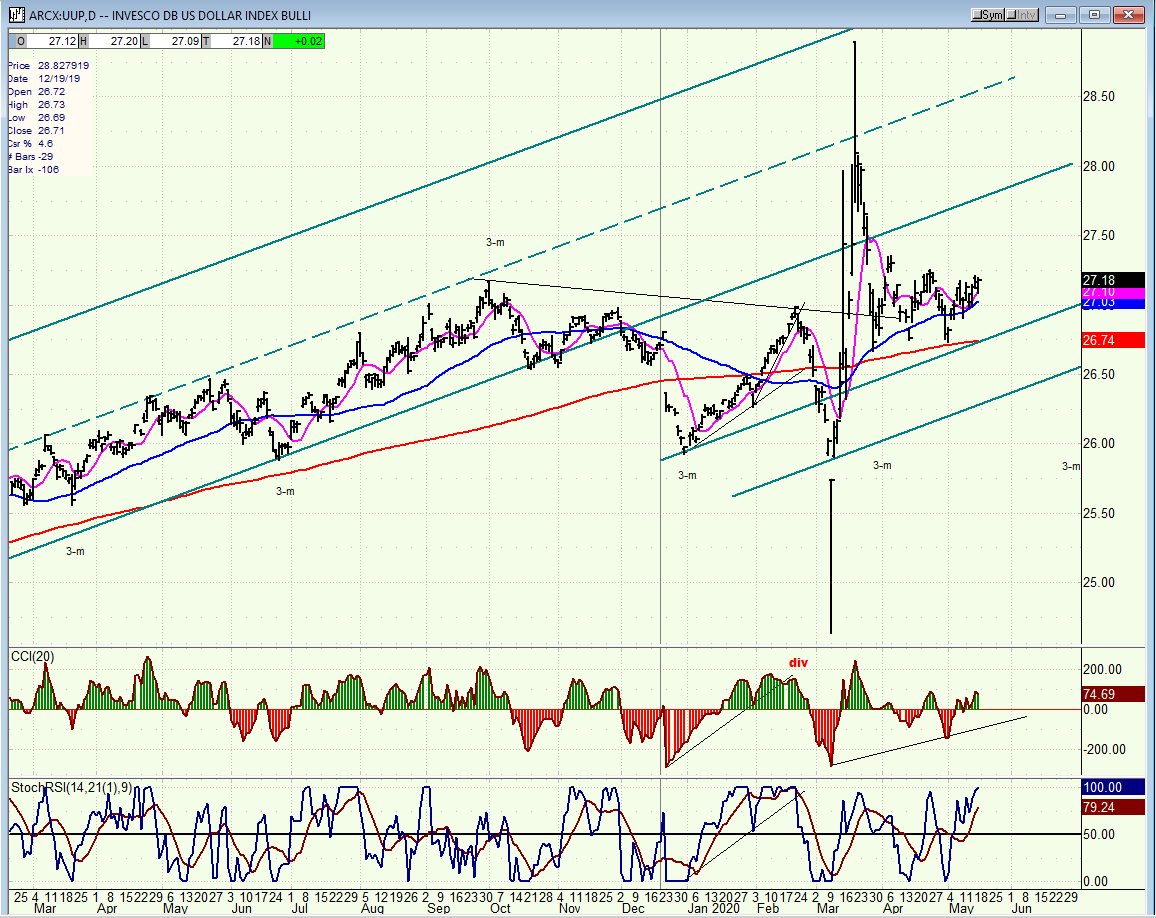
UUP (dollar ETF) daily
After swinging wildly and abnormaly in March due to the Fed’s reaction to the economic shock caused by the pandemic, UUP has settled in a more characteristic trading behavior. Last week saw the third upward prong of a tame range-bound pattern but, because it is the third bounce in that pattern – which is normally the last – and the fact that we are past the half-way point of the 3-m cycle, odds favor a pull-back into late June which is the anticipated date of the cycle low.
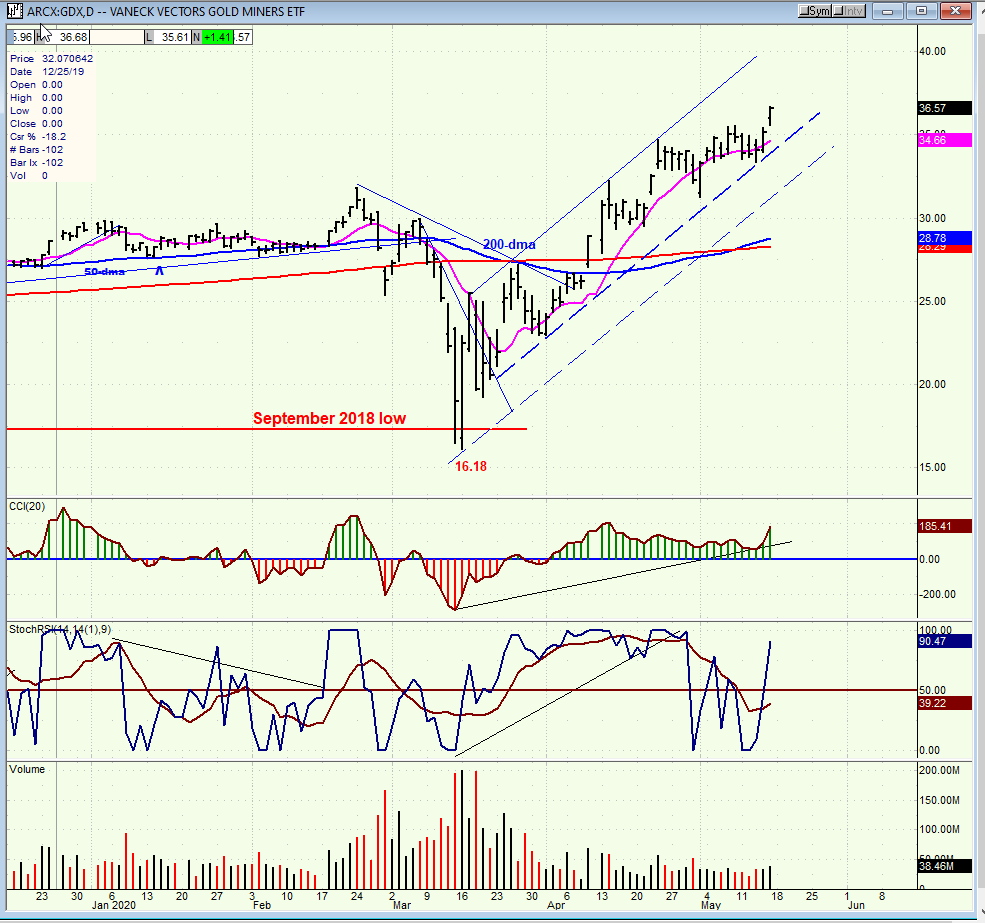
GDX (Gold miners ETF) daily
After a rapid sell-off into March 16 which took it slightly below its November 2018 low, GDX quickly built a base before launching into an uptrend which soon surpassed its previous recovery high of 31.84. The P&F initial target appears to be about 39.00 but the entire base count calls for higher prices.
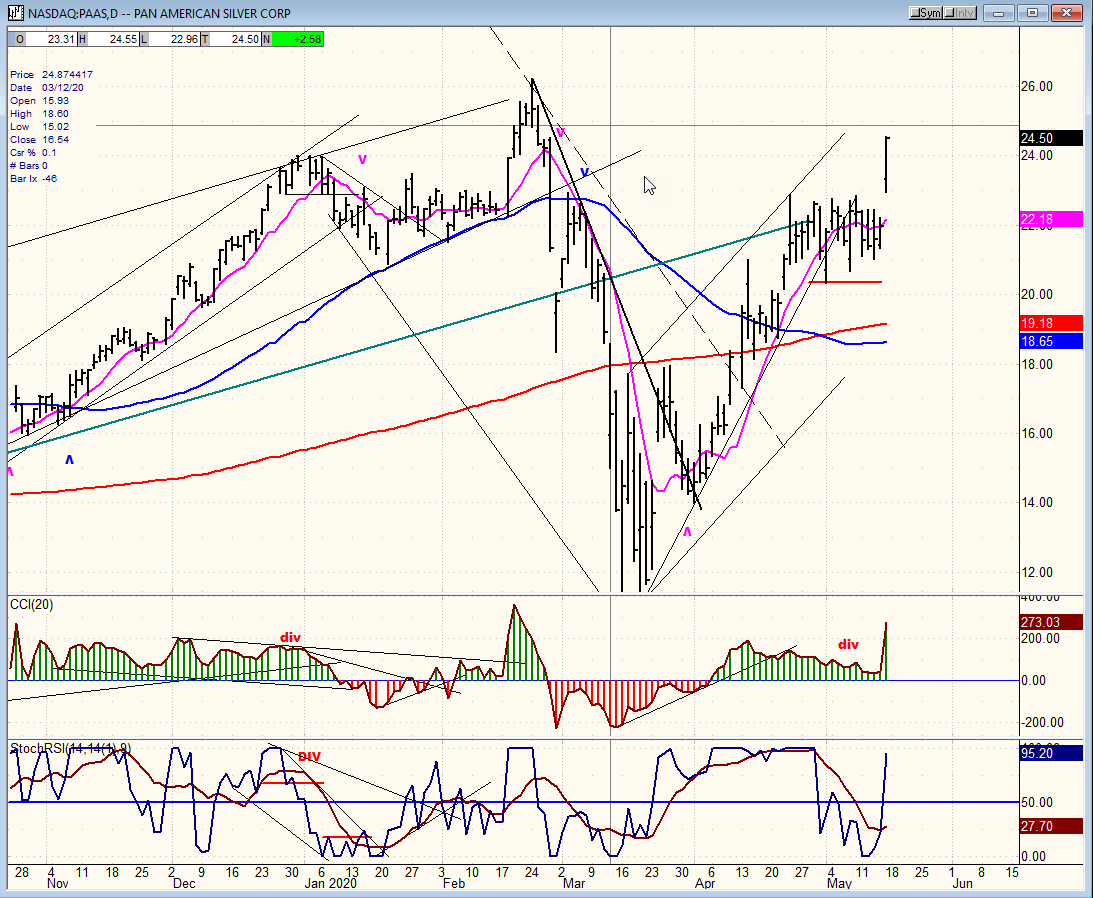
PAAS (Pan American Silver Corp.) daily
PAAS also quickly built a base after a big sell-off and is moving toward its initial target of about 25. However, although it is moving in tandem with GDX, it is still trading below its February high of 26.20, whereby GDX has already surpassed its comparable high. In other words, silver is lagging gold.
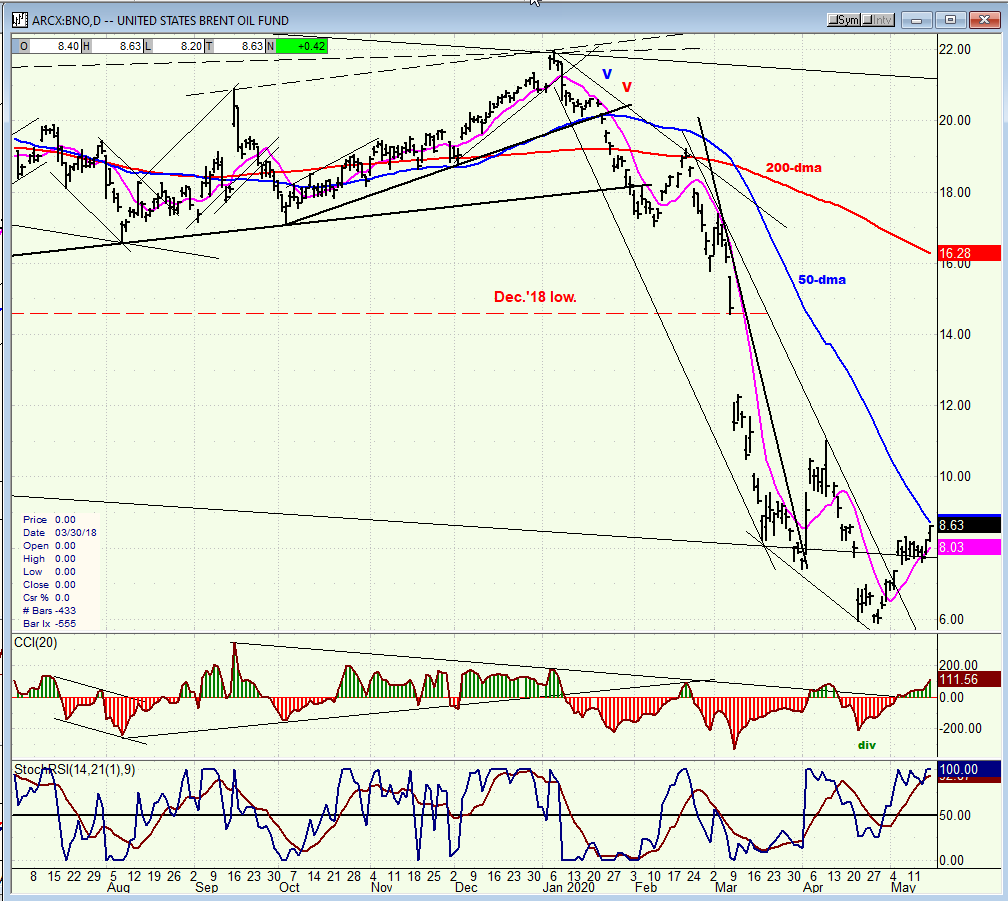
BNO (U.S. Brent oil fund) daily
BNO may have started to build a base, or it is simply rebounding after a big sell-off before making a new low. Whatever the case, for now, the upside is extremely limited.
Summary
The 80-day cycle is likely to have double-topped at 2955-2945 and started its down-phase which should conclude in the first week of June. Projection is likely to be a minimum of 2650.
FREE TRIAL SUBSCRIPTON
With a trial subscription, you will have access to the same information that is given to paid subscribers, but for a limited time period. I think you will find that knowing how far a move can carry is one of the most useful benefits of this service, whether you are a trader or an investor -- especially when this price target is confirmed by reliable indicators which give advance warning of a market top or bottom. Furthermore, cycle analysis adds the all- important time element to the above price projections. For a FREE 4-week trial, further subscription options, payment plans, and for general information, I encourage you to visit my website at www.marketurningpoints.com.
The above comments about the financial markets are based purely on what I consider to be sound technical analysis principles. They represent my own opinion and are not meant to be construed as trading or investment advice, but are offered as an analytical point of view which might be of interest to those who follow stock market cycles and technical analysis.
********

When Andre Gratian was a stock broker years ago, a friend introduced him to technical analysis of the market. Consequently, it is not an exaggeration to say that Andre fell in love with this approach! Ever since then, it has become an increasingly important part of his professional life. Gratian has studied the works of Wyckoff, Edwards & Magee, Edward J. Dewey (cycles) and many others. However, one of my most profitable undertaking has probably been to study Point & Figure charting, which he finds invaluable in analyzing stocks and indices. If he were restricted to one methodology, this is the one that he would choose. This well-rounded background has given him what he feels to be a special insight into the stock market, facilitating the recognition of meaningful patterns and the ‘turning points’ in all trends, whether they be short or long term. Andre feels very comfortable discussing the stock market and passing on meaningful information to others. His subscribers include individuals and money managers throughout the world. Moreover, his Newsletters are currently published on several financial sites, here and abroad.


