Technical Analysis Of The Markets


Current Position of the Market
SPX: Long-term trend – Having rallied well past a .618 retracement of the decline into March 2020, it is time to consider the possibility that the retracement was only an interruption of the bull market which originated in 2009.
Intermediate trend – Still in an uptrend since March
Analysis of the short-term trend is done daily with the help of hourly charts. It is an important adjunct to the analysis of daily and weekly charts which discusses the course of longer market trends.
SPX about to Challenge 8/08 High
Important Cycle lows
40-wk cycle due 7/20 (inverting?)
Market Analysis (Charts courtesy of QChart)
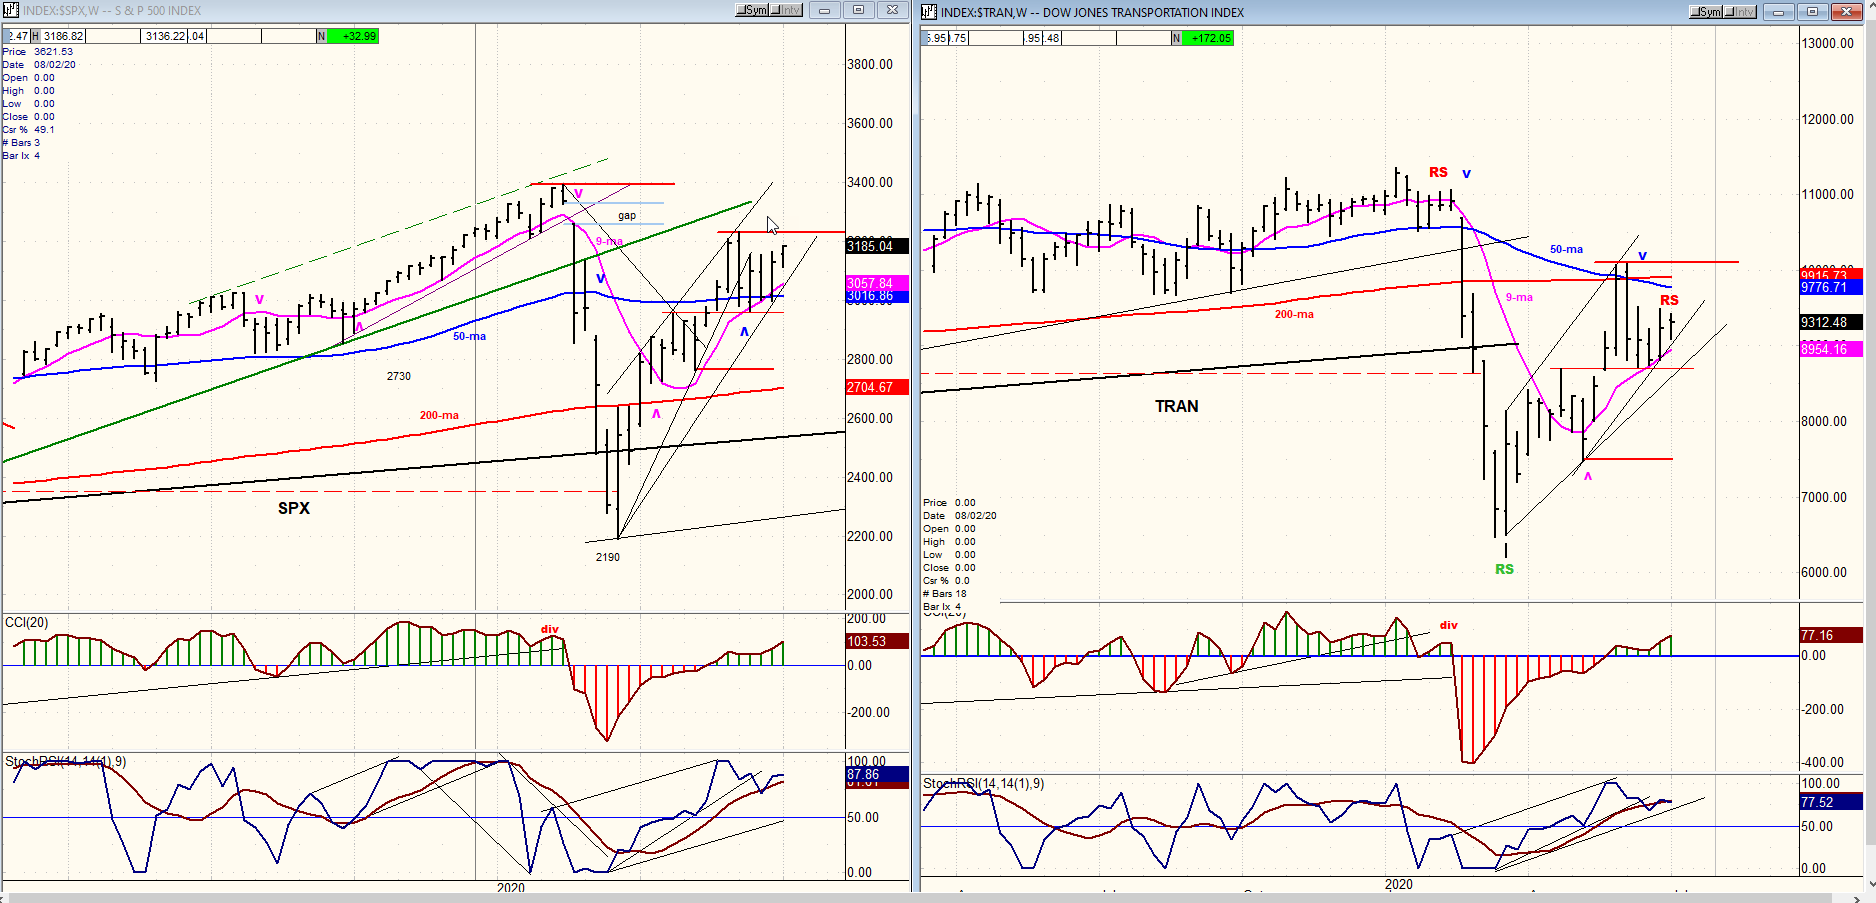
SPX-TRAN weekly charts
SPX made a new 4-week high last week which seems to be the result of the 37-td cycle making its low last week. The 40-wk cycle was expected to make a low in about another week, but Eric Hadik ([email protected]) has suggested that it will make a high instead, this time. He appears to be correct! This means that SPX should proceed to at least 3210 before reversing – as long as TRAN remains negatively divergent over the short-term.
The market has been very responsive to positive economic reports in the past few weeks, but these may soon be replaced by the opposite as unemployment benefits run out at the end of this month.
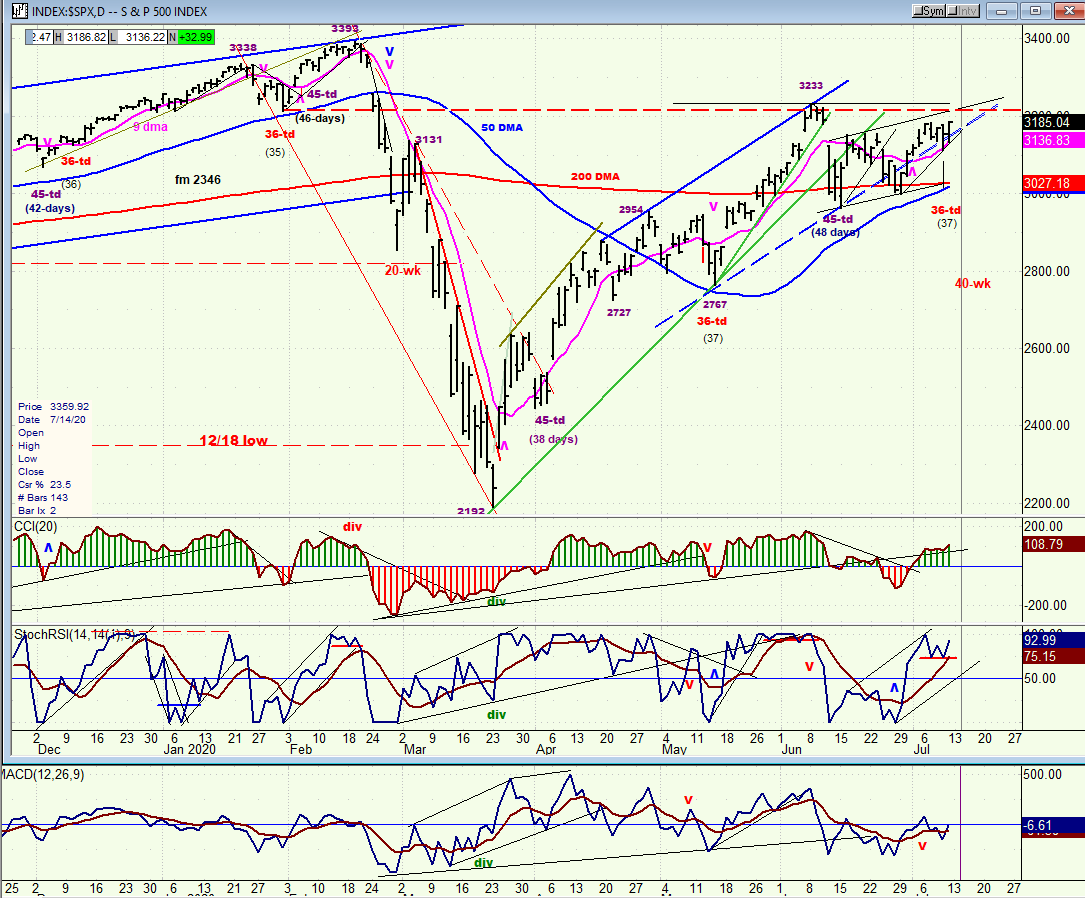
SPX daily chart
The 40-wk cycle was expected to make its next low on ~7/20, but signs that it had peaked and was about to bring a substantial correction never came. In the past couple of weeks, a periodic analysis by Eric Hadik suggested that, (this time) the 40-wk cycle would be making a high, not a low, in this time frame!
It looks like the right call! Last Friday, assisted by the 36/37-td cycle which bottomed during the week, the index made a new short-term high with a strong close at 3185 on Friday. With the short-term projection now pointing to at least 3210, we should expect more upside early next week.
On Tuesday, the hourly indicators gave a sell signal but the daily refused to go along, and the index continued up on its merry way. Until a sell signal at the hourly level is confirmed at the daily and weekly time frames, we cannot expect a meaningful reversal in the indices.
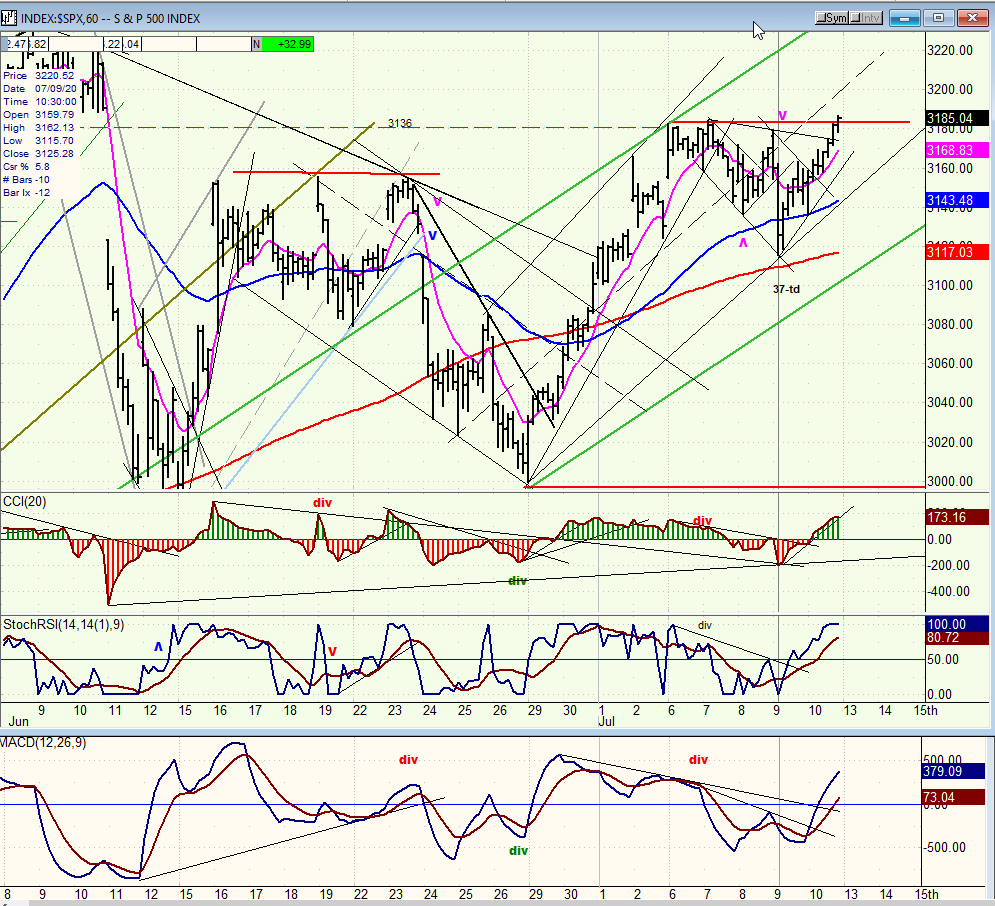
SPX hourly chart
The 37-td cycle low failed to bring about much of a correction and quickly turned prices up. It was a little misleading since it was not preceded by some positive divergence in the CCI, but there was no doubt that another short-term buy signal had been issued when it went green. Early Friday, the index broke out of a consolidation pattern and managed to eke a slightly higher high by the close.
According to the last short-term congestion pattern which formed at 3140, a minimum advance to 3210 is likely based on the strong count alone but stopping at that level is not guaranteed. IWM, TRAN and DJIA are all much weaker than SPX, which continues to be driven by NDX. But QQQ (264.31) may have a valid projection to about 236. If this turns out to be a high, we can expect SPX to reverse when it has met the 3210-15 target. If the 37-td cycle cannot push prices beyond that level, it will be a sign that bearish forces are about to assume control.
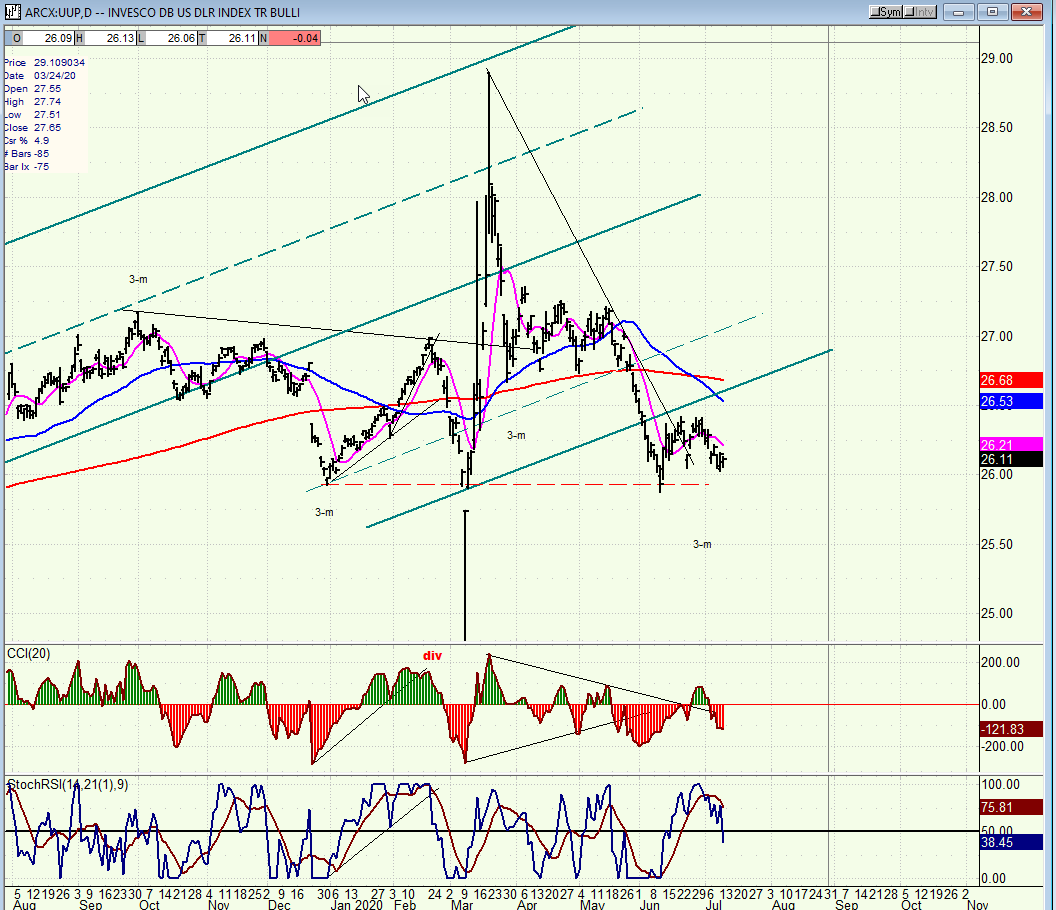
UUP (dollar ETF) daily
UUP has made a low in the vicinity of its 3-mo cycle. If it has the same effect on prices as most previous ones, a longer holding pattern, and perhaps a short-term uptrend should be generated as long as the cycle remains in an up-phase.
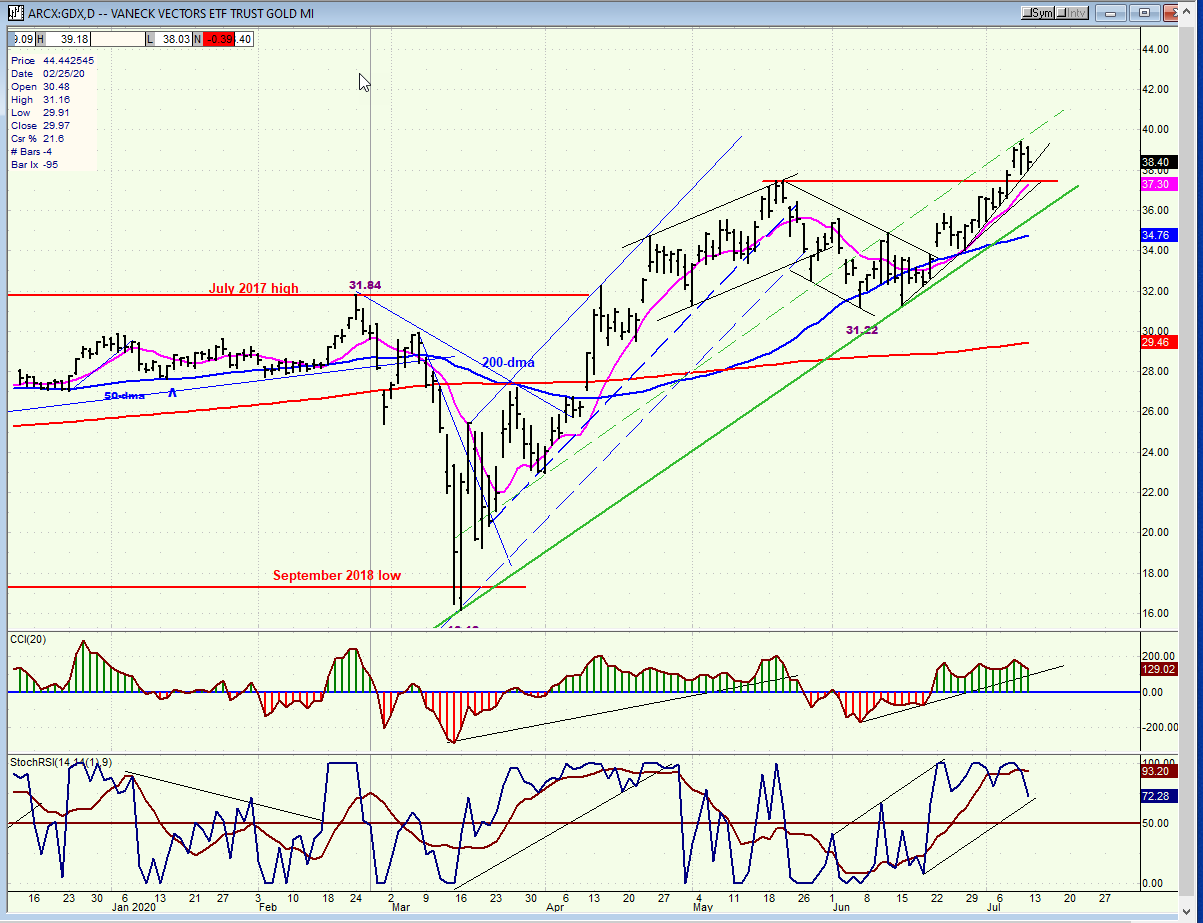
GDX (Gold miners ETF) daily
GDX could still push to 40 (which is the ideal short-term target) before correcting. The oscillators have started to look toppy…but would have to decline further to suggest that a reversal is taking place.
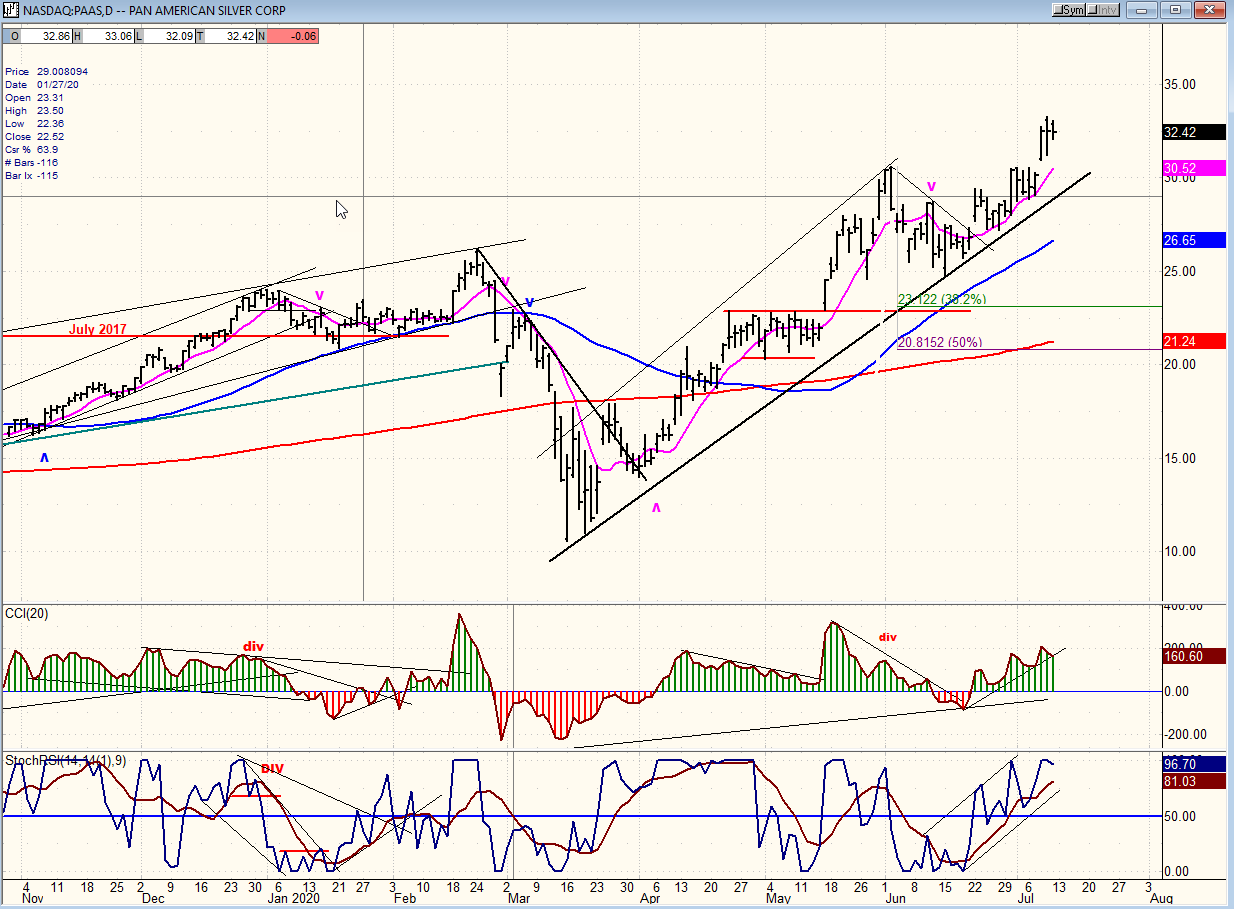
PAAS (Pan American Silver Corp.) daily
PAAS continues to make a chart pattern which is identical to that of GDX. Therefore, the same analysis can be applied. It too could move slightly higher before correcting.
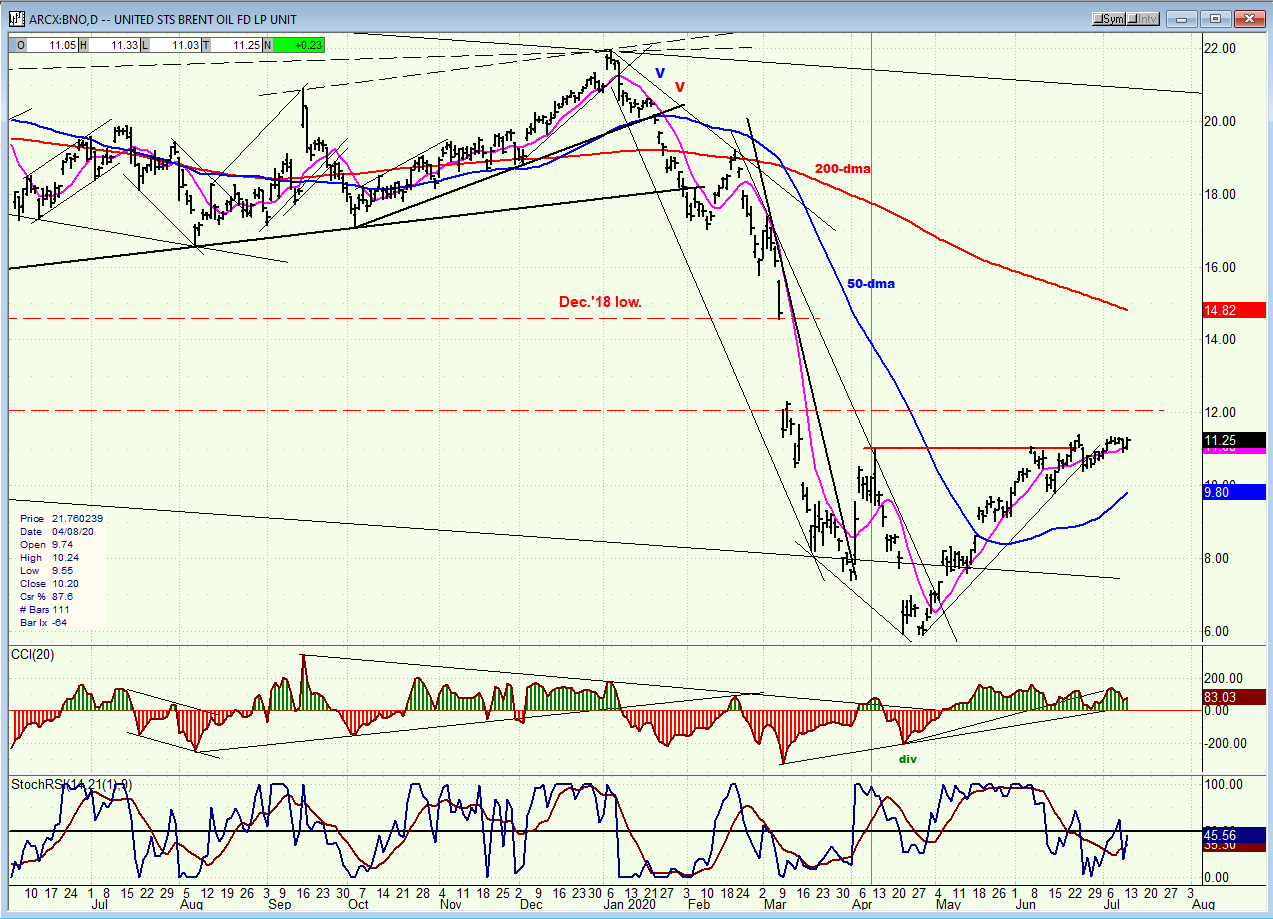
BNO (U.S. Brent oil fund) daily
BNO will hold up as long as the market does; but very strong resistance starting at about 12.00 reduces the possibility of improving its price by more than a small margin before pulling back to build a larger base.
Summary
Acknowledging Eric Hadik’s analysis that the 40-week cycle is in an inverted mode appears to be the correct step to take. We do not yet know how much weakness will come into the market after the inversion, but a clear warning that a significant correction may be starting would come from IWM if it cannot hold above 147, and then breaks below 144.
FREE TRIAL SUBSCRIPTION
With a trial subscription, you will have access to the same information that is given to paid subscribers, but for a limited time period. I think you will find that knowing how far a move can carry is one of the most useful benefits of this service, whether you are a trader or an investor -- especially when this price target is confirmed by reliable indicators which give advance warning of a market top or bottom. Furthermore, cycle analysis adds the all- important time element to the above price projections. For a FREE 4-week trial, further subscription options, payment plans, and for general information, I encourage you to visit my website at www.marketurningpoints.com.
The above comments about the financial markets are based purely on what I consider to be sound technical analysis principles. They represent my own opinion and are not meant to be construed as trading or investment advice, but are offered as an analytical point of view which might be of interest to those who follow stock market cycles and technical analysis.
*********

When Andre Gratian was a stock broker years ago, a friend introduced him to technical analysis of the market. Consequently, it is not an exaggeration to say that Andre fell in love with this approach! Ever since then, it has become an increasingly important part of his professional life. Gratian has studied the works of Wyckoff, Edwards & Magee, Edward J. Dewey (cycles) and many others. However, one of my most profitable undertaking has probably been to study Point & Figure charting, which he finds invaluable in analyzing stocks and indices. If he were restricted to one methodology, this is the one that he would choose. This well-rounded background has given him what he feels to be a special insight into the stock market, facilitating the recognition of meaningful patterns and the ‘turning points’ in all trends, whether they be short or long term. Andre feels very comfortable discussing the stock market and passing on meaningful information to others. His subscribers include individuals and money managers throughout the world. Moreover, his Newsletters are currently published on several financial sites, here and abroad.


