Technical Analysis Of The Markets


Current Position of the Market
SPX Long-term trend: For now, the best guesstimate is that we are still in the bull market which started in 2009.
SPX Intermediate trend: We should be approaching an important high, with confirmation coming over the near term.
Analysis of the short-term trend is done daily with the help of hourly charts. It is an important adjunct to the analysis of daily and weekly charts which discuss longer market trends.
Top Forming
P&F target for near-term top: 3365/3390 (projection met)
Cycle cluster ahead: 45-td cycle ~8/18, 26-day ~8/25, 36-td ~8-31
Market Analysis (Charts courtesy of QCharts
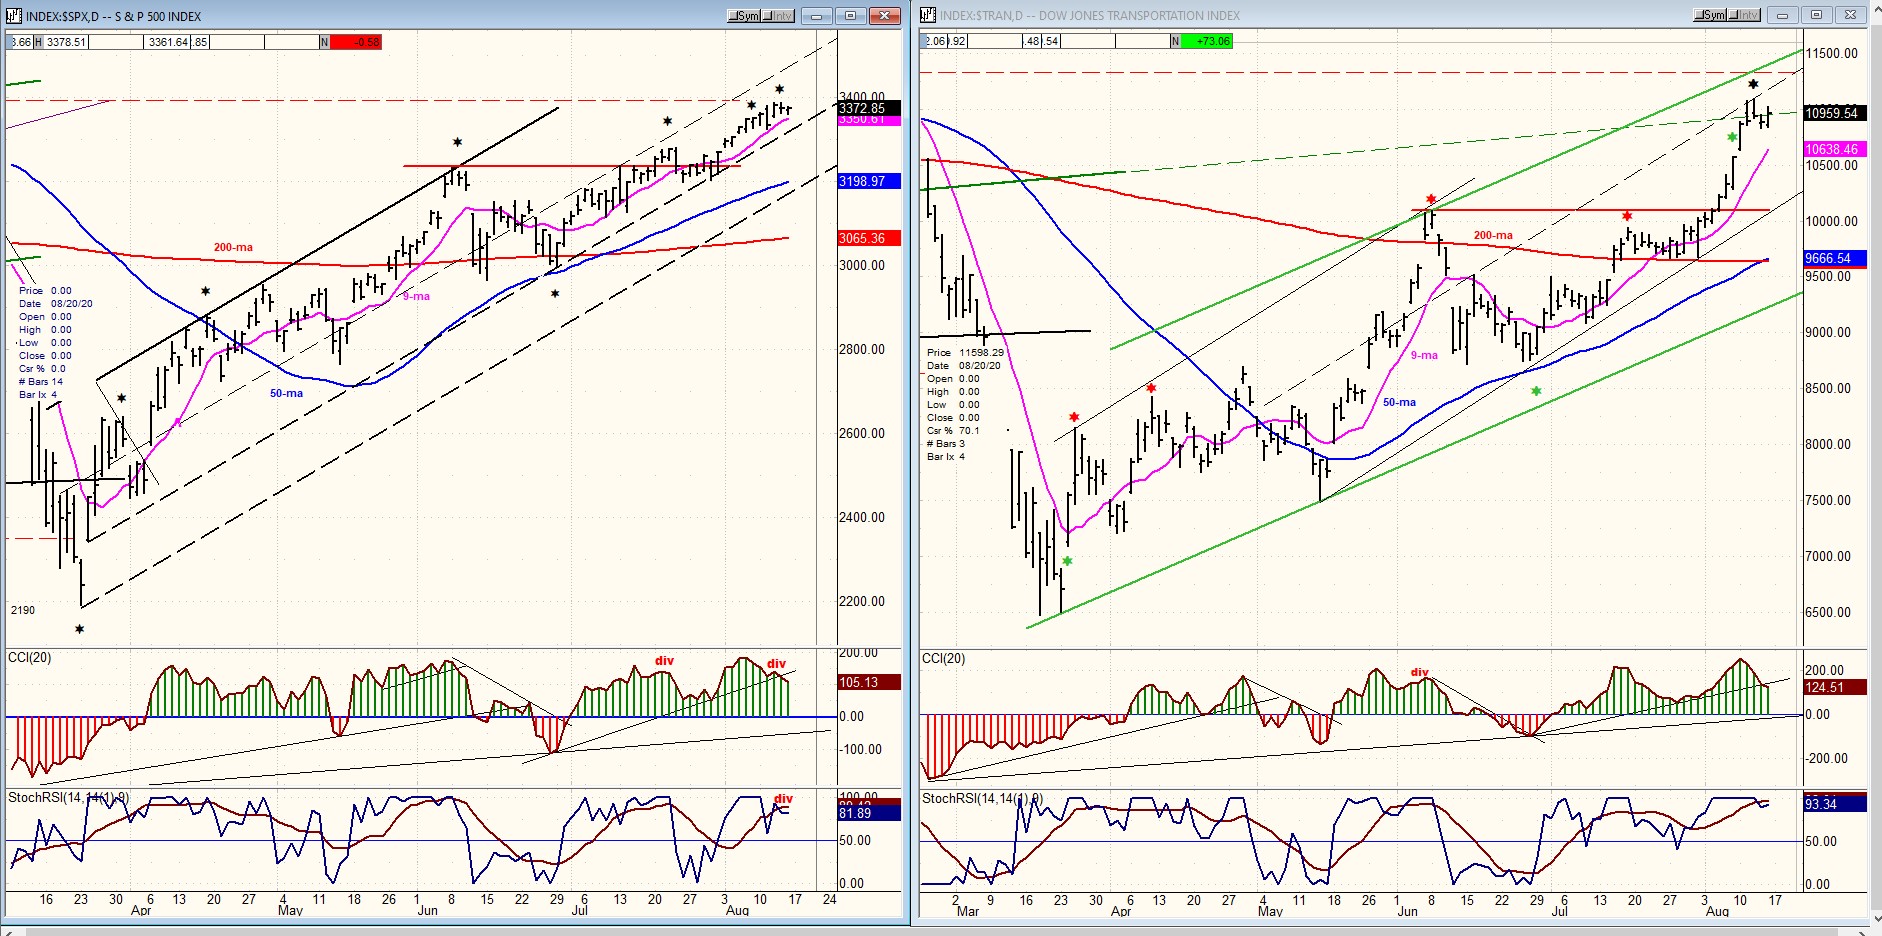
SPX-TRAN daily charts:
Over the short term, TRAN outpaced SPX during the previous week, correctly projecting higher prices ahead, but it settled down to a match last week as we approach a nest of cycle lows which should cause the market to correct over the next couple of weeks. Over the intermediate term, TRAN is still lagging but has made up some of the lost ground. If this continues after this correction is over, it will point to higher prices for the market as a whole.
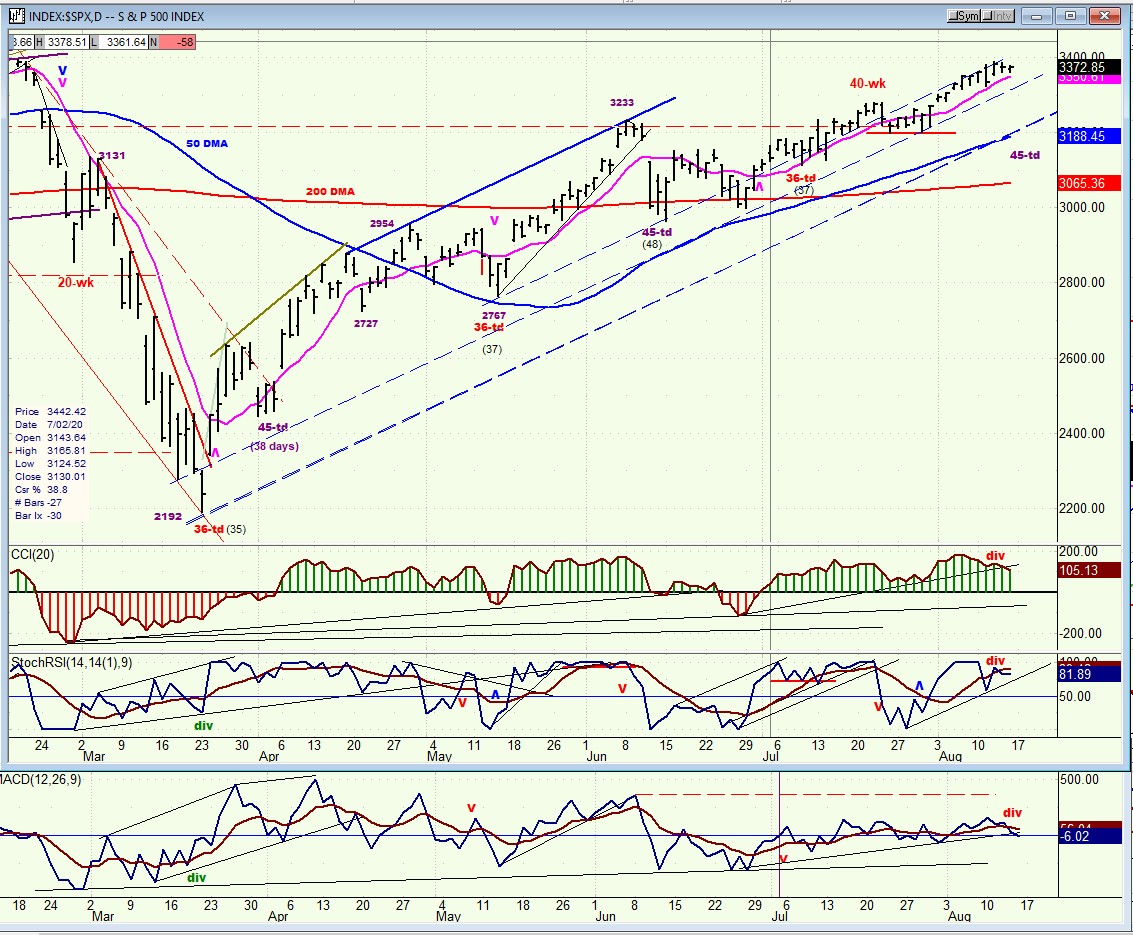
SPX daily chart
The inversion of the 40-wk cycle caused little price disturbance and SPX quickly resumed its uptrend. Now, there are many signs that point to a top which will be followed by a reversal into the nest of collective cycle lows occurring over the next two or three weeks.
First is the fact that the index has essentially met the projection determined by the accumulation pattern that formed above 3000 from mid to late June. The count produced on the Point & Figure chart across that formation gave us a count to about 3390. Last Wednesday, 3387.89 was achieved, followed by two days which managed to hold above the pink 9-dma, ostensibly completing a minor top formation above the 3330 level on the P&F chart.
By the end of the week, some negative divergence was showing on all three oscillators, with the A-Ds closing slightly negative. As we will see next, the hourly chart oscillators have given a sell signal and the declining hourly prices should soon be followed by the daily ones breaking below the 9-dma.
A price reversal which breaks below Tuesday’s minor low of 3326 would confirm the beginning of the anticipated correction which could easily extend to the 200-dma which helped form the low of the previous short-term base around 3000.
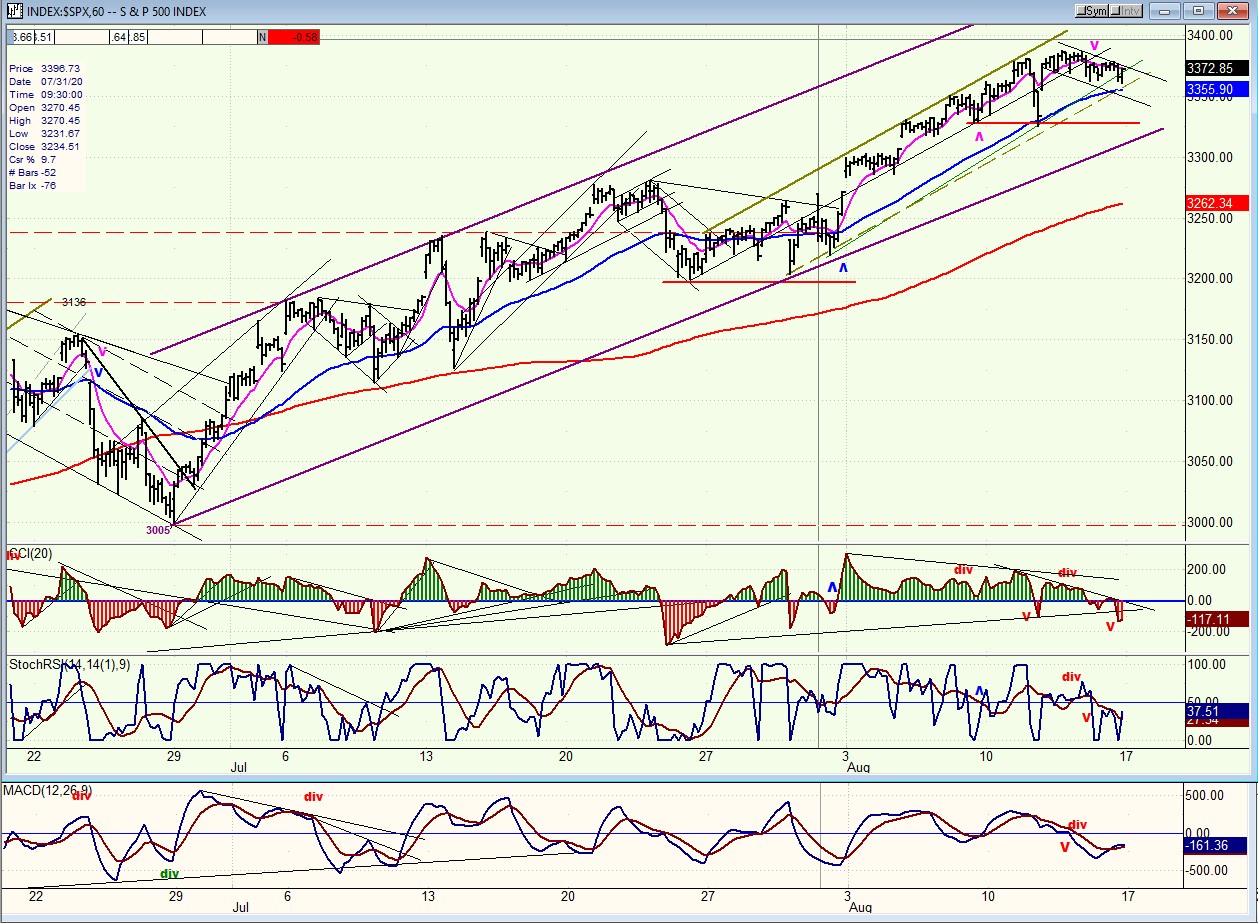
SPX hourly chart
From the low of the base discussed above to the high of the move, we have a perfect channel. The second phase of the larger channel consists of a smaller channel with the blue 50-hr MA running parallel to the bottom of that smaller channel. Friday’s intraday low found support on that MA after giving a sell signal in all three oscillators. It is possible that support from the blue MA will hold a little longer and give us one more move to the top of the range and perhaps a little beyond. There does exist the potential for the index to rally to 3430 (based on a count taken at the March low) before rolling over. But with the first cycle low ideally due on Tuesday, we may already have a high in place.
Whether we make one more minor high or start declining on Monday, a correction is a very high probability and it may already have started last week.
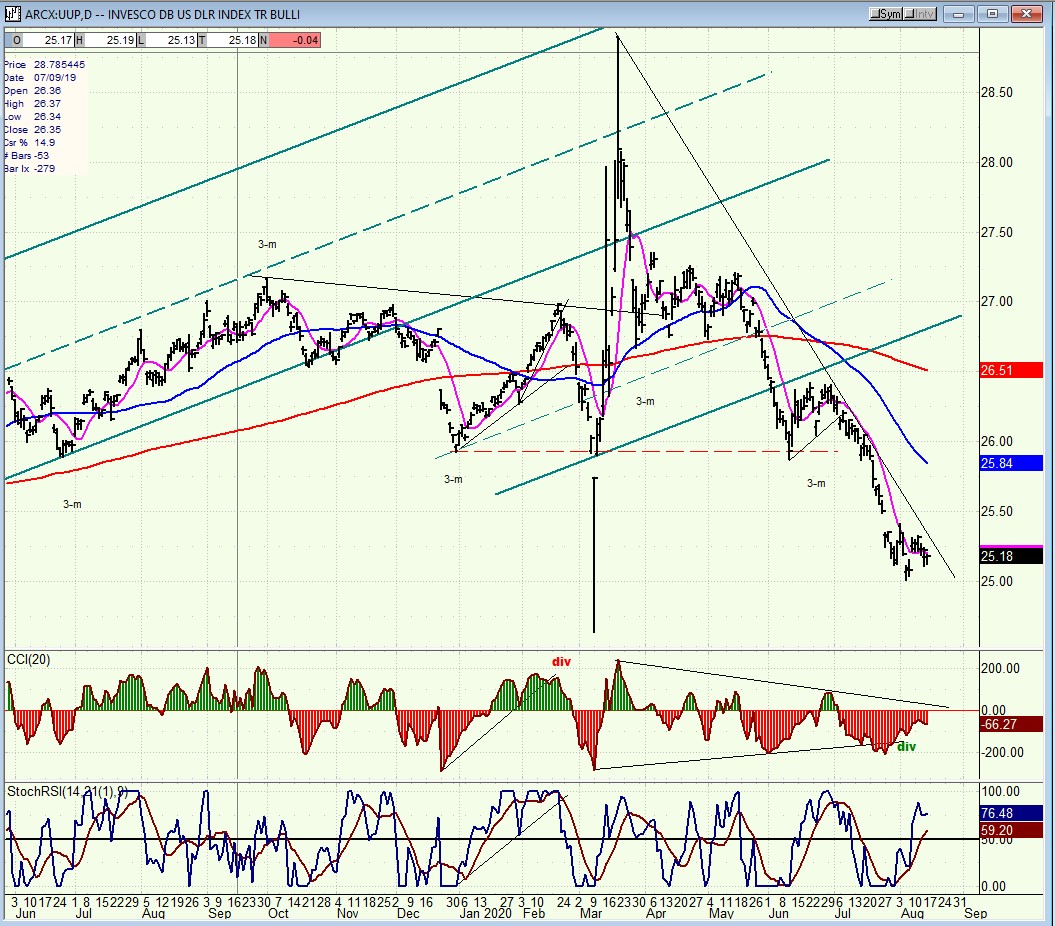
UUP (dollar ETF) ($USD chart not available from this data provider)
A lot of technical damage was done in UUP’s steep correction, and it should take a little while to recover from such a decline. However, the index did meet a projection corresponding to the 93 level on the dollar and is most likely forming a base which should hold this level for some time. A rally back to the dashed line is not impossible.
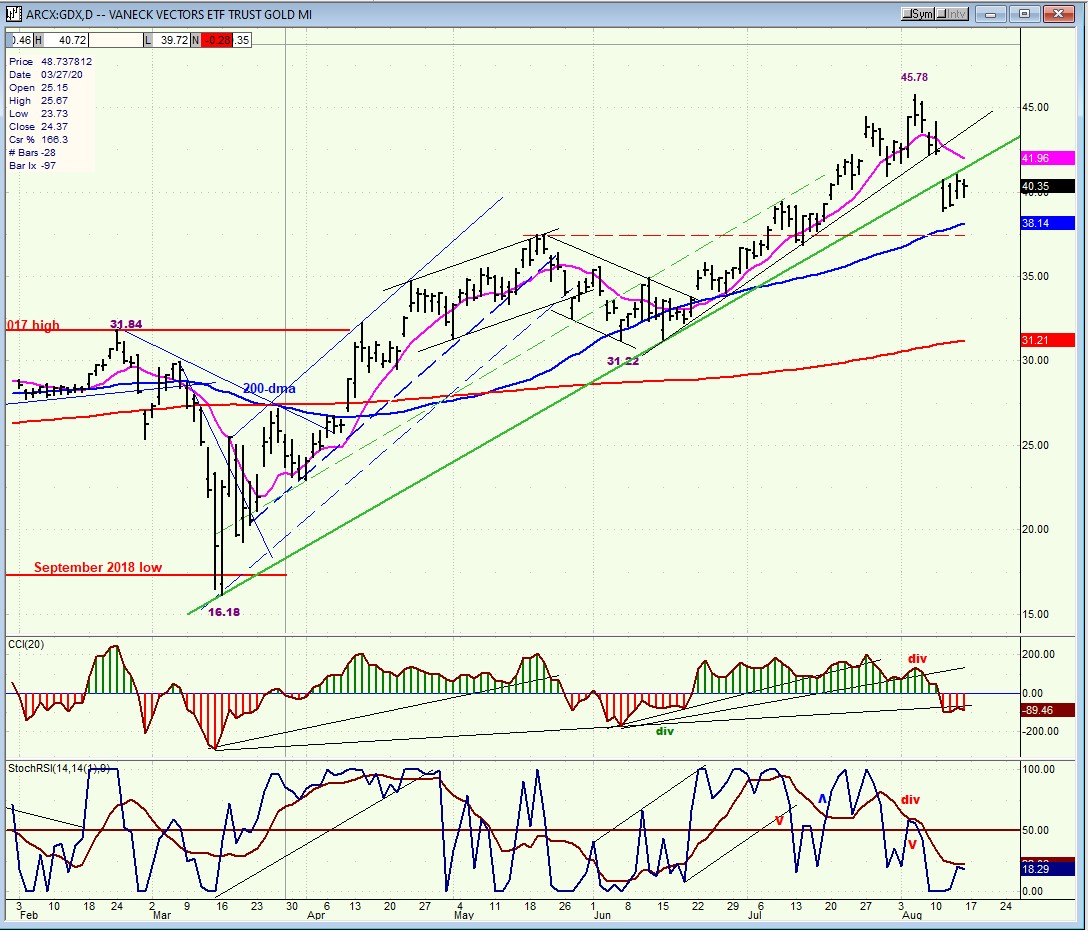
GDX (gold miners)
After nearly tripling in price from its March low, GDX is finally correcting. This is a process which could take several weeks, but 45.78 is definitely not the end of the move. The large base formation should take the index much higher .before it comes to the end of its run. When the present correction is near completion, we will try to estimate the next target based on the P&F count that will have formed at the current level.
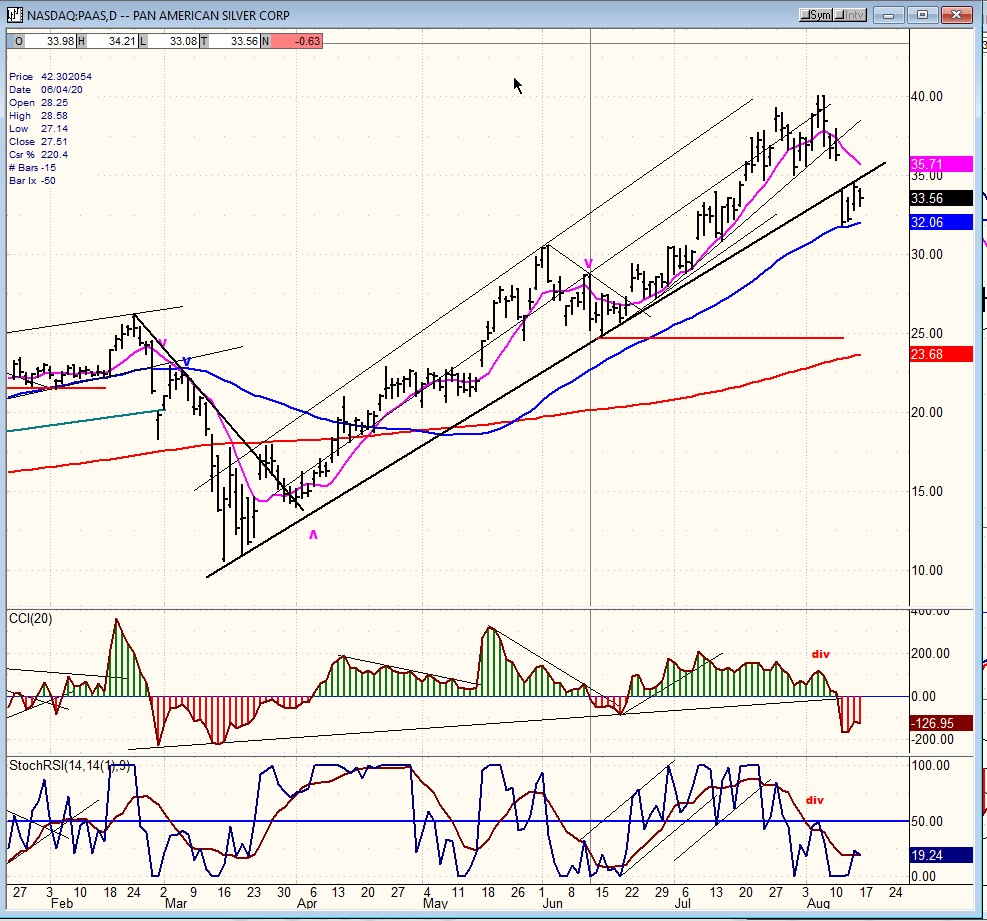
PAAS (Pan American Silver Corp)
PAAS has nearly quadrupled since its March low. Its chart is nearly identical to that of GDX and, like the latter, it is undergoing a consolidation before resuming its uptrend. It too has formed a large base which forecasts much higher prices.
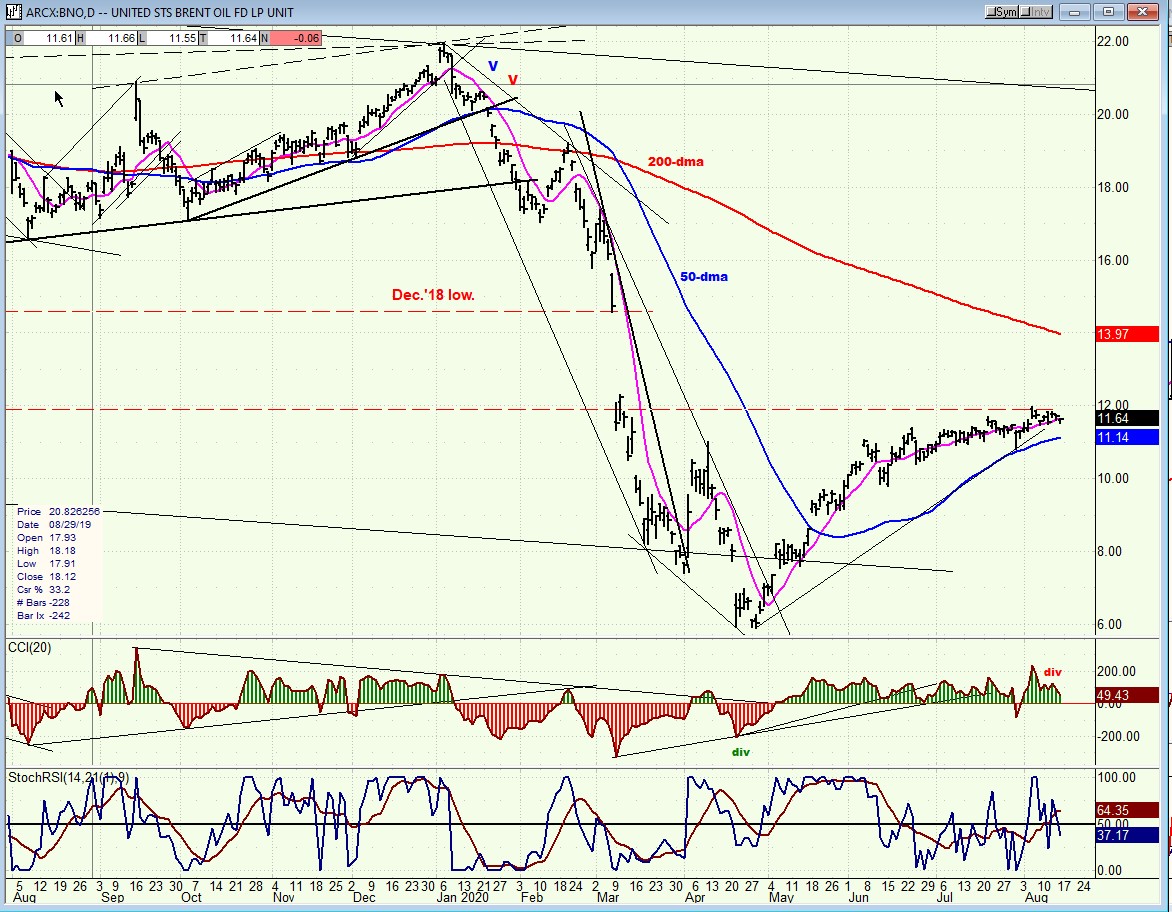
BNO (U.S. Brent Oil fund)
BNO is likely to correct with the market and establish a bigger base. A pull-back which amounts to one third or one half of its rally from 6 is likely before the next uptrend.
Summary
SPX is on the verge of a correction for the reasons given above. Afterwards, it should be ready to make another all-time high, perhaps by a good margin. At least, this is what various methodologies suggest. Primary among these is the view of EWT technicians who see the March correction as the probable completion of the 4th wave of the bull market which started in 2009.
Free trial subscription
With a trial subscription, you will have access to the same information that is given to paid subscribers, but for a limited time-period. Over the years, I have developed an expertise in P&F charting (price projection), cycles (timing), EWT (structure), and general technical analysis which enables me to warn subscribers of pending reversals in market trends and how far that trend can potentially carry. For a FREE 4-week trial, subscription options and payment plans, I encourage you to visit my website at www.marketurningpoints.com.
The above comments and those made in the daily updates and the Market Summary about the financial markets are based purely on what I consider to be sound technical analysis principles. They represent my own opinion and are not meant to be construed as trading or investment advice but are offered as an analytical point of view which might be of interest to those who follow stock market cycles and technical analysis.
*********

When Andre Gratian was a stock broker years ago, a friend introduced him to technical analysis of the market. Consequently, it is not an exaggeration to say that Andre fell in love with this approach! Ever since then, it has become an increasingly important part of his professional life. Gratian has studied the works of Wyckoff, Edwards & Magee, Edward J. Dewey (cycles) and many others. However, one of my most profitable undertaking has probably been to study Point & Figure charting, which he finds invaluable in analyzing stocks and indices. If he were restricted to one methodology, this is the one that he would choose. This well-rounded background has given him what he feels to be a special insight into the stock market, facilitating the recognition of meaningful patterns and the ‘turning points’ in all trends, whether they be short or long term. Andre feels very comfortable discussing the stock market and passing on meaningful information to others. His subscribers include individuals and money managers throughout the world. Moreover, his Newsletters are currently published on several financial sites, here and abroad.
More from Gold-Eagle


