Technical Analysis Of The Markets


Current Position of the Market
SPX Long-term trend: For now, the best guesstimate is that we are still in the bull market which started in 2009. Where we go from here and how far will be gauged after the September-October correction.
SPX Intermediate trend: Potential intermediate correction in progress until mid to late-October.
Analysis of the short-term trend is done daily with the help of hourly charts. It is an important adjunct to the analysis of daily and weekly charts which discuss longer market trends.
Short-term Reversal
P&F: The short-term projects an Initial reversal to ~3330, then a potential for ~3400
Cycles: Looking ahead! 90-yr cycle – last low: 1932. Next low: 2022
7-yr cycle – last low: 2016. Next low: 2023
Nest of short-term cycle lows on about 10/15-20
Market Analysis (Charts courtesy of QCharts
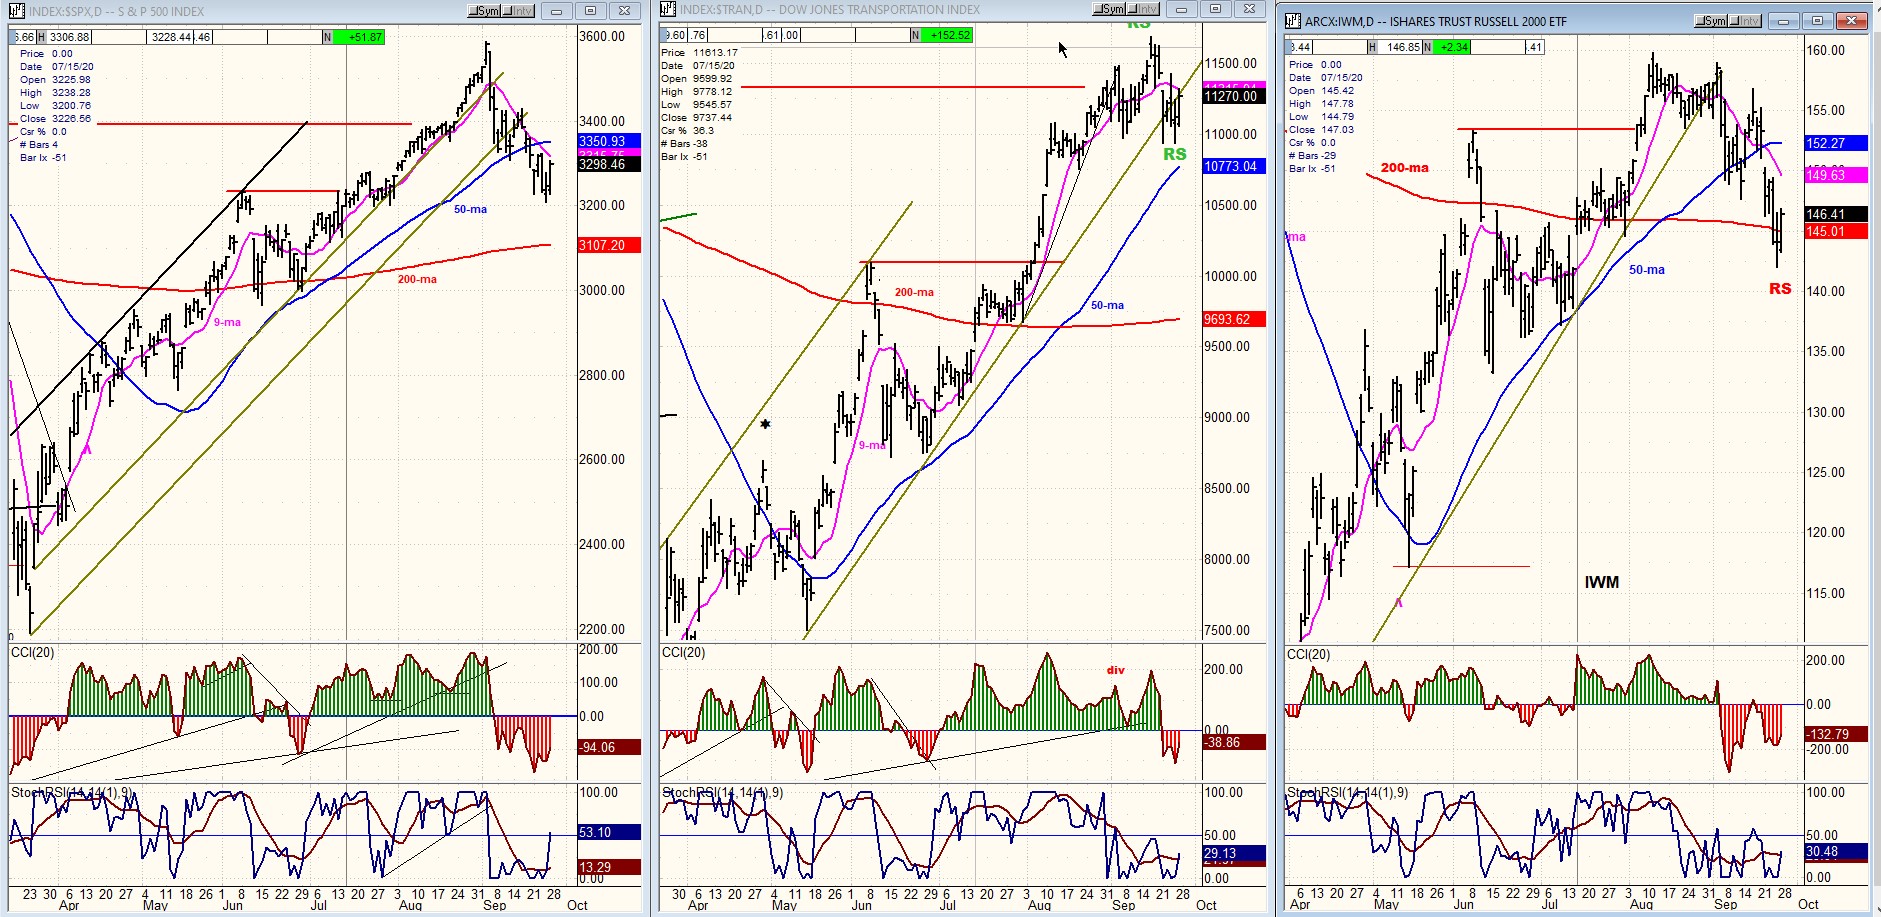
SPX-TRAN-IWM daily charts:
Relative strength between the three indices remains unchanged this week, with the TRAN exhibiting relative strength to SPX while IWW shows the opposite. This is congruent with the market’s position which remains in a long-term uptrend until proven otherwise. If, after this intermediate correction is over, the index is not capable of making a new high or shows a serious loss of momentum on the next high, and at the same time both leading indexes show relative weakness, we should expect the long-term uptrend to be seriously challenged.
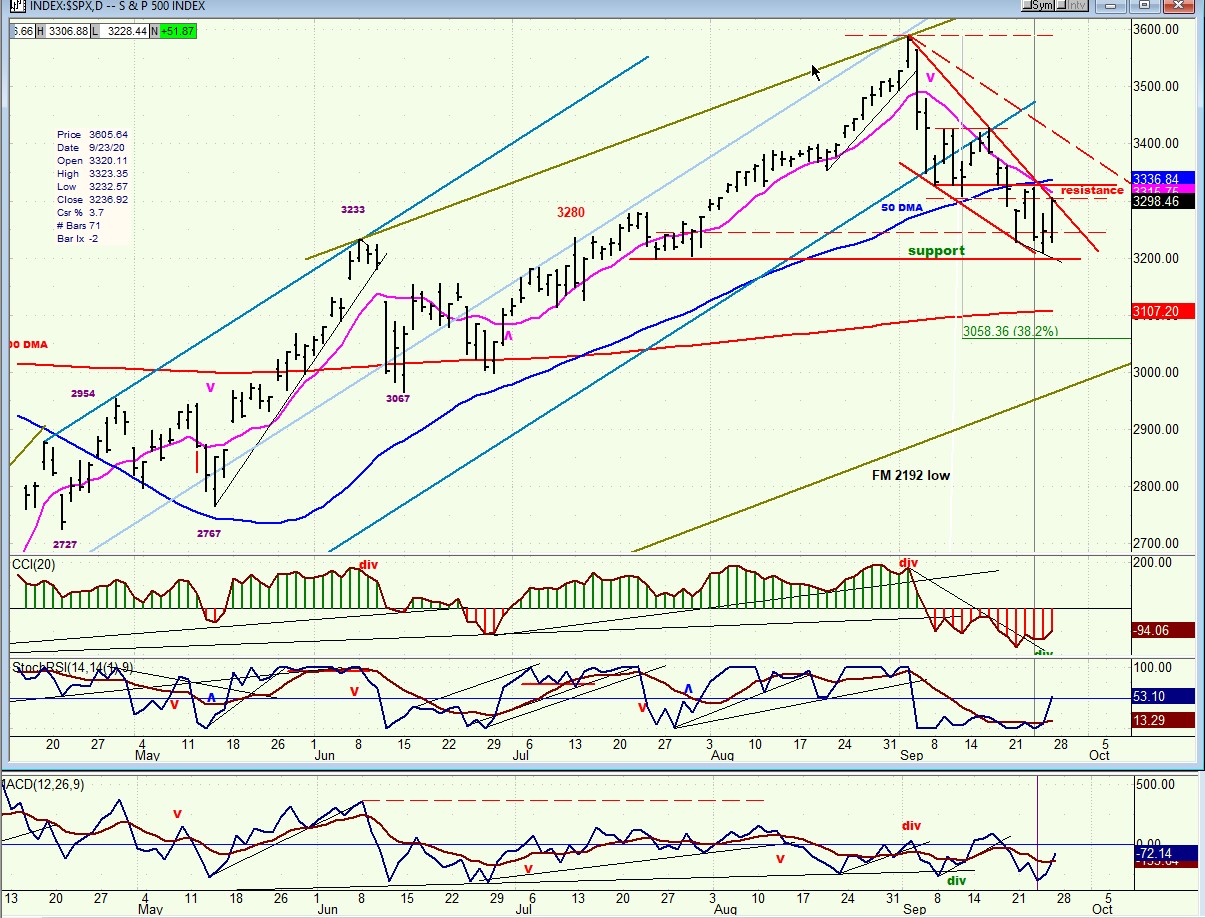
SPX daily chart
After making a high of 3588 to end the rally which started in March ‘20 at 2192 (a less than six months run of nearly 1400 points), SPX reversed and started a two-phase correction which came to an end on Thursday at 3309. This was followed by a reversal of ninety points which brought it to the primary declining trend line by Friday’s close. Only minor profit-taking occurred in the final minutes, suggesting that the trend line should be surpassed on Monday-- perhaps by as much as twenty or thirty points before a consolidation begins.
As you can see on the chart, the low occurred near the bottom of a support range, and now the index is about to meet with resistance as soon as it penetrates the red down trend line. This is likely to trigger a heavier dose of profit-taking, especially since it corresponds to a normal retracement of the second phase of the decline, and the small base that was formed at the low has an initial phase count to 3320-3330.
Last week, some positive divergence formed at the low in the CCI, suggesting that a reversal at the daily level was near, although it did not show in either SRSI or the A-Ds; and even after Friday’s strong rally, none of the oscillators have turned positive. This is a warning that the initial rally from the low may be limited.
However, it does not mean that this is all there will be to the rally. A normal retracement of the two-phased decline from the top -- which is itself likely to be only the first phase of a larger decline to about 3060 -- would be to ~3400 after which we could start on the second phase of the decline.
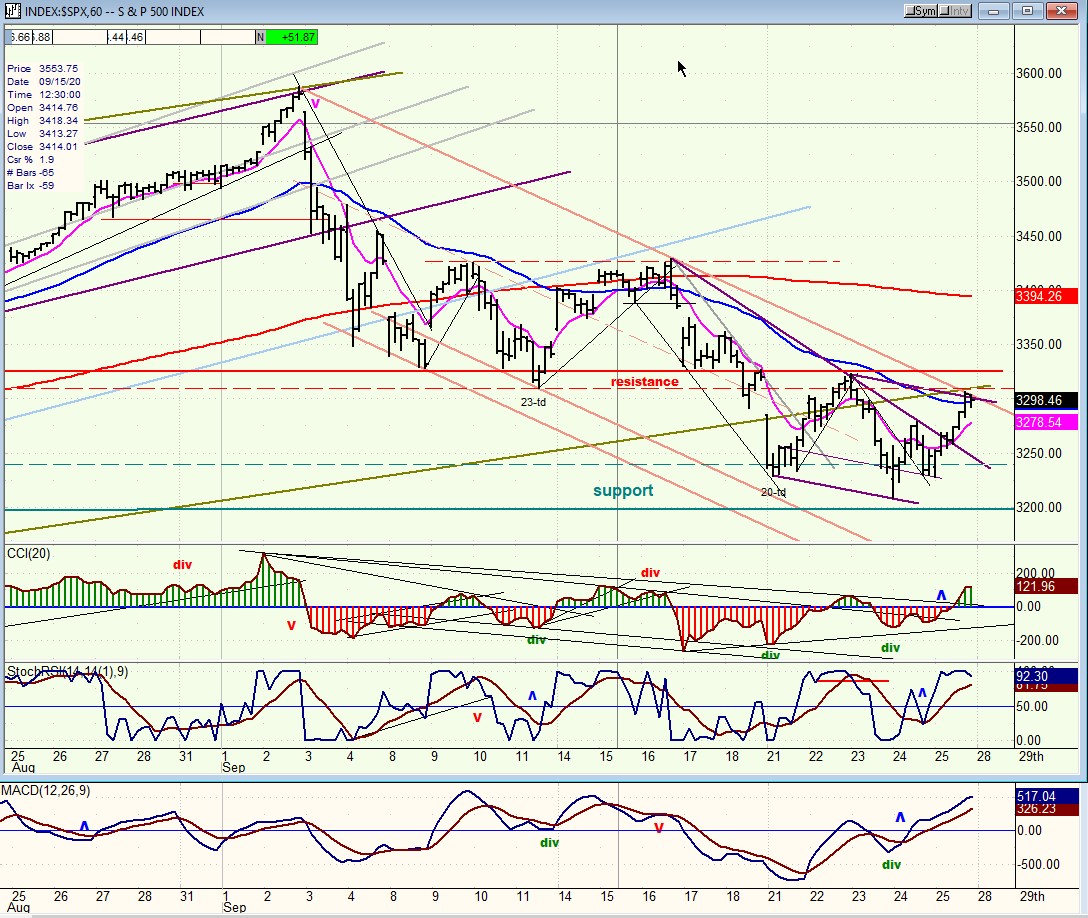
SPX hourly chart
There is not much more information to be derived from the hourly chart other than that which has been already gleaned from the daily chart. Perhaps a little more detail about the formation of the downtrend pattern with the two short-term bounces caused by the two short-term cycles, the 23-td on 9/11 and the 20-td on 9/21. Both were overpowered by a larger cycle bottoming last Thursday which brought about the final low. Positive divergence in the CCI started to appear with the 20-td and became more pronounced at the final low.
Deceleration is also evident in the price whereby the last low was only able to exceed the previous short-term low by a small margin and rebounded immediately as the number of sellers diminished. This is reflected in the A-Ds which also showed positive divergence at the final low.
The returning strength is exemplified in the fact that two secondary downtrend lines were mastered before the rally stopped on the primary trend line at Friday’s close, right at the blue 50-hr MA and just below the band of resistance which is expected to be tested on Monday. Even though I have given some good reasons for the initial rally to halt temporarily at about 3330, it would not surprise me if we kept right on going after a gap opening if there is credible news about a compromise between the two parties on a new relief package.
Friday ended with a buy signal on the hourly chart, and if/when the resistance band is exceeded right away, there is already enough of a base in place across the double bottom to take us right up to ~3400
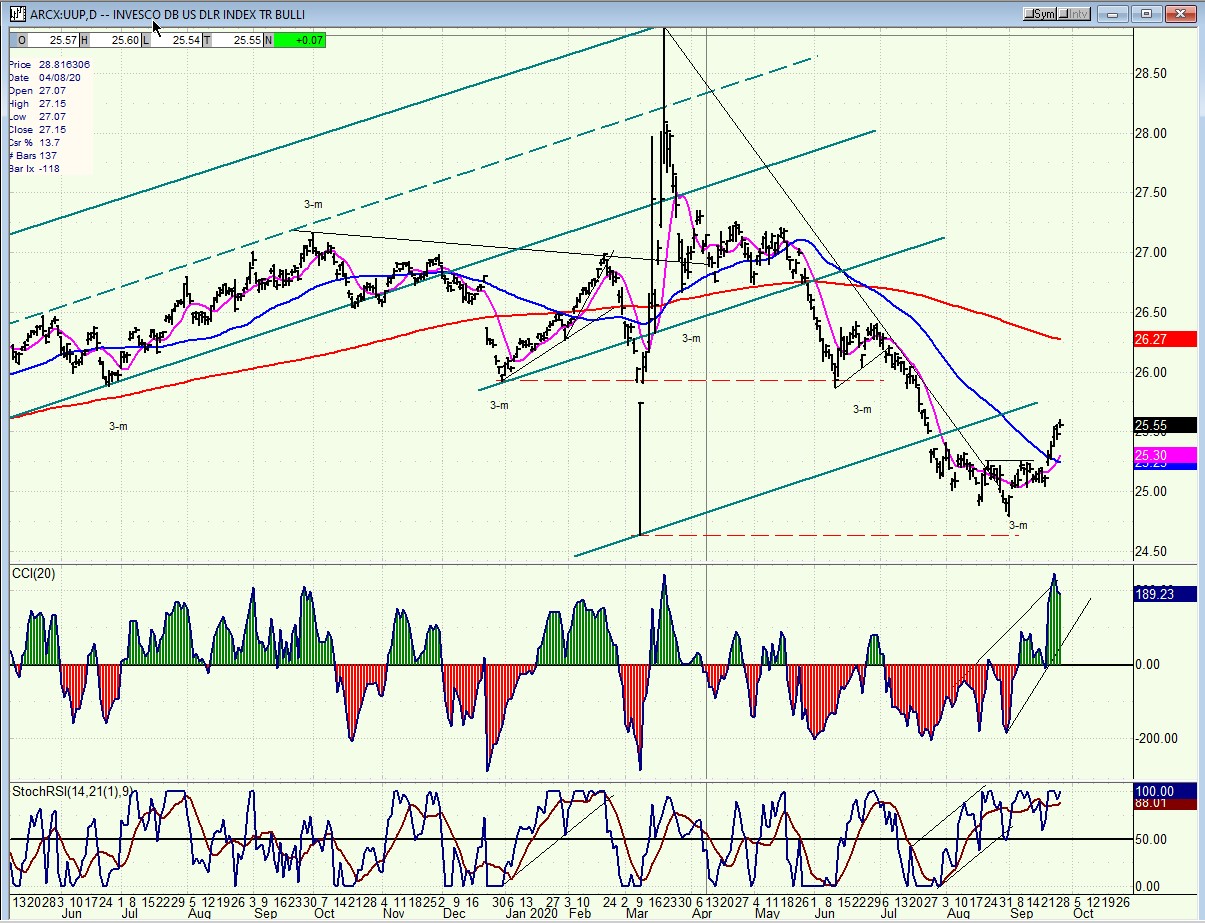
UUP (dollar ETF) ($USD chart not available from this data provider)
UUP is being lifted by its 3-m cycle which continues to exercise dominance over the short-term price pattern. After forming a small base, the index has broken out into a new short-term uptrend which is not expected to be the start of a major rally, at least not until a larger base has been built. It is conceivable, however, that the rebound could continue until it reaches the overhead supply at the dashed horizontal line.
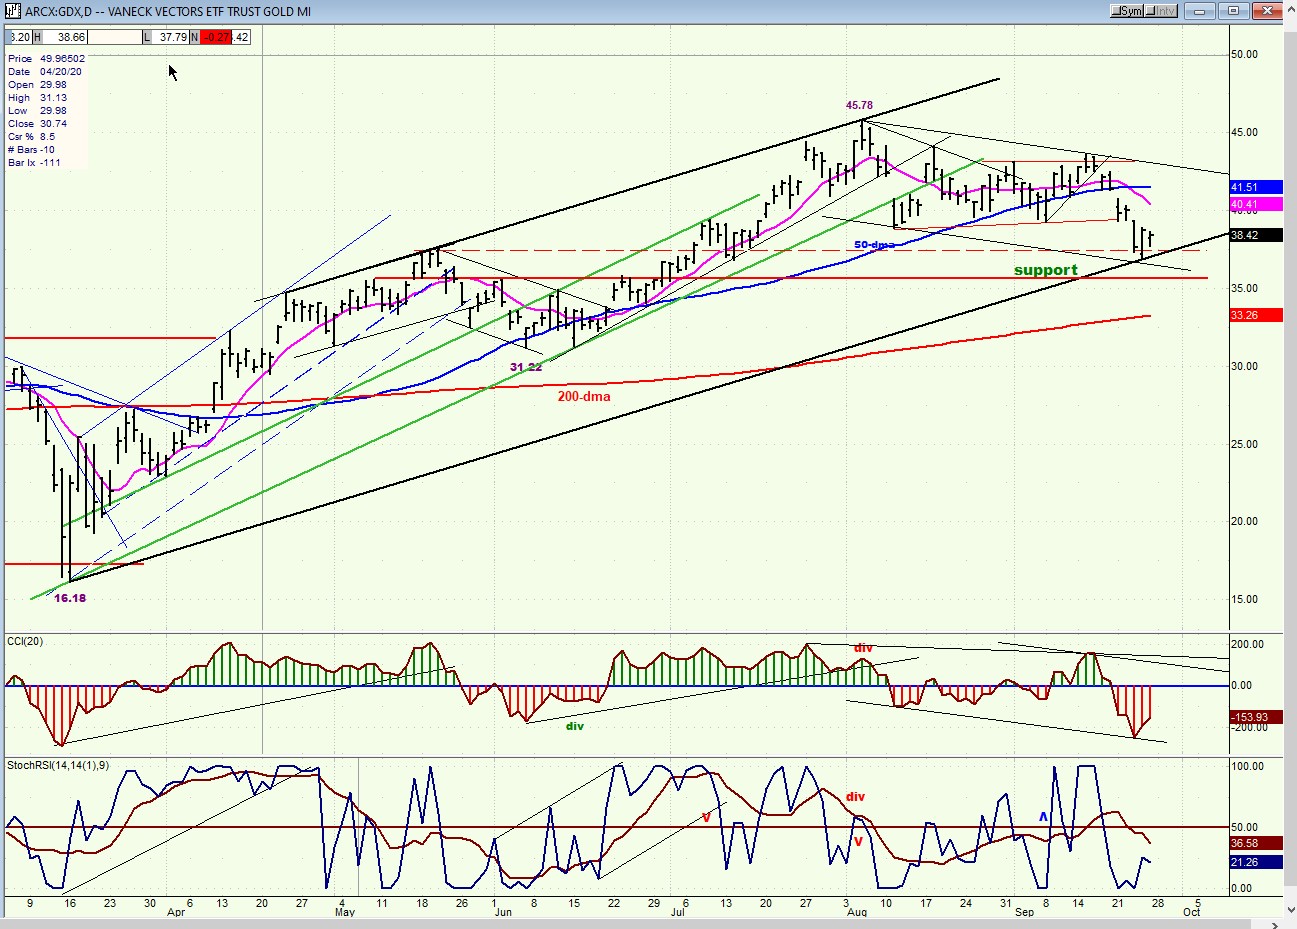
GDX (gold miners)
When GDX finally dropped below its blue 50-dma, it broke support and expanded its corrective pattern. It has reached at least temporary support on the channel trend line, but do not expect much of a rebound at this time. A better pattern will have to be formed in price and the oscillators before it is ready to resume its uptrend. While it is currently at support, it may have to move all the way down to about 35 before the correction is over. Be aware that this is only a consolidation in an uptrend and there is a long way up before the bullish move is over.
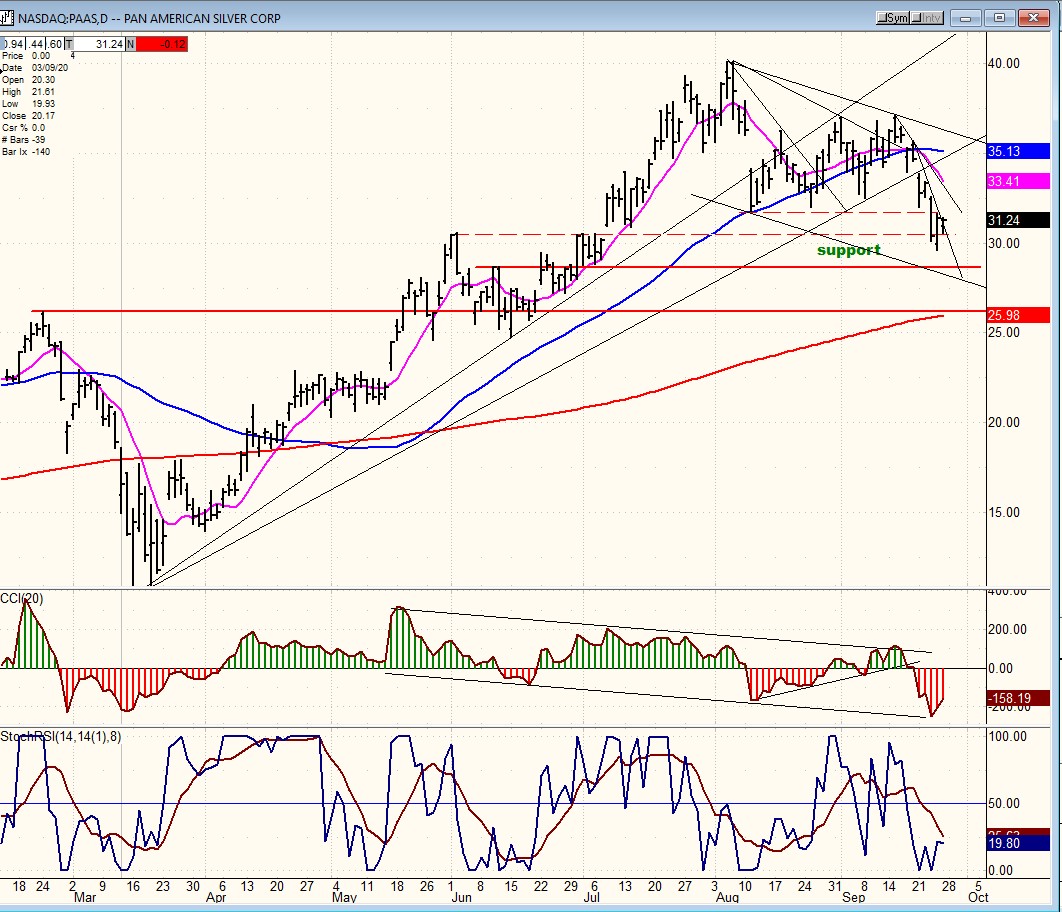
PAAS (Pan American Silver Corp)
In tandem with GDX, PAAS has broken below its 50-dma and found temporary support at the top of a congestion range. However, it is likely that it will drop down to its 200-dma before ending its correction. This would correspond to a retracement down to 26.00 before the stock could start on an extension of its long-term uptrend.
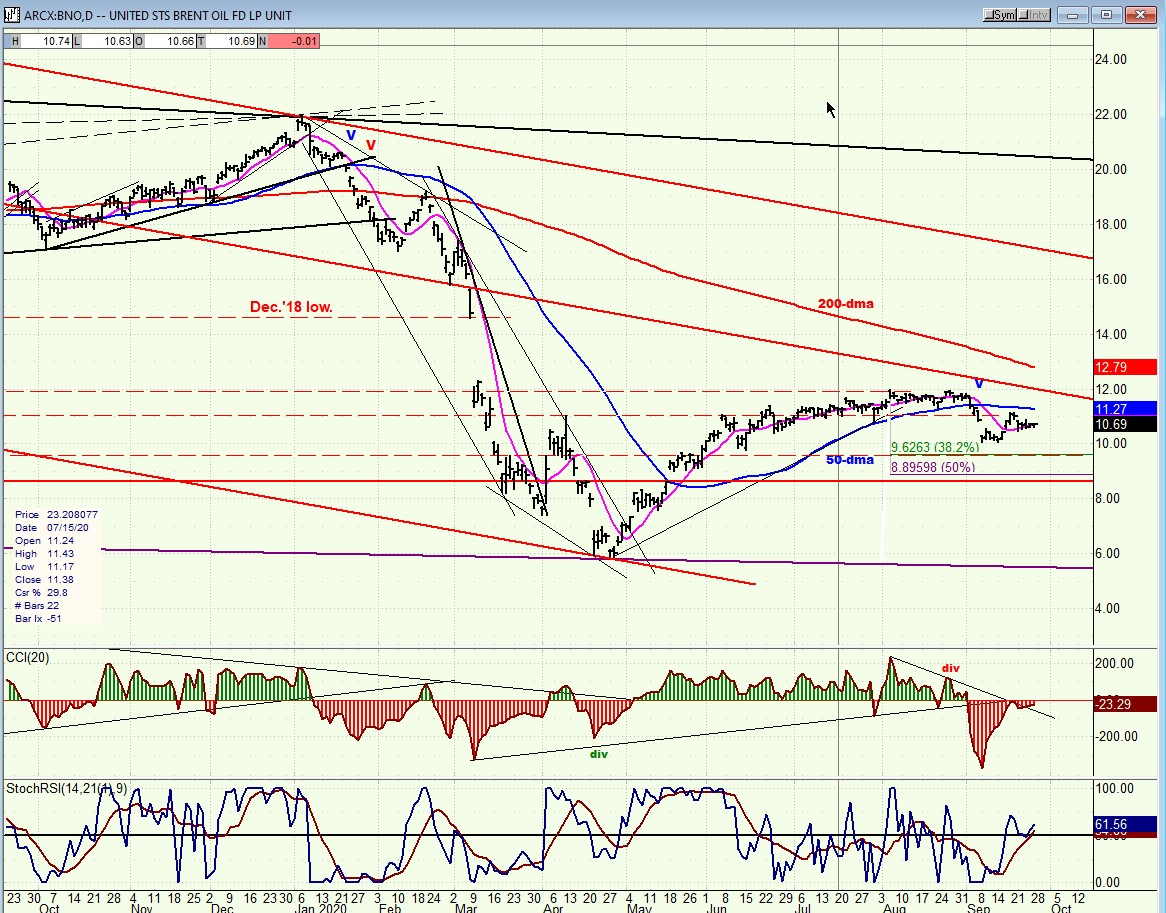
BNO (U.S. Brent Oil fund)
BNO is not doing much and is not expected to do much in the future. It could be a long time before the index is capable of mounting any kind of a significant uptrend.
Summary
SPX has found a short-term low after completing an a-b-c pattern and has started a countertrend rally. This is not yet an attempt at resuming the long-term uptrend, and a deeper correction is expected before this occurs. But there has been enough of a base built to retrace back to about 3400 before it resumes its correction.
Free trial subscription
With a trial subscription, you will have access to the same information that is given to paid subscribers, but for a limited time-period. Over the years, I have developed an expertise in P&F charting (price projection), cycles (timing), EWT (structure), and general technical analysis which enables me to warn subscribers of pending reversals in market trends and how far that trend can potentially carry. For a FREE 4-week trial, subscription options and payment plans, I encourage you to visit my website at www.marketurningpoints.com.
The above comments and those made in the daily updates and the Market Summary about the financial markets are based purely on what I consider to be sound technical analysis principles. They represent my own opinion and are not meant to be construed as trading or investment advice but are offered as an analytical point of view which might be of interest to those who follow stock market cycles and technical analysis.
********

When Andre Gratian was a stock broker years ago, a friend introduced him to technical analysis of the market. Consequently, it is not an exaggeration to say that Andre fell in love with this approach! Ever since then, it has become an increasingly important part of his professional life. Gratian has studied the works of Wyckoff, Edwards & Magee, Edward J. Dewey (cycles) and many others. However, one of my most profitable undertaking has probably been to study Point & Figure charting, which he finds invaluable in analyzing stocks and indices. If he were restricted to one methodology, this is the one that he would choose. This well-rounded background has given him what he feels to be a special insight into the stock market, facilitating the recognition of meaningful patterns and the ‘turning points’ in all trends, whether they be short or long term. Andre feels very comfortable discussing the stock market and passing on meaningful information to others. His subscribers include individuals and money managers throughout the world. Moreover, his Newsletters are currently published on several financial sites, here and abroad.
More from Gold-Eagle


