Technical Analysis Of The Markets


Current Position of the Market
SPX Long-term trend: For now, the best guesstimate is that we are still in the bull market which started in 2009. Where we go from here and how far will be gauged after the September-October correction.
SPX Intermediate trend: Intermediate correction could continue as a sideways pattern until the end of the year.
Analysis of the short-term trend is done daily with the help of hourly charts. It is an important adjunct to the analysis of daily and weekly charts which discuss longer market trends.
Is the Minor Correction Over?
Cycles: Looking ahead! 90-yr cycle – last low: 1932. Next low: 2022
7-yr cycle – last low: 2016. Next low: 2023
New minor low about mid-November?
Market Analysis (Charts courtesy of QCharts)
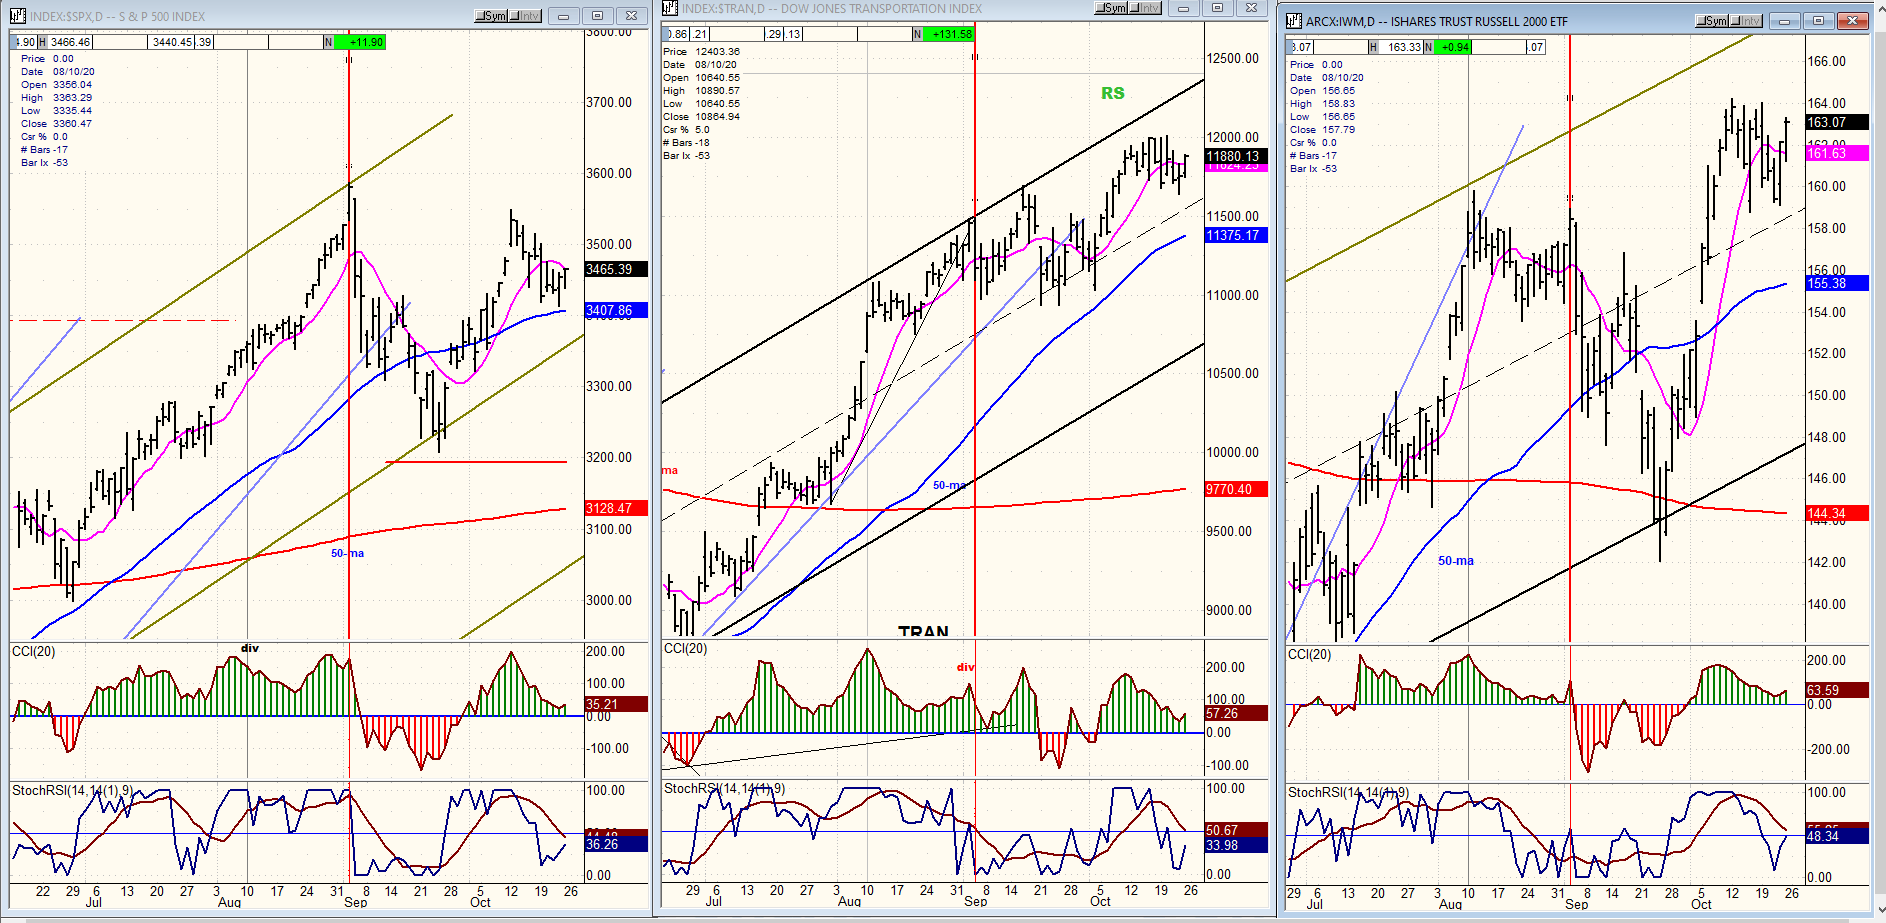
SPX-TRAN- IWM – daily charts
The vertical red line marks the date when SPX made its all-time high. At the last market high, SPX did not surpass its former high, but both leading indexes did. This ostensibly suggests that the benchmark indexes will continue to rise until such a time as the reverse occurs, whereby the leading indexes begin to display relative weakness to SPX.
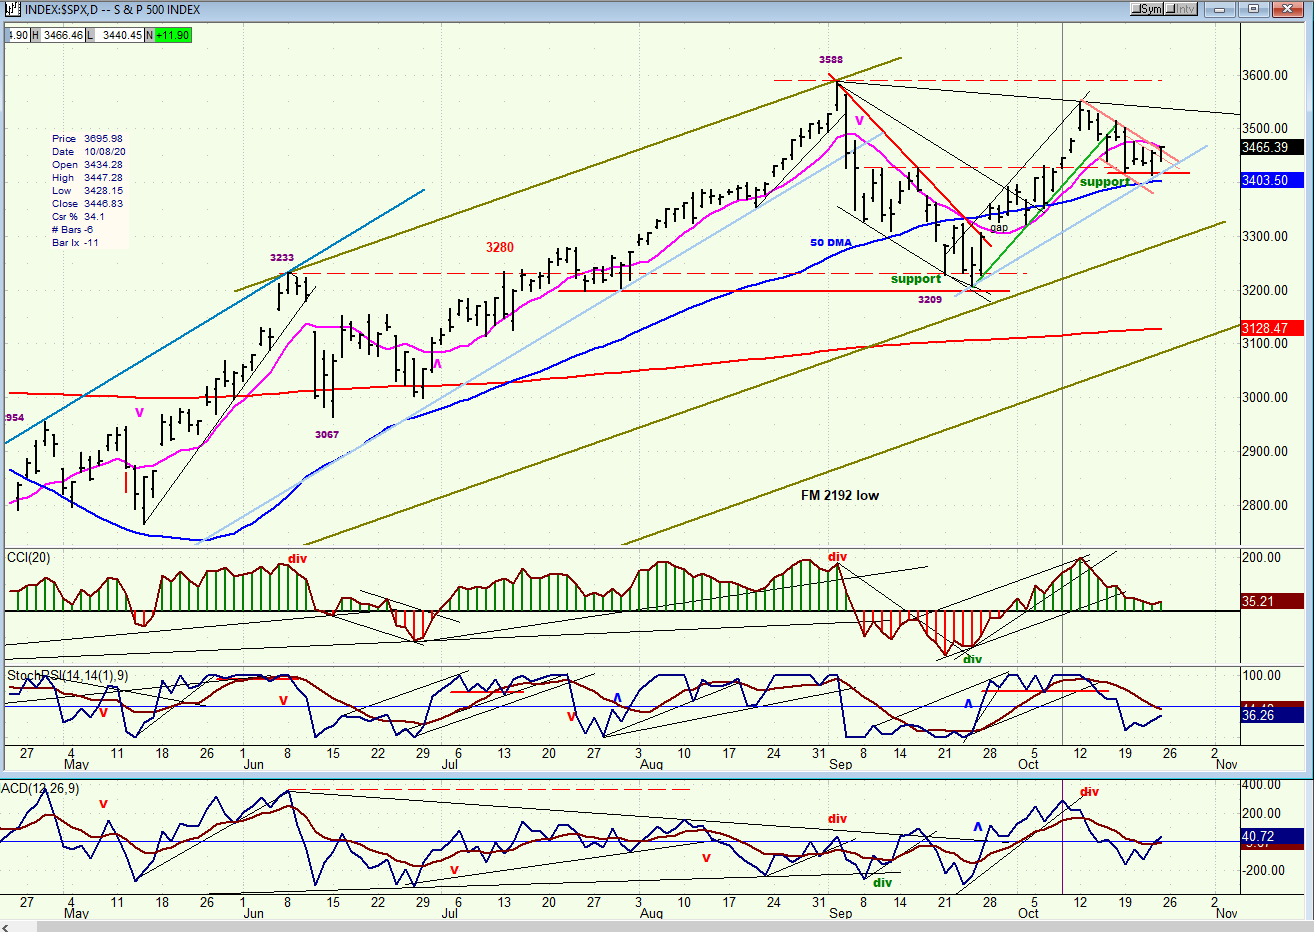
SPX daily chart
After making a new all-time high in early September, SPX corrected almost four hundred points before regaining most of it in the next rally. A new correction started two weeks ago which could already be ending; but the stabilization of the past week could also be a pause in the downtrend. The price congestion which has formed at the 3450 level gives us a potential count of about 150 points, so a rally from here could take us to the ~3600 level while a decline would target ~3300.
The daily oscillators ended the past week essentially neutral with a very faint positive bias, but it was clear that traders did not want to commit themselves ahead of the weekend. We therefore need to wait until next week to see what direction the market takes. A likely catalyst which could move the market higher would be the passage of another stimulus bill, while delaying doing so might result in lower prices.
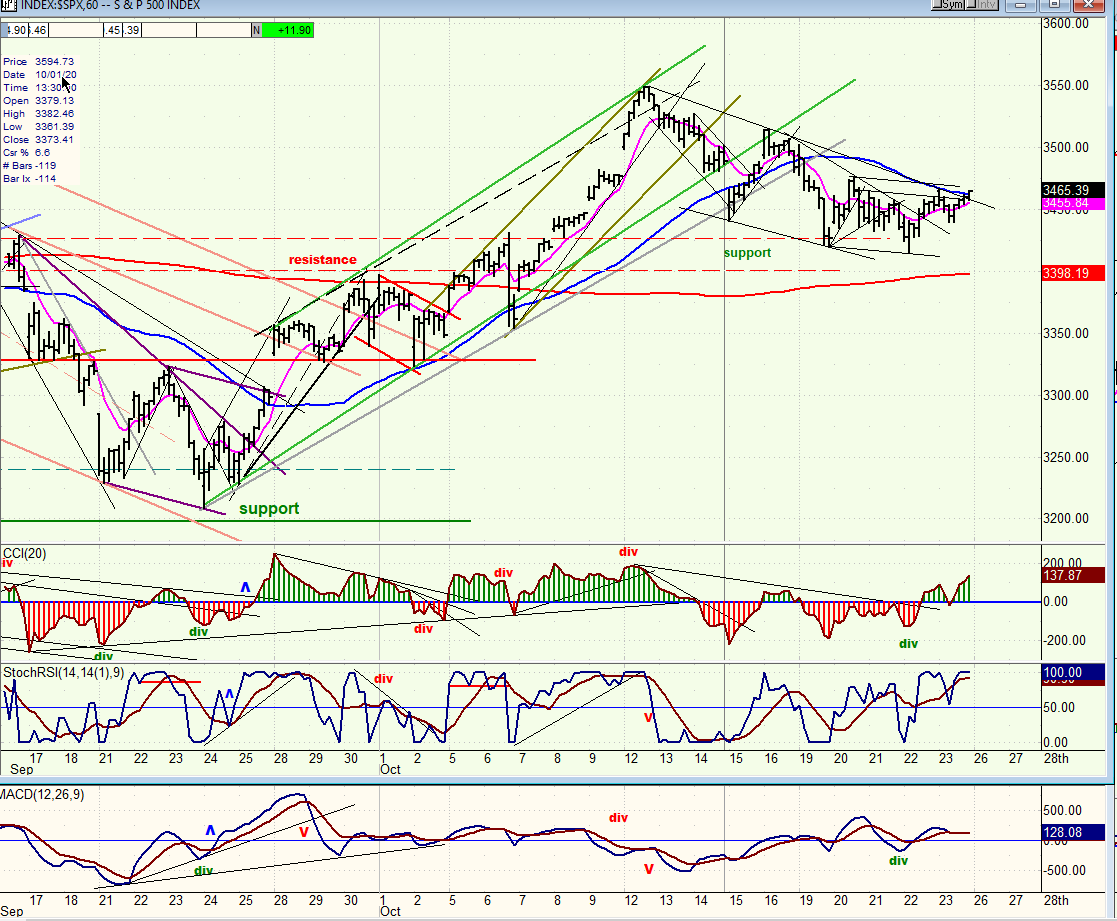
SPX hourly chart
After reaching the 3550 level, SPX started a moderate pull-back which found support at about 3530 -- the previous short-term resistance level which has now turned support. Former rally tops have kept the index afloat as it formed a price congestion band within a narrow price range. The pattern reflects indecision on the part of traders and investors as they wait for more clarity about whether and when more financial relief will be forthcoming. If positive news does not arrive quickly, the index is likely to resume its downward drift. For a rally to start, SPX would have to move above 3470 and keep advancing.
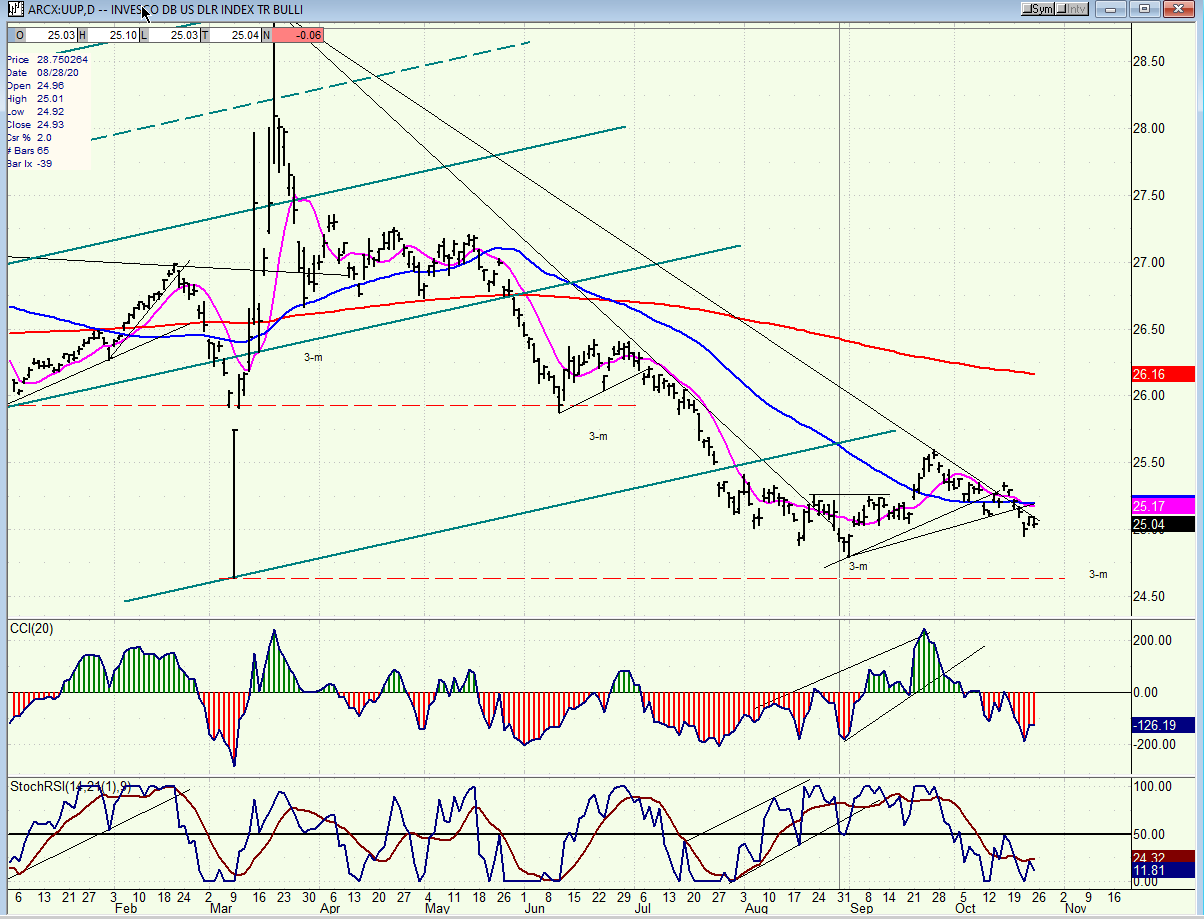
UUP (dollar ETF) ($USD chart not available from this data provider)
UUP’s attempt at rallying was both unimpressive and short-lived. With the 3-mo cycle low drawing closer, it is unlikely that it will be able to start another rally until after mid-November.
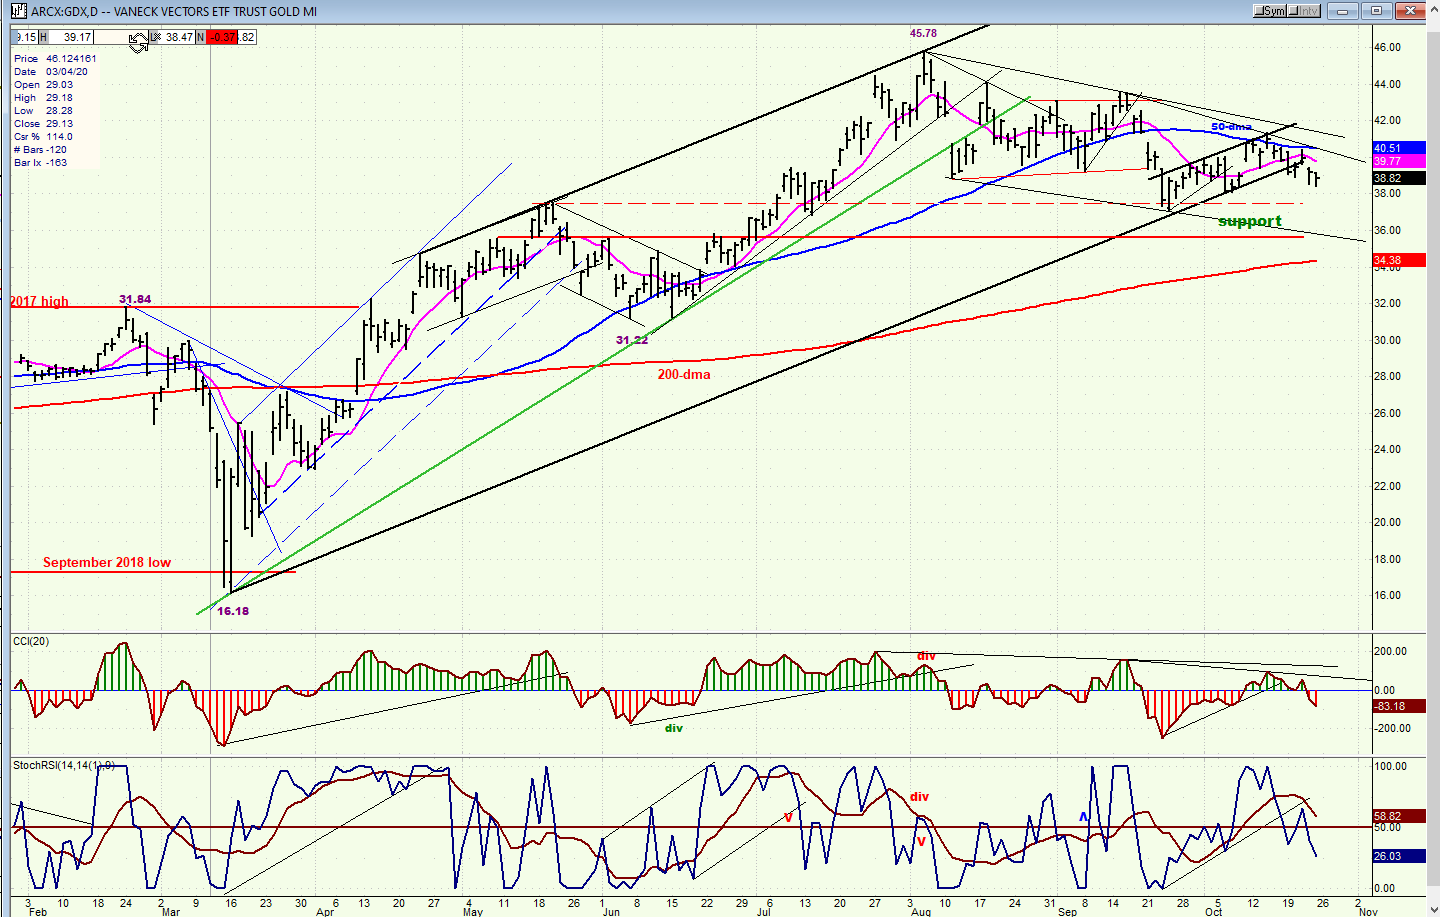
GDX (gold miners)
GDX held its channel line for about a month, and last week finally stopped trying. Unless it can get back above it quickly, the index should now extend its correction -- perhaps down to about 36.00 which is the next support level. The overall correction is orderly and could come to an end shortly after that level is reached. I want to remind you that the base GDX has formed over the past few years calls for much higher prices.
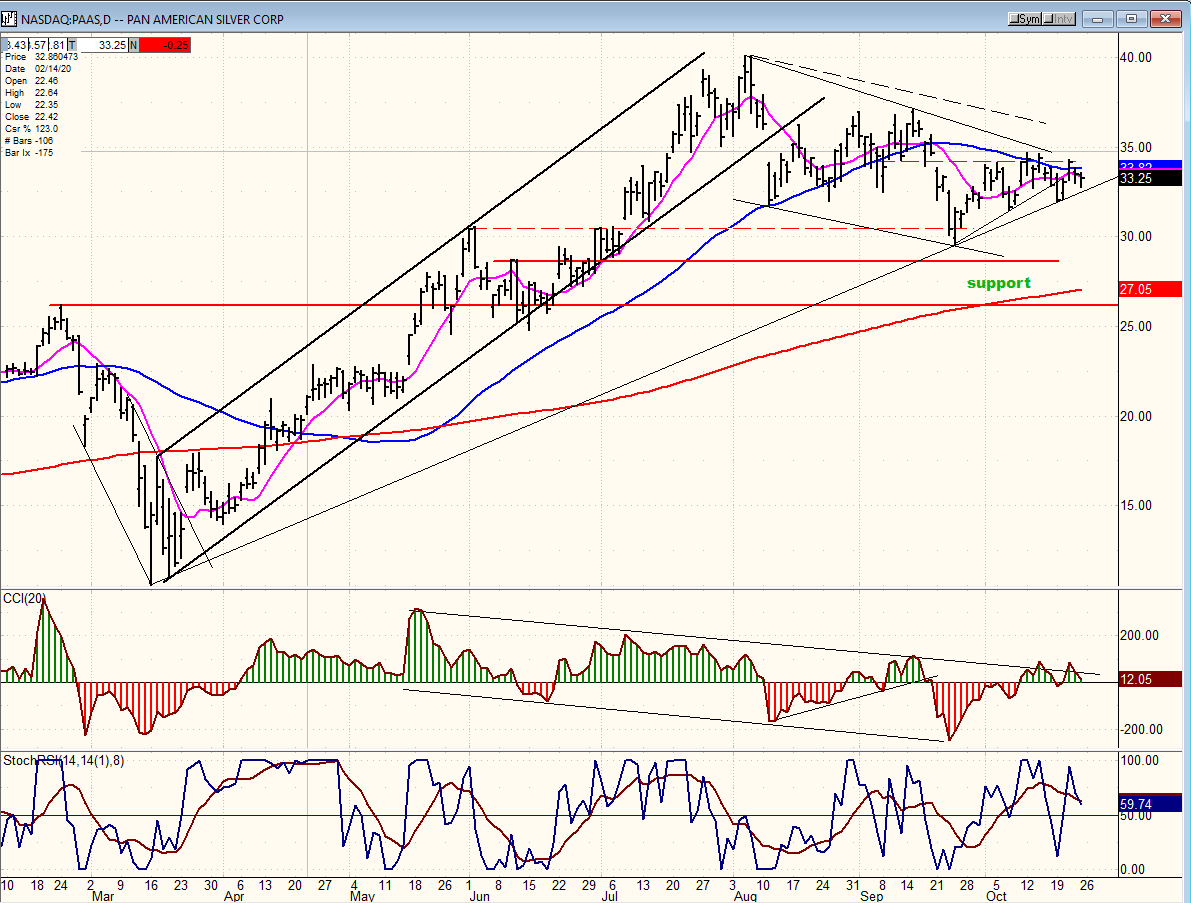
PAAS (Pan American Silver Corp)
If GDX extends its correction, PAAS is likely to follow with an extension of its own. Although the two indexes have made similar bullish and corrective patterns since their lows, PAAS is stronger. For both, this short-term corrective phase is probably going to be the last one of the pull-back which started in early August.
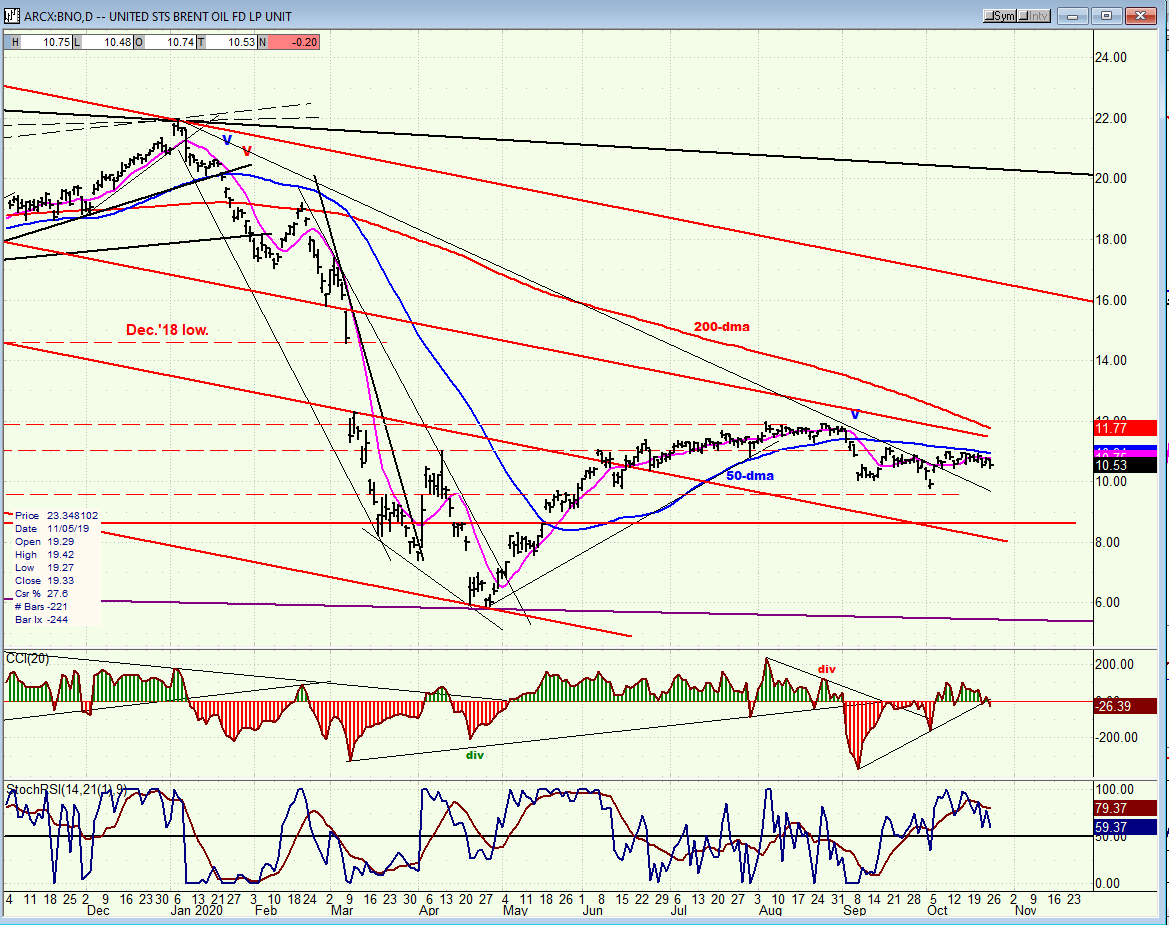
BNO (U.S. Brent Oil fund)
If BNO was not representative of an important industry group (which is, by necessity, doomed to be eventually replaced by a more efficient and less polluting form of energy), it would not be worth following. BNO has gone nowhere for the past six months and it may linger for more weeks and months before it has its last hurrah along with the market early next year before the larger cycles roll over and create the next bear market.
SUMMARY
Most minor cycles scheduled to make their lows in this time frame have probably done so, but SPX has not yet shown a clear sign of wanting to resume its uptrend. If we cannot find buyers early next week, the correction is likely to be extended.
Free trial subscription
With a trial subscription, you will have access to the same information that is given to paid subscribers, but for a limited time-period. Over the years, I have developed an expertise in P&F charting (price projection), cycles (timing), EWT (structure), and general technical analysis which enables me to warn subscribers of pending reversals in market trends and how far that trend can potentially carry. For a FREE 4-week trial, subscription options and payment plans, I encourage you to visit my website at www.marketurningpoints.com.
The above comments and those made in the daily updates and the Market Summary about the financial markets are based purely on what I consider to be sound technical analysis principles. They represent my own opinion and are not meant to be construed as trading or investment advice but are offered as an analytical point of view which might be of interest to those who follow stock market cycles and technical analysis.
********

When Andre Gratian was a stock broker years ago, a friend introduced him to technical analysis of the market. Consequently, it is not an exaggeration to say that Andre fell in love with this approach! Ever since then, it has become an increasingly important part of his professional life. Gratian has studied the works of Wyckoff, Edwards & Magee, Edward J. Dewey (cycles) and many others. However, one of my most profitable undertaking has probably been to study Point & Figure charting, which he finds invaluable in analyzing stocks and indices. If he were restricted to one methodology, this is the one that he would choose. This well-rounded background has given him what he feels to be a special insight into the stock market, facilitating the recognition of meaningful patterns and the ‘turning points’ in all trends, whether they be short or long term. Andre feels very comfortable discussing the stock market and passing on meaningful information to others. His subscribers include individuals and money managers throughout the world. Moreover, his Newsletters are currently published on several financial sites, here and abroad.


