Technical Analysis Of The Markets


Current Position of the Market
SPX Long-term trend: There is some good evidence that we are still in the bull market which started in 2009, and which could continue into the first quarter of 2021 before coming to an end.
SPX Intermediate trend: New intermediate uptrend underway since 2234.
Analysis of the short-term trend is done daily with the help of hourly charts. They are important adjuncts to the analysis of daily and weekly charts which determine longer market trends.
Minor Correction Underway
Cycles: Looking ahead! 90-yr cycle – last low: 1932. Next low: 2022
7-yr cycle – last low: 2016. Next low: 2023
Market Analysis (Charts courtesy of QCharts
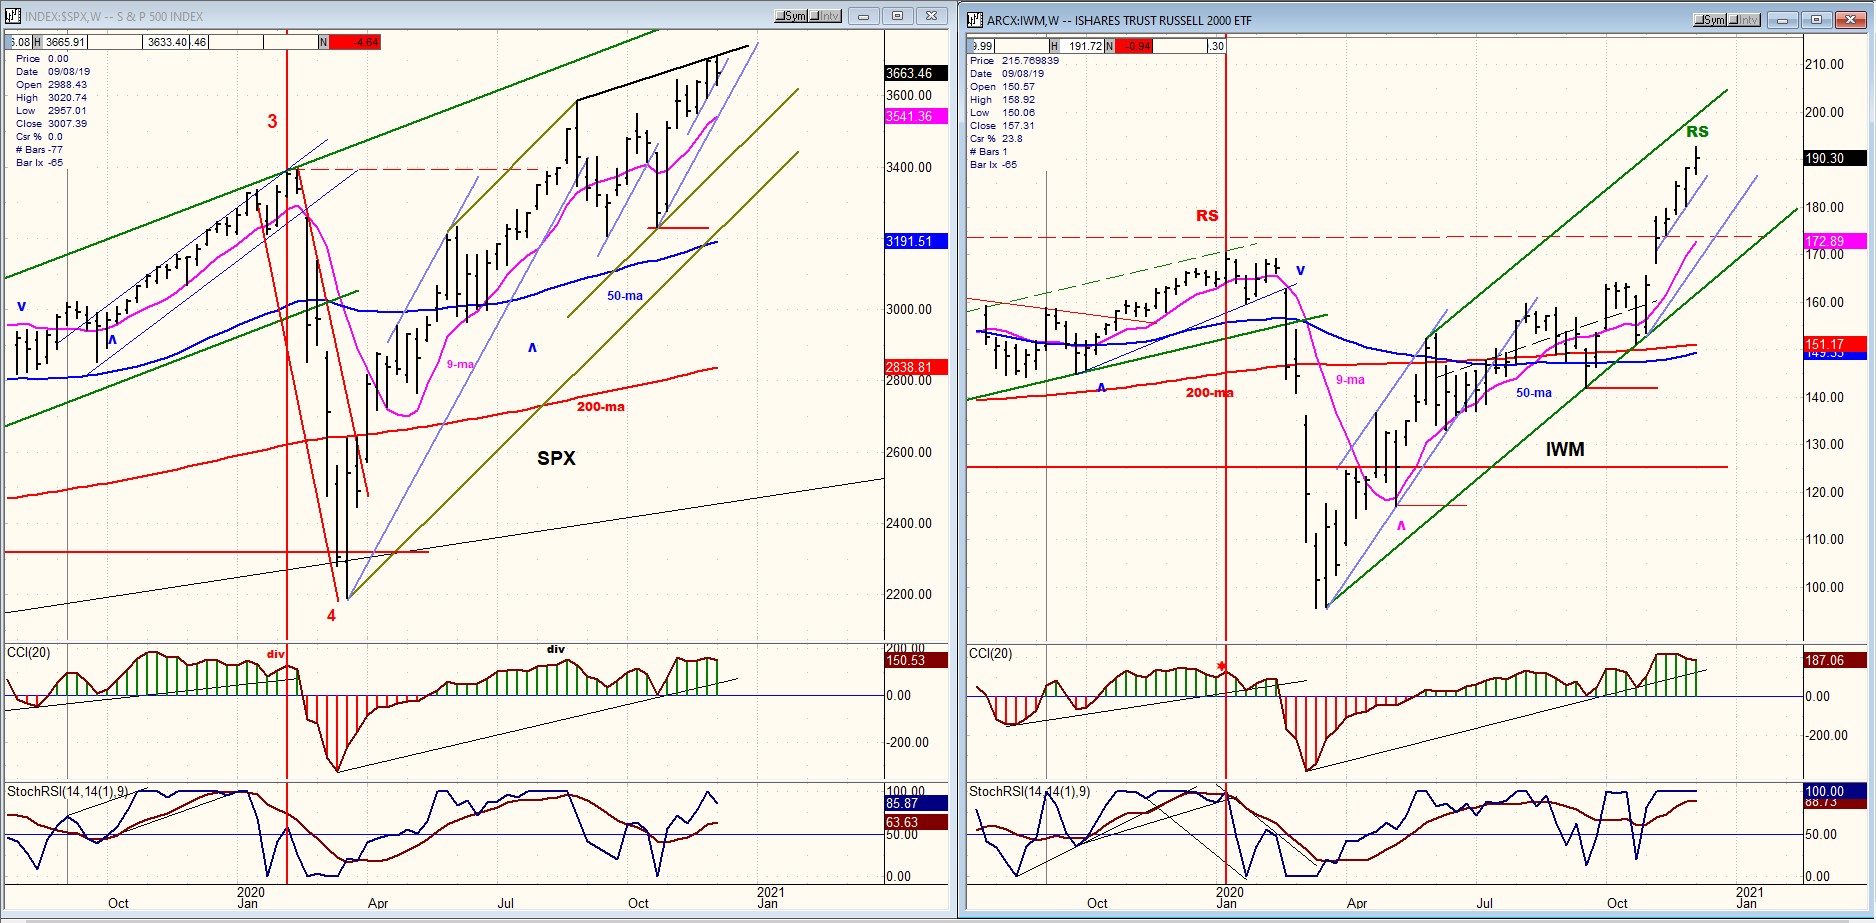
SPX-IWM weekly charts
During the past week, IWM outpaced SPX and retained its current relative strength. According to my interpretation, this is bullish for the market, suggesting that only a minor top, at best, is being forecast by short-term indicators.
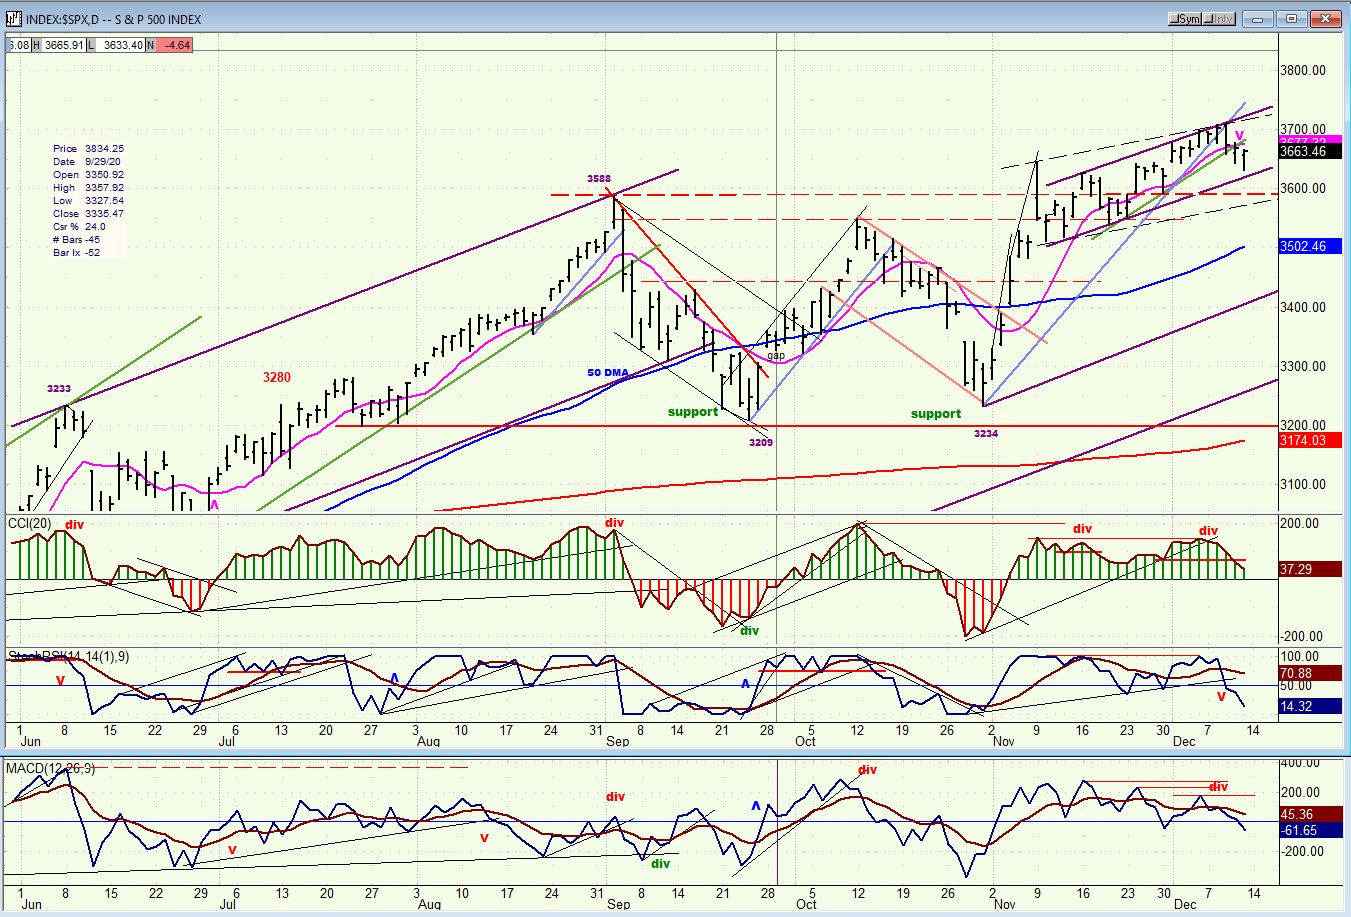
SPX daily chart
For the past few weeks, SPX has been trading in an upward slanted channel which is identified on the chart by two heavy parallel trend lines. Earlier this week, prices congested near the high of the channel, and by Friday, they had moved back toward the lower channel line before finding some support and bouncing into the close. This is a move similar to what took place four weeks ago with the difference being that then, prices recovered enough to move back to the top of the channel, whereby this time only a half channel recovery is expected, and this should be followed by a break of the lower channel line with the decline continuing to the bottom of the larger channel illustrated with parallel dashed lines. Reaching that destination in another week to ten days should put an end to the minor correction and be followed by a resumption of the intermediate uptrend which started at 3234.
Some minor divergence showing in the CCI and in the A-Ds oscillator alerted us to the probable formation of a minor top, with the occurrence of a cycle low around Christmas time making it highly likely that prices could move out of the more narrow channel to the broader one. The oscillators have started a corrective pattern which will require some time to complete.
Unless SPX does something unexpected over the next couple of days, the congestion which is already in place suggests that the low could take place near the 3600 level, which is where support is expected.
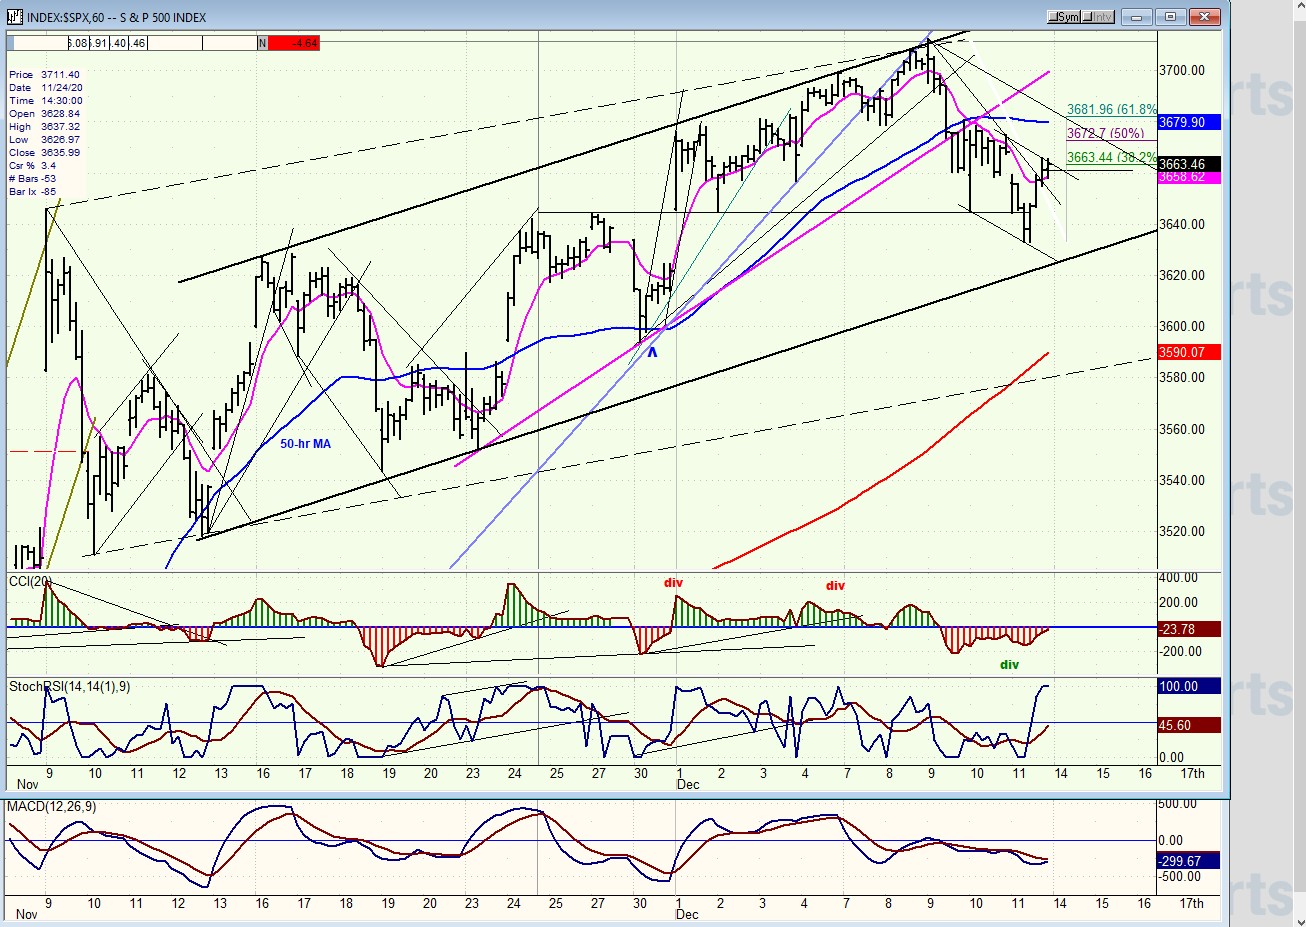
SPX hourly chart
The index stopped a little short of its 3740 projection before finding a top, breaking the daily blue trend line, and starting to correct. By Friday it had almost reached the bottom of the channel before finding buyers to put an end to the 80-point decline and rallying .382 of the distance. It looks as if we have completed the a-phase of the correction and perhaps the b-phase as well, although the latter may not be finished and could extend to a .50 and even .618 retracement of last week’s decline.
The correction is deemed to continue for several more days, perhaps until Christmas. If so, we must assume that lower prices will be seen before it is able to reverse. Since some additional congestion around the 3660-70 level could form early in the week, we will have to wait until the next phase of the correction starts and see what kind of a count we are left with. A move down to ~3600 is likely. This makes sense since that level would correspond with the lower trend line of the larger (dashed lines) channel.
As soon as it is possible to derive a potential target from the P&F chart, it will be made available.
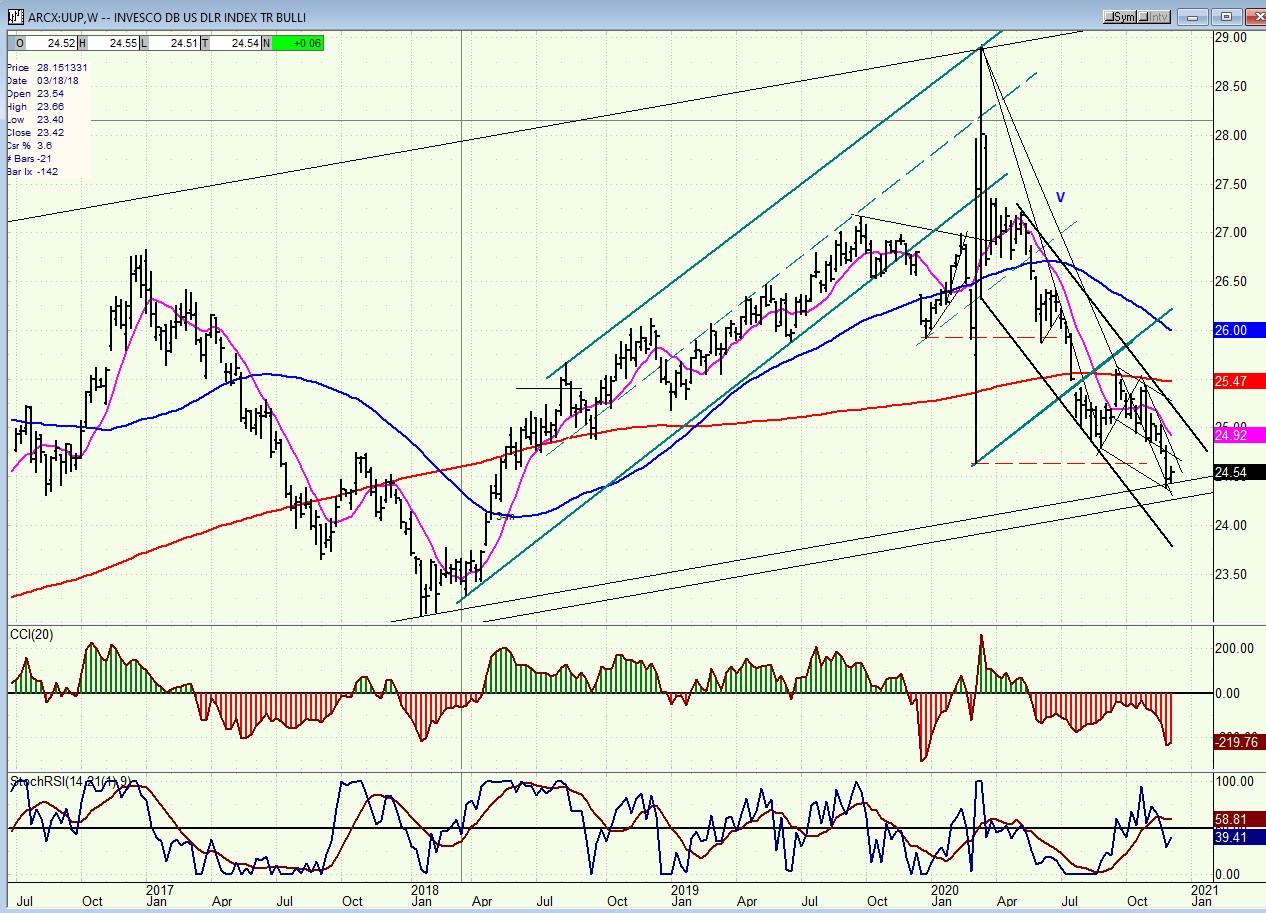
UUP (dollar ETF) WKLY ($USD chart not available from this data provider)
UUP has reached the bottom of a large channel which connects the 2014 low to the 2020 high where it could find temporary support. Temporary, because the oscillators do not indicate an immediate reversal; and also because the dollar P&F chart has lower counts.
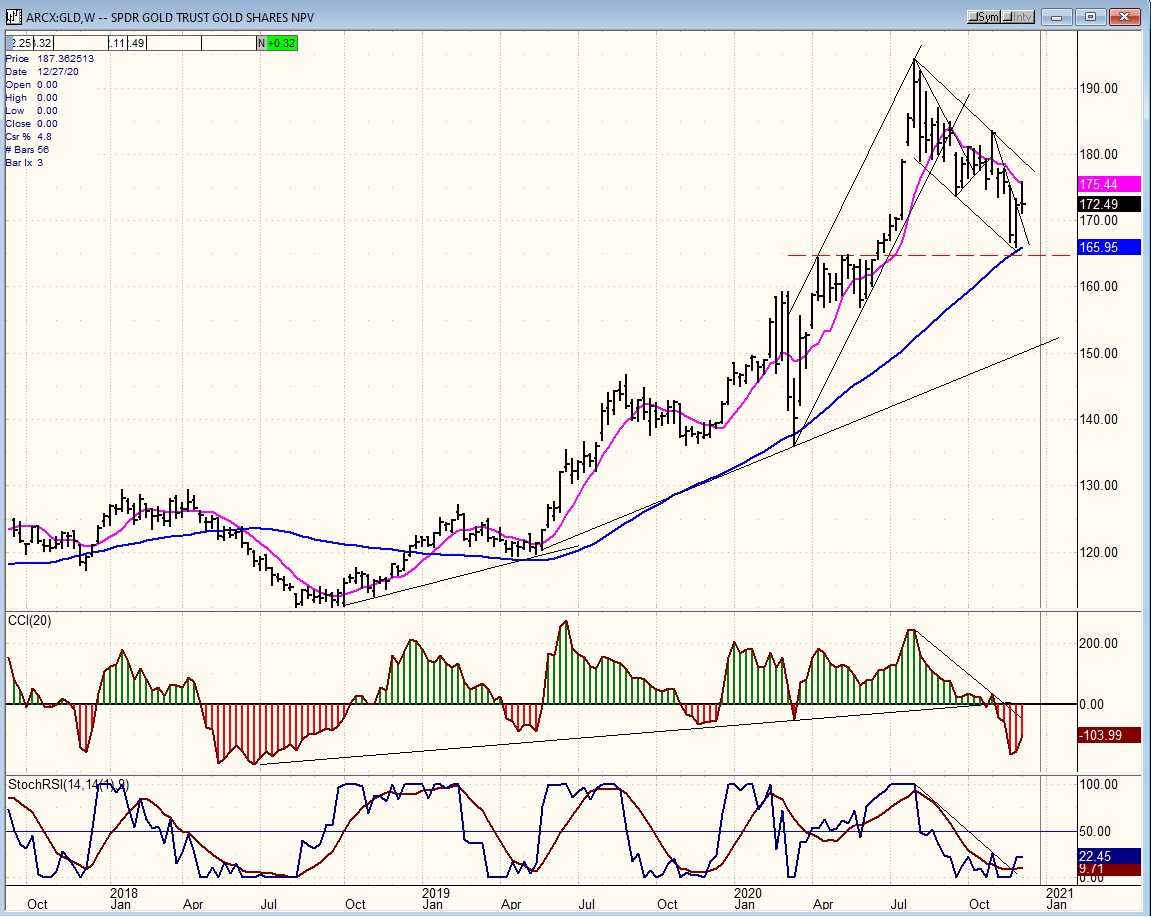
GLD (gold)-WKLY
GLD has rallied from the bottom of is corrective channel but is likely to retrace to its recent low before it can complete a chart pattern which would allow it to resume its long-term uptrend.
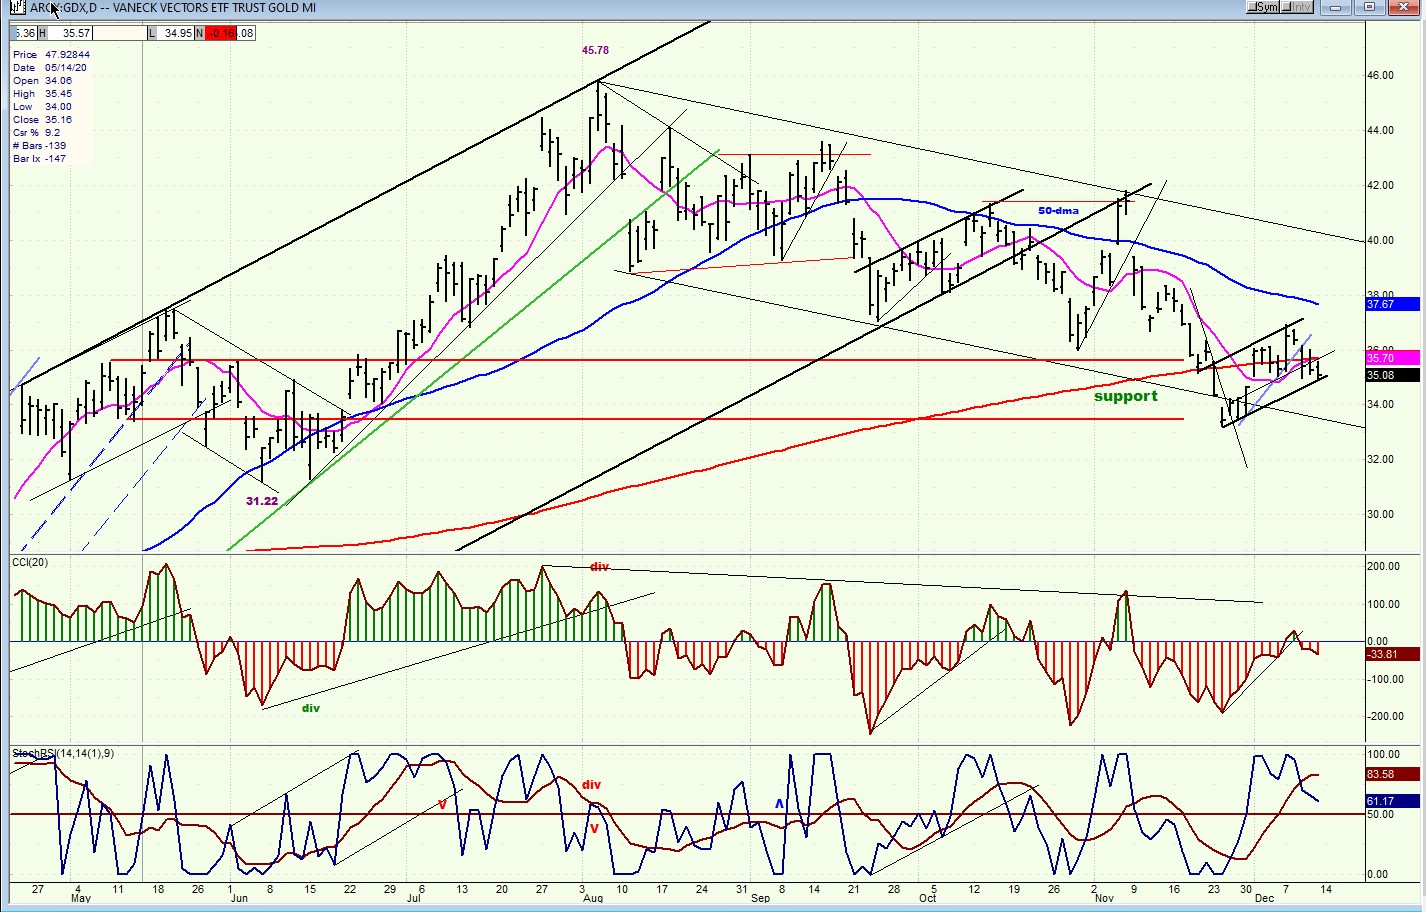
GDX (gold miners)-DLY
GDX reversed after reaching the low of a support range and has created a small rising channel which could allow for a minor uptrend to continue for a little longer, but it will eventually have to retest its low while creating a base which would permit it to resume its uptrend after it is complete. It may need to print 32.50-33.00 before it ends its correction.
SIL (silver)-WKLY
Silver continues to show a little relative strength to gold, but its corrective pattern is similar to that of gold and it too is likely to retest its low before ending its intermediate consolidation.

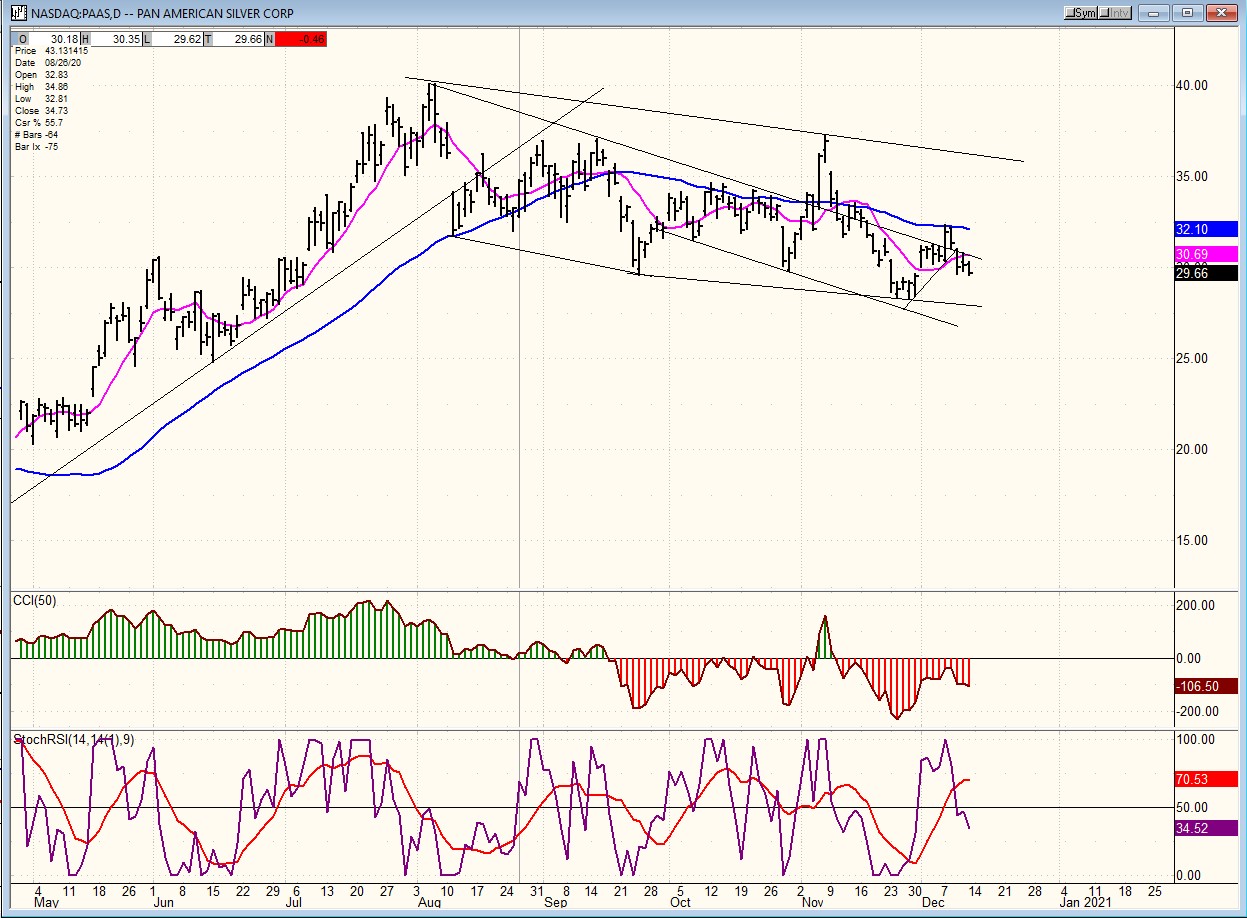
PAAS (Pan American Silver Corp-dly)
PAAS is consolidating the substantial gains that it made since its 10.61 low at the bottom of the March correction. When it has completed this pattern, it could easily move ~20 points higher before reaching the next top.
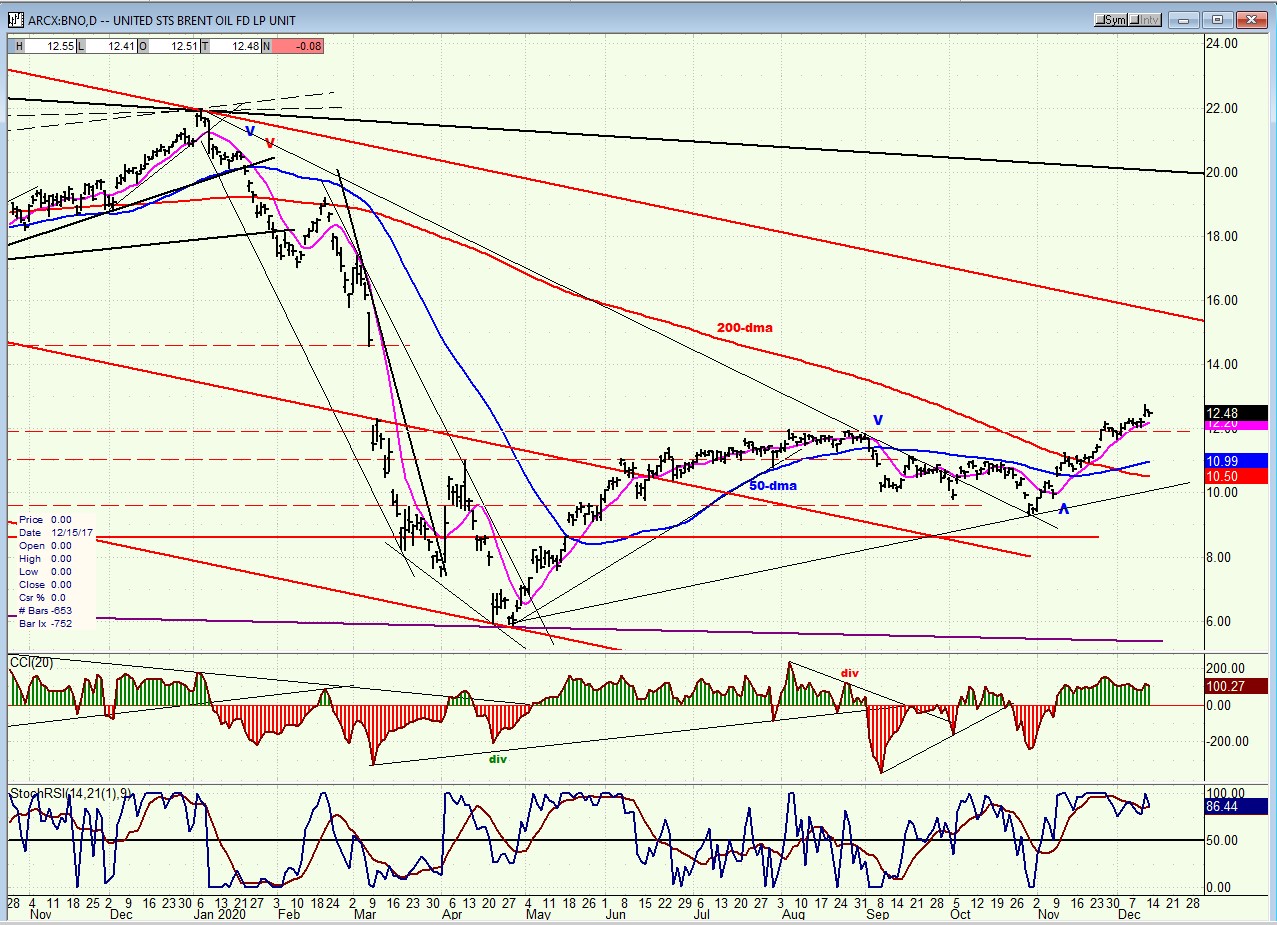
BNO (U.S. Brent Oil fund)
BNO has now cleared the top of its base and is likely heading for at least 14 and perhaps 16, but it will never again come close to trading anywhere near its 2014 high of 46.
SUMMARY
After making a top shy of its 3740 projection, SPX could retrace down to about 3600 before completing its current minor correction.
You may view our website at https://marketurningpoints.com
Free trial subscription
With a trial subscription, you will have access to the same information that is given to paid subscribers, but for a limited time-period. Over the years, I have developed an expertise in P&F charting (price projection), cycles (timing), EWT (structure), and general technical analysis which enables me to warn subscribers of pending reversals in market trends and how far that trend can potentially carry. For a FREE 2-week trial, subscription options and payment plans, I encourage you to visit my website at https://marketurningpoints.com
The above comments and those made in the daily updates and the Market Summary about the financial markets are based purely on what I consider to be sound technical analysis principles. They represent my own opinion and are not meant to be construed as trading or investment advice but are offered as an analytical point of view which might be of interest to those who follow stock market cycles and technical analysis.
********

When Andre Gratian was a stock broker years ago, a friend introduced him to technical analysis of the market. Consequently, it is not an exaggeration to say that Andre fell in love with this approach! Ever since then, it has become an increasingly important part of his professional life. Gratian has studied the works of Wyckoff, Edwards & Magee, Edward J. Dewey (cycles) and many others. However, one of my most profitable undertaking has probably been to study Point & Figure charting, which he finds invaluable in analyzing stocks and indices. If he were restricted to one methodology, this is the one that he would choose. This well-rounded background has given him what he feels to be a special insight into the stock market, facilitating the recognition of meaningful patterns and the ‘turning points’ in all trends, whether they be short or long term. Andre feels very comfortable discussing the stock market and passing on meaningful information to others. His subscribers include individuals and money managers throughout the world. Moreover, his Newsletters are currently published on several financial sites, here and abroad.


