Technical Analysis Of The Markets


Current Position of the Market
SPX Long-term trend: There is some good evidence that we are still in the bull market which started in 2009, and which could continue into the first quarter of 2021 before coming to an end.
SPX Intermediate trend: New intermediate uptrend underway since 2234.
Analysis of the short-term trend is done daily with the help of hourly charts. They are important adjuncts to the analysis of daily and weekly charts which determine longer market trends.
Awaiting Relief Bill Decision
Cycles: Looking ahead! 90-yr cycle – last low: 1932. Next low: 2022
7-yr cycle – last low: 2016. Next low: 2023
Market Analysis (Charts courtesy of QCharts
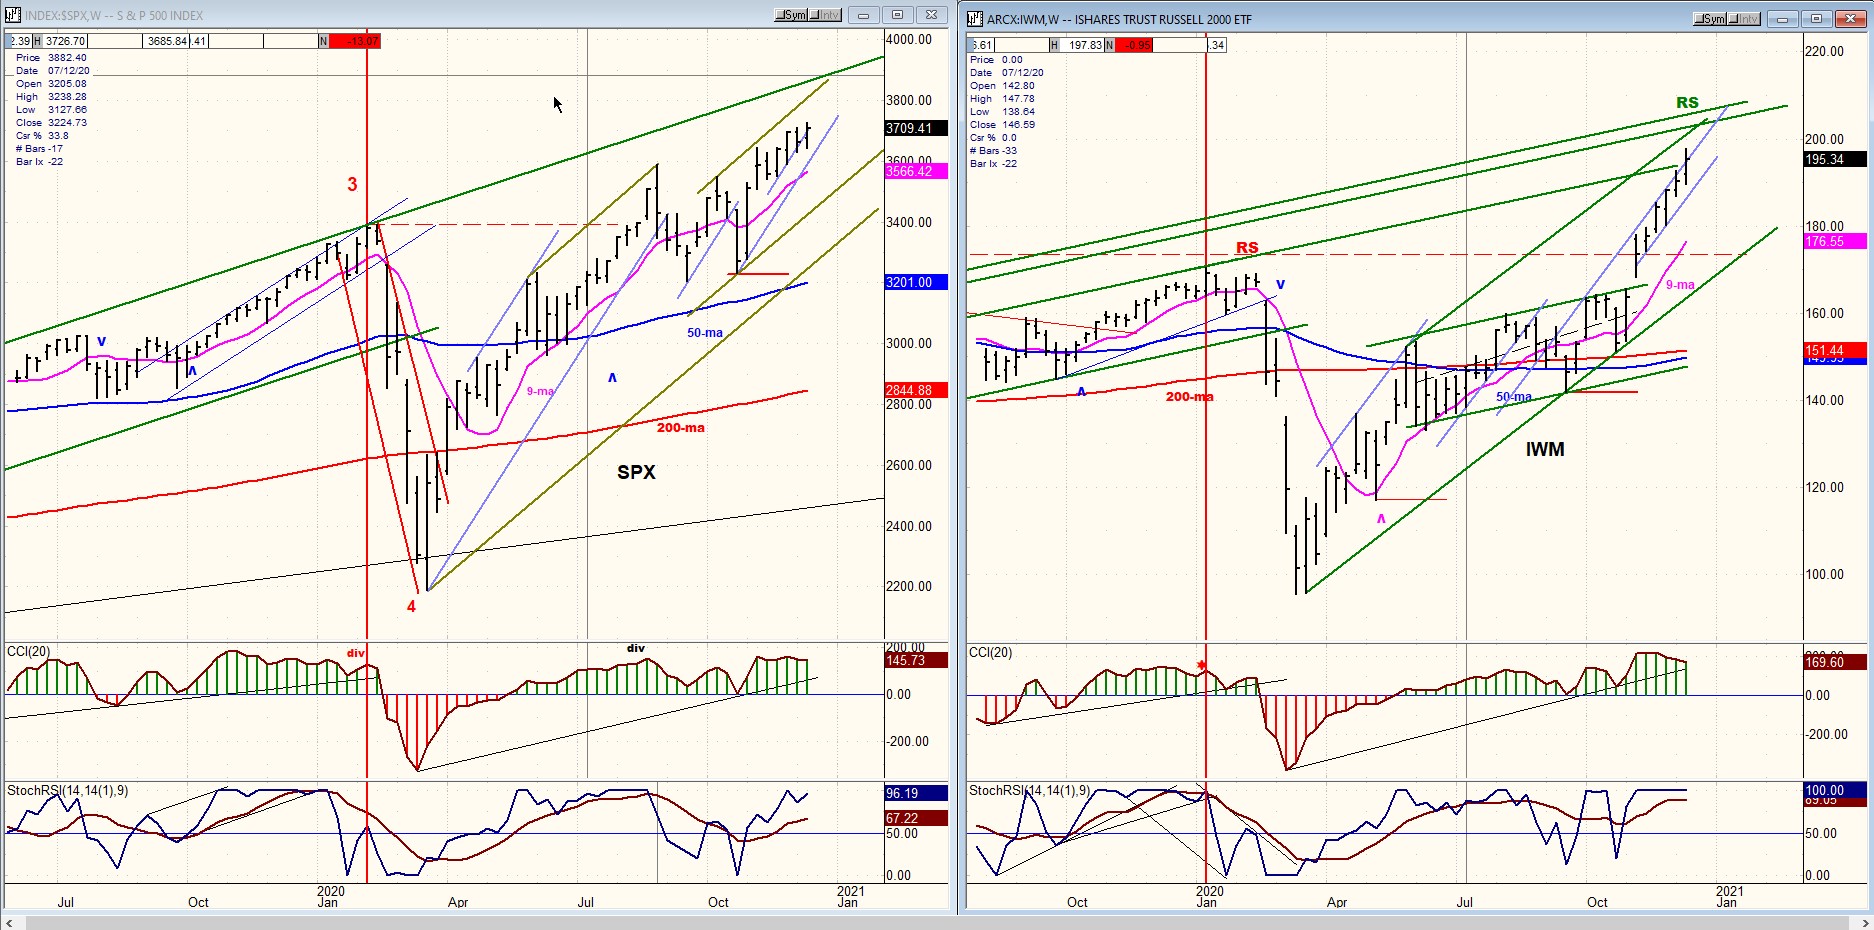
SPX-IWM weekly charts
Still no sign of relative weakness in IWM, but the index is reaching overhead trend lines which could provide resistance and halt its progress. The same can be said of SPX, but we are looking at weekly charts and an intermediate top still looks weeks away.
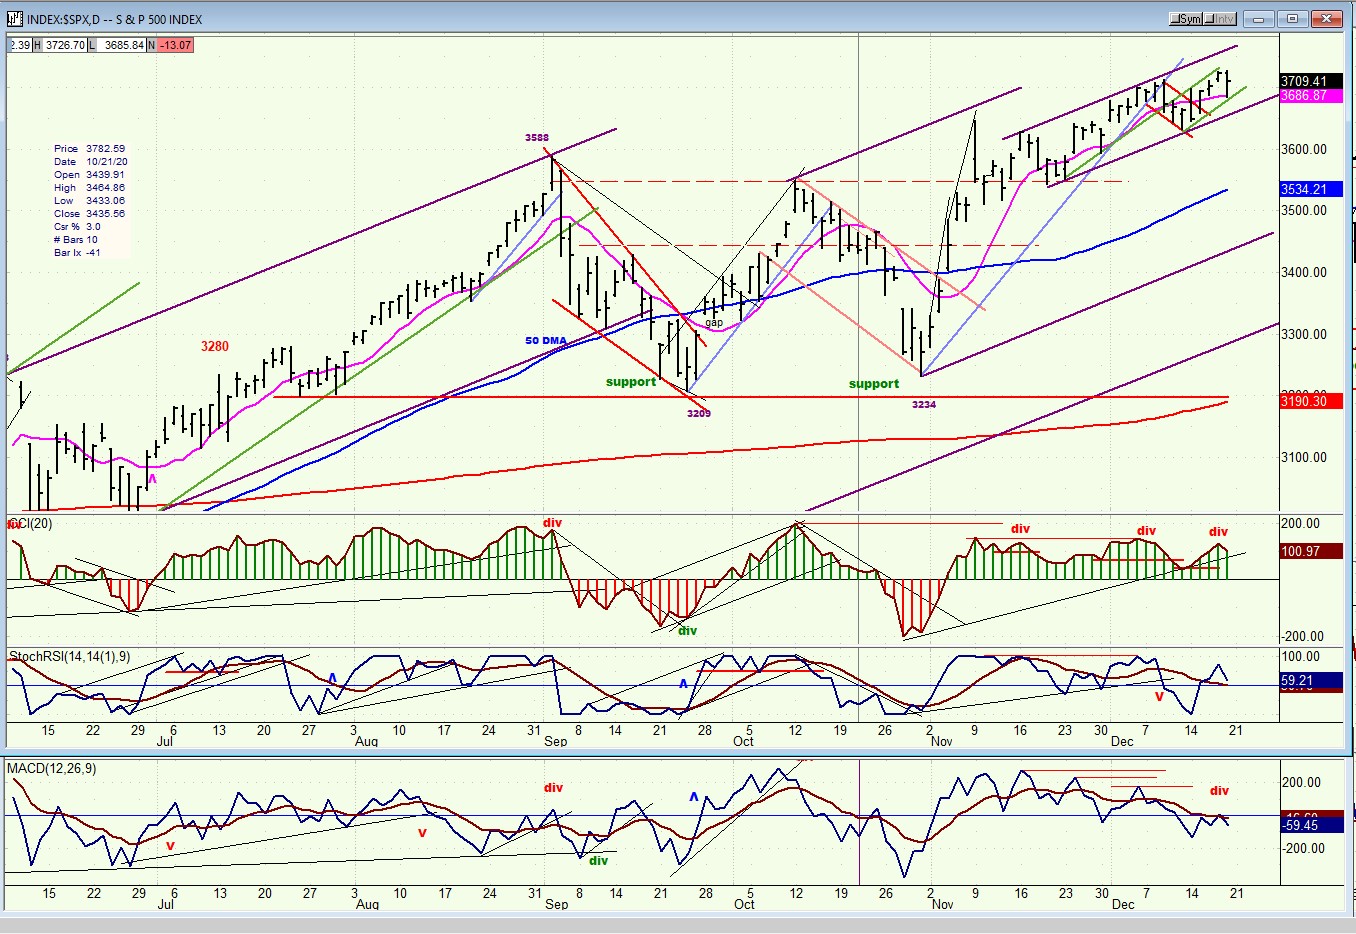
SPX daily chart
The near-term action in SPX will obviously result from whether the U.S. Congress passes another relief bill, and when! A senator mentioned that a vote would not be taken until Monday or Tuesday. The projection to 3740 which was made two weeks ago still stands, but given the current situation it would be foolish to make a definite forecast.
Friday’s action was fraught with volatility! After making a new high of 3726 in the first hour, the index started to correct, found support in the last hour on the 50-hr MA at 3686, and rallied back to 3716 just ahead of the close. This action will best be seen on the hourly chart.
An accurate evaluation of the market’s short-term position cannot be made before at least next Tuesday.
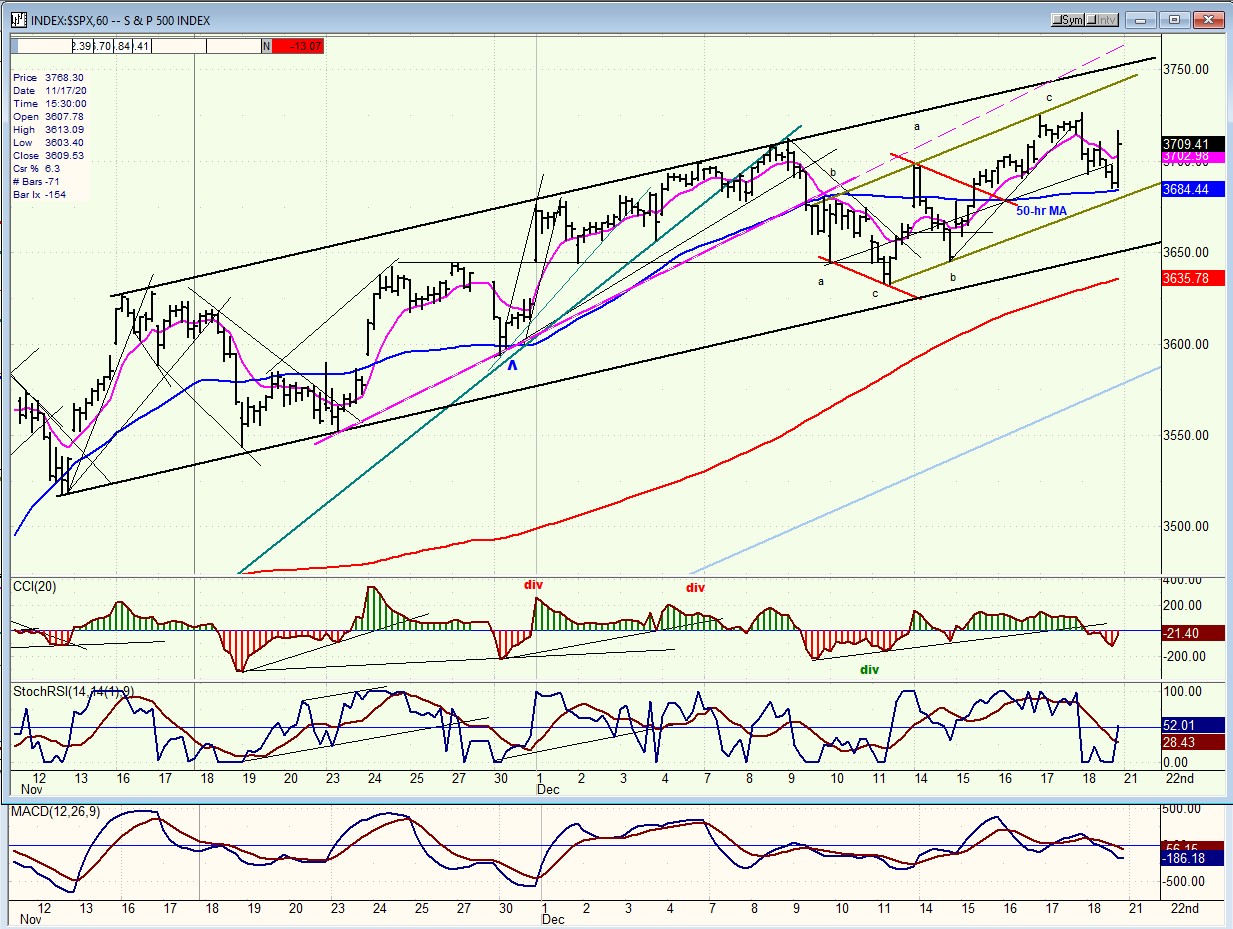
SPX hourly chart
For the past two months, the short-term trend of SPX has been confined to a gently rising channel with prices dutifully observing the upper and lower limits of that channel. During the past couple of weeks, the index has created another smaller channel within the larger one, with Friday’s action spanning the 40+ point width of the smaller channel. Whether or not a relief bill is passed, the predictable regularity of the trading action will probably come to an end and give way to a different chart pattern.
Since a vote is due to take place either Monday or Tuesday, we won’t be kept in suspense much longer.
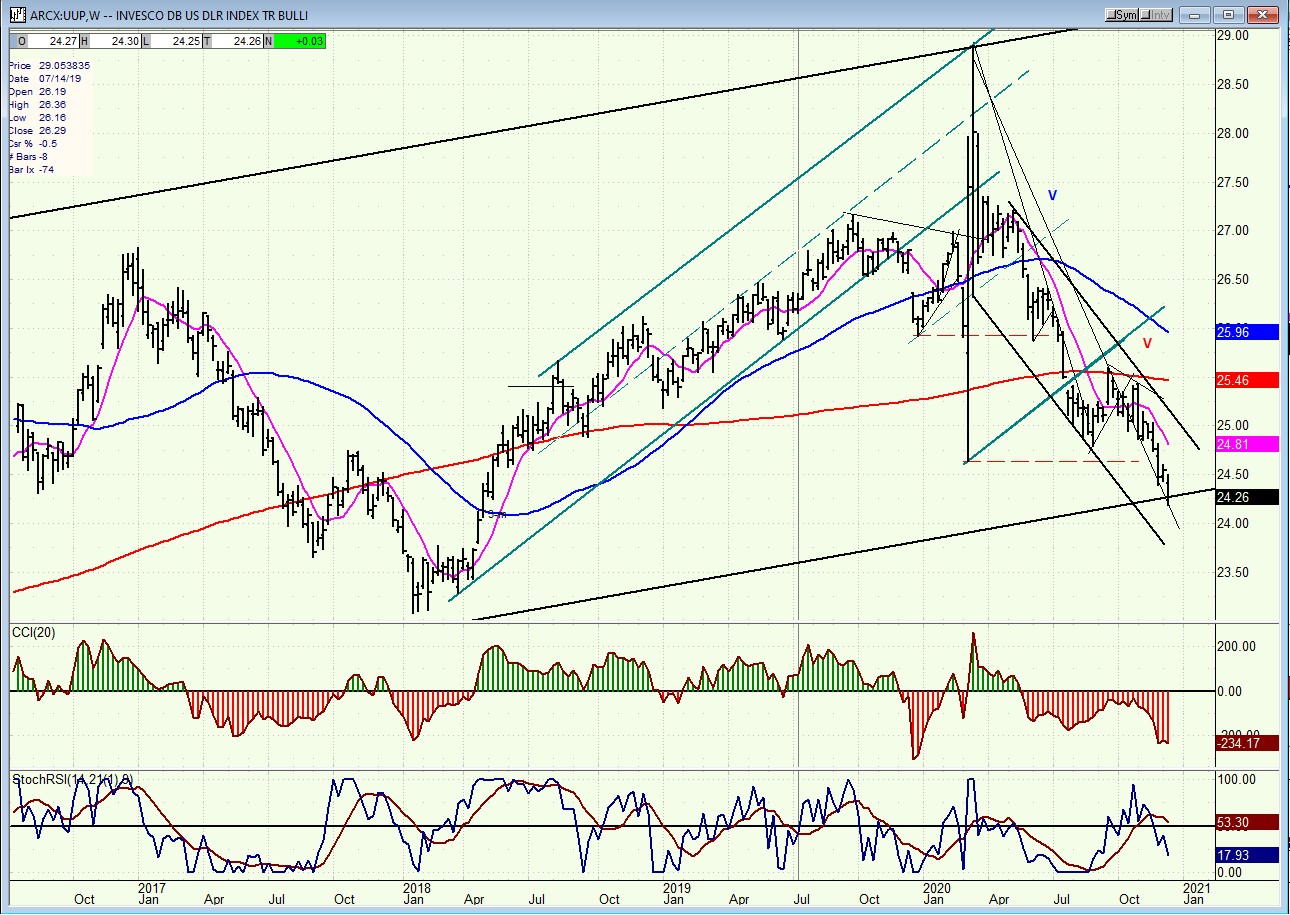
UUP (dollar ETF) WKLY ($USD chart not available from this data provider)
Liquidation of the $USD continues, and this has brought UUP down to the lower limits of a broad channel which goes back to 2014. The dollar is also approaching a short-term P&F target, and structure suggests that it may be ready for a bounce. This is reinforced by some positive divergence beginning to appear in the weekly UUP oscillators, with the divergence far more obvious at the daily time frame. All this would imply that UUP is ready for a rebound followed by at least one more dip over the not-too-distant future.
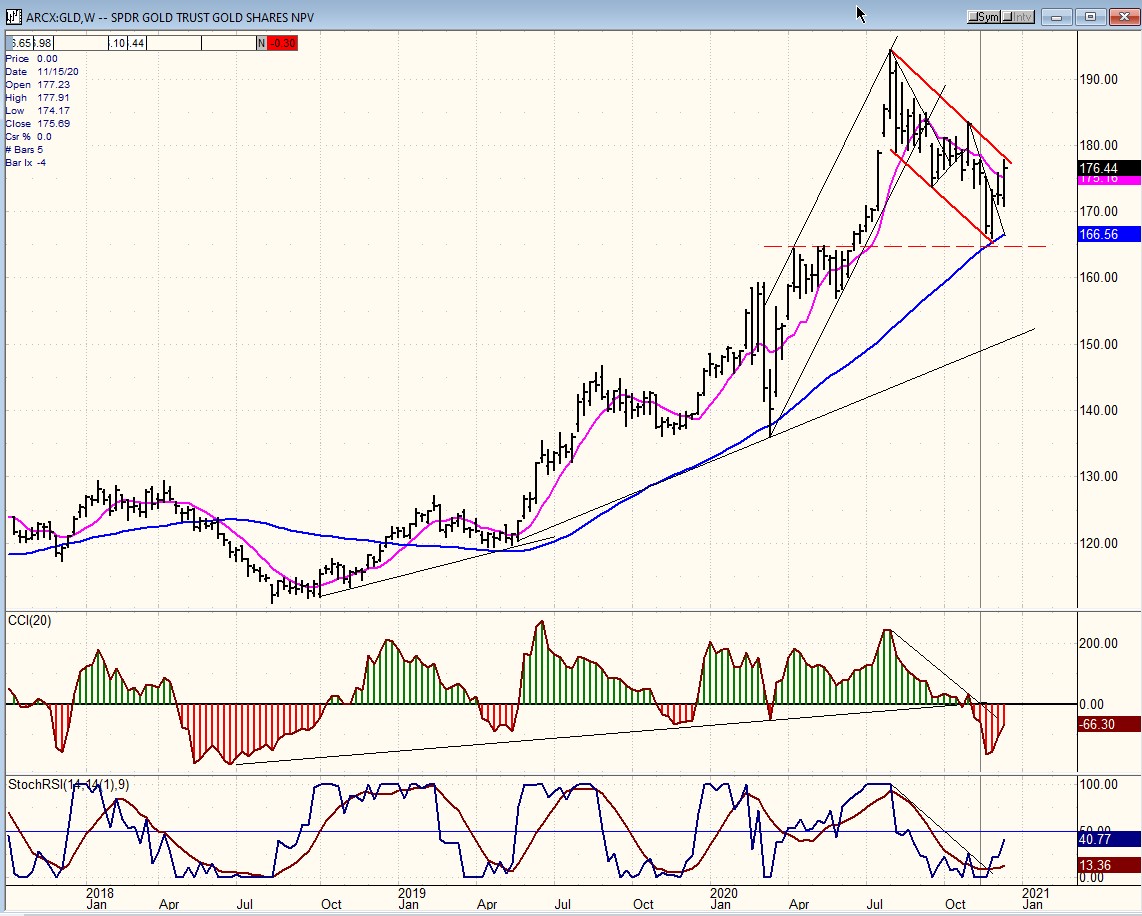
GLD (gold)-WKLY
GLD took advantage of the weakness in the dollar to rebound to the top of its correction channel. Looking ahead, more consolidation and a retest of the correction low will be needed before gold is ready to resume its long-term uptrend.
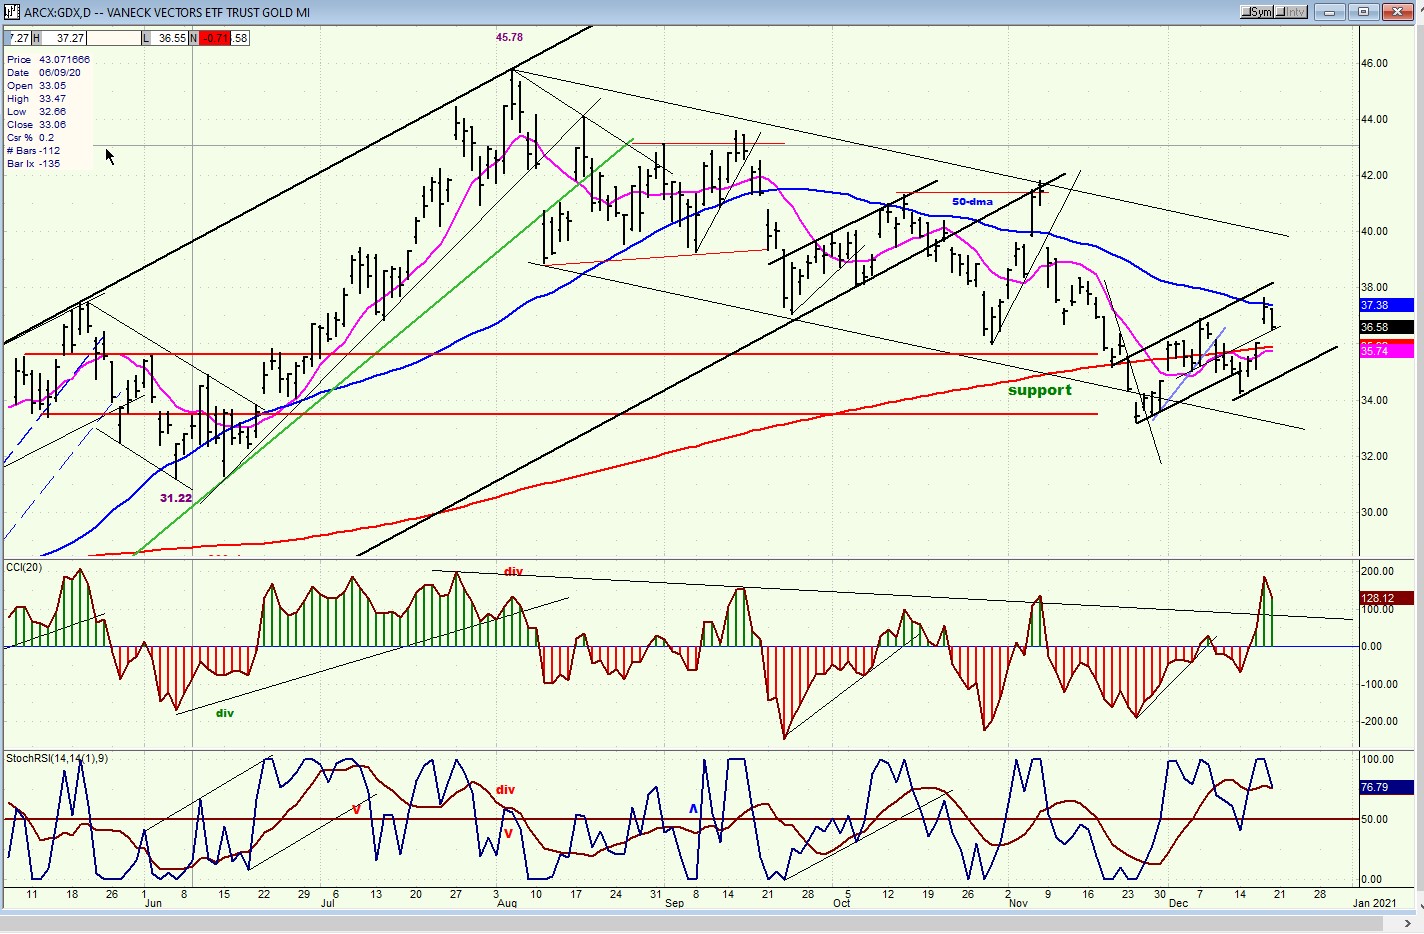
GDX (gold miners)-DLY
GDX has followed the lead of GLD and rebounded from its recent low. For the time being, it is being pushed back by resistance encountered at the 50-dma. While another point or so is possible over the near-term, just like GLD, GDX is not ready to make significant headway on the upside until it has extended its consolidation pattern. Higher prices are coming but bulls will have to wait a little longer!
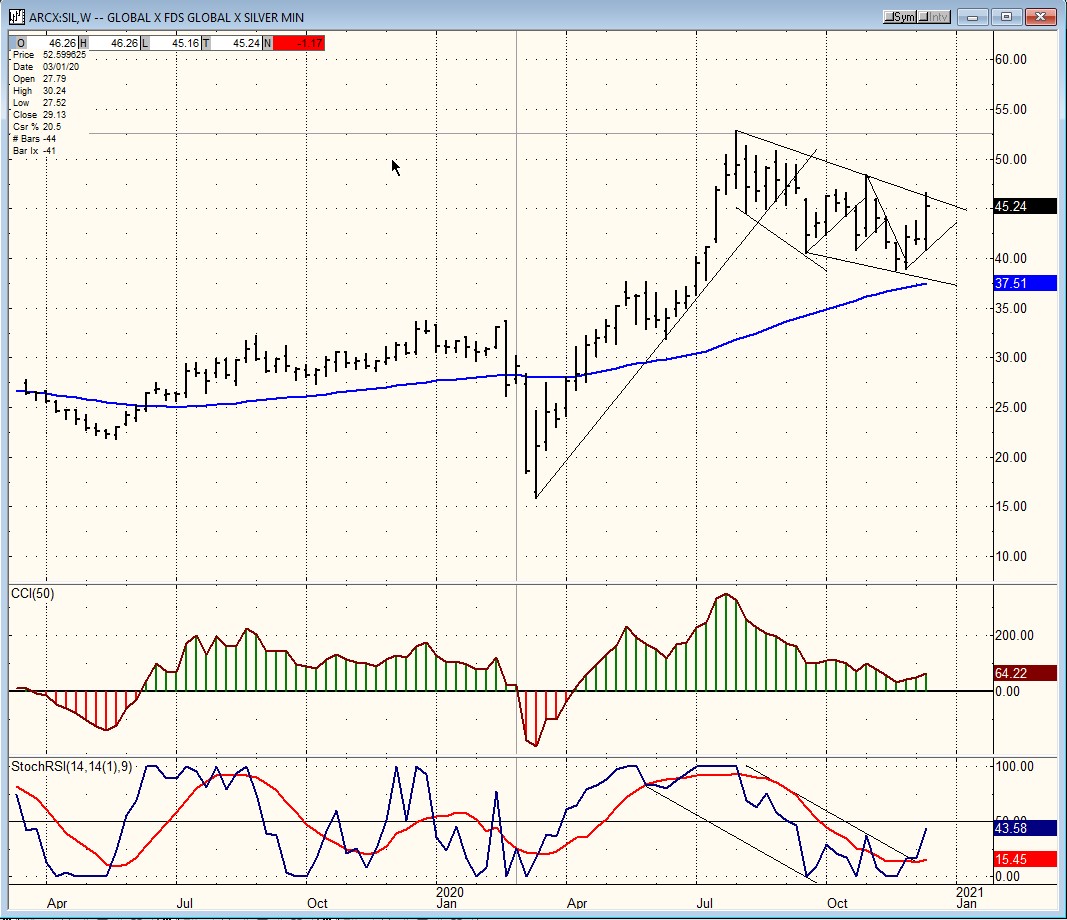
SIL (silver)-WKLY
Short-term and intermediate term, silver continues to resemble gold’s trading structure while, at the same time, it appears to be slightly stronger.
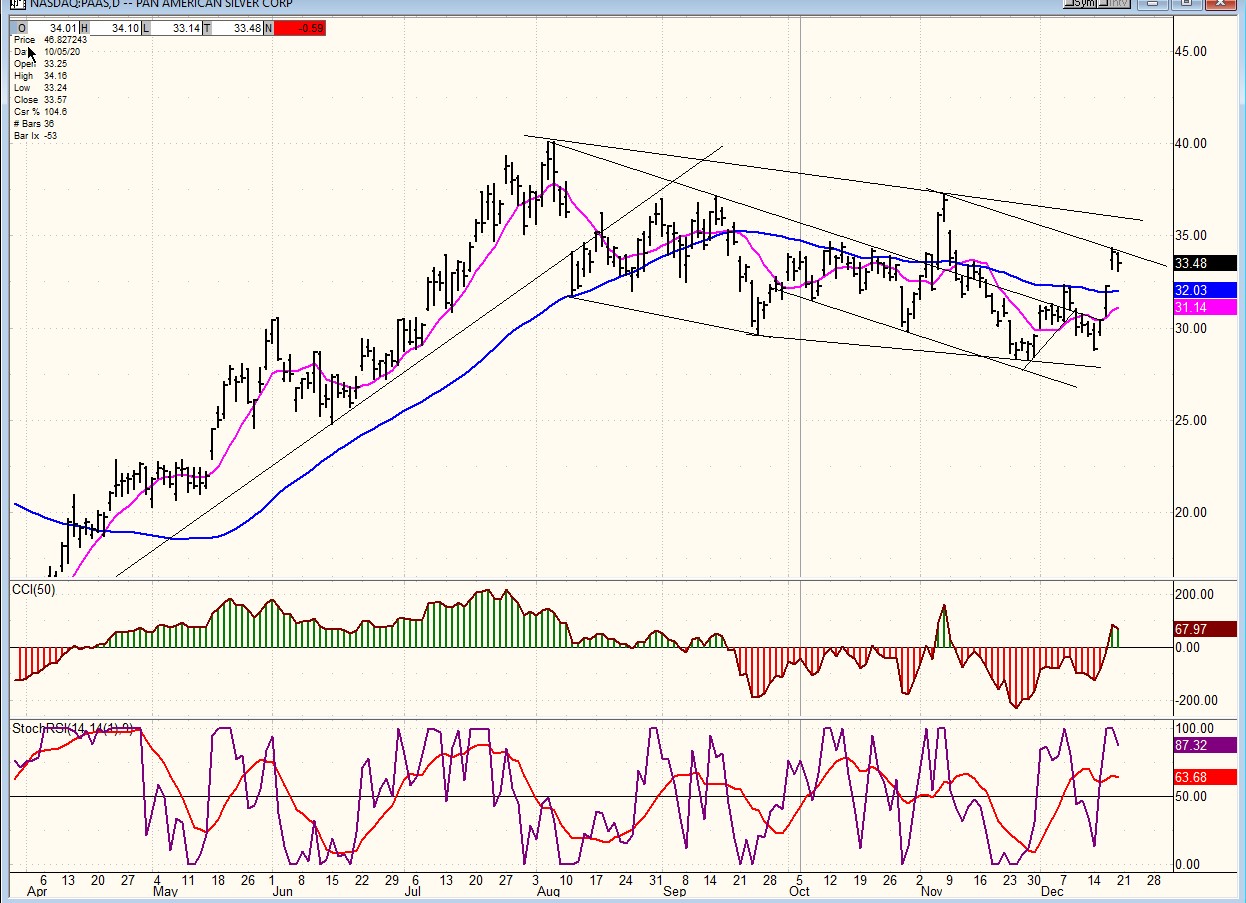
PAAS (Pan American Silver Corp-DLY)
What has been said about gold and silver indexes also applies to PAAS which is engaged in a correction which may have reached its low pricewise, but needs more time to complete.
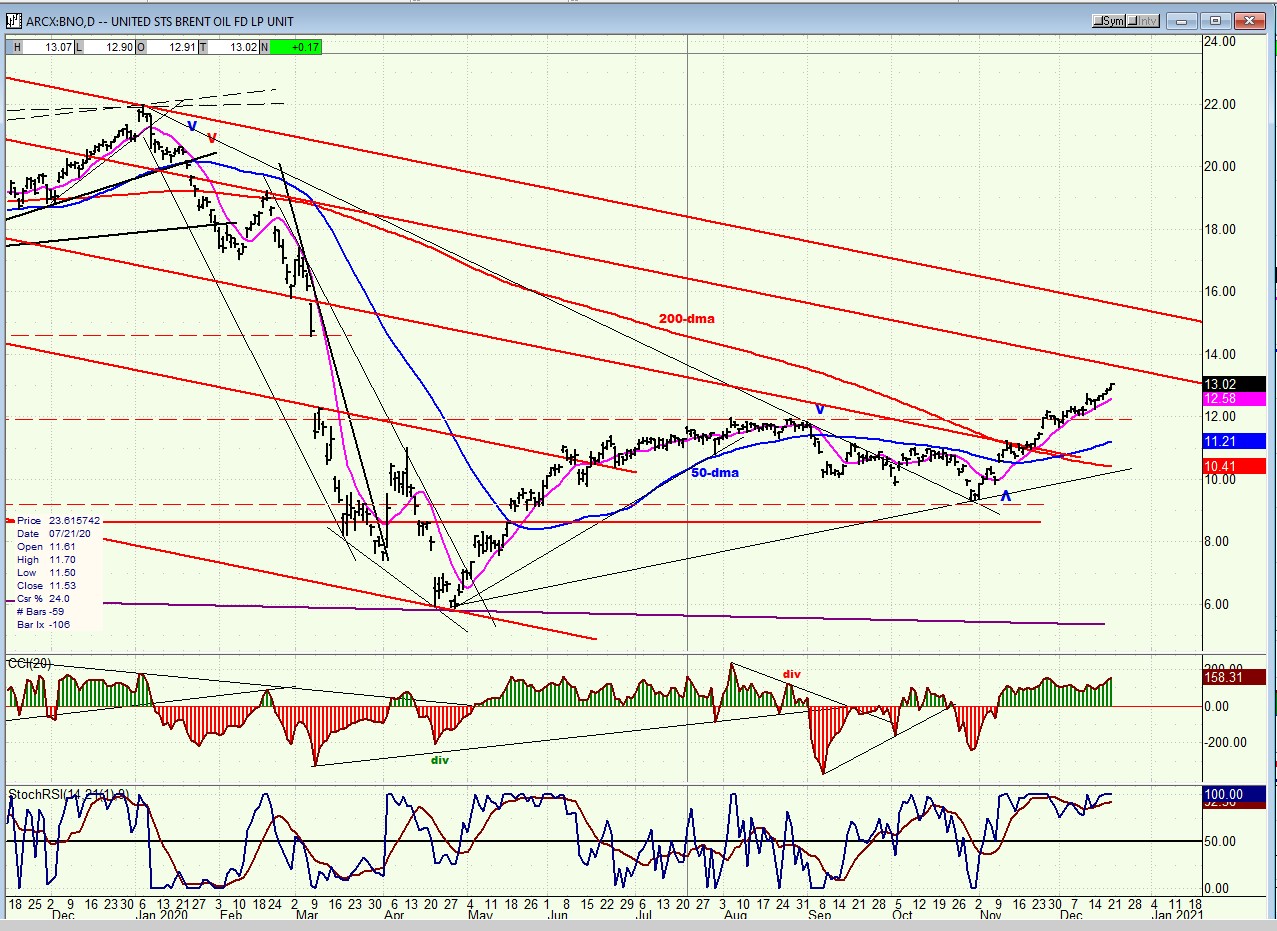
BNO (U.S. Brent Oil fund)
BNO has become the new energizer bunny – on a very limited scale, of course! It continues to drive toward its 14.00 target which is now only a point away.
SUMMARY
There is no apparent intermediate top on the horizon, but the short-term will be determined by the timing and success of the next relief bill which is now being considered by congress.
Andre
You may view our website at https://marketurningpoints.com
Free trial subscription
With a trial subscription, you will have access to the same information that is given to paid subscribers, but for a limited time-period. Over the years, I have developed an expertise in P&F charting (price projection), cycles (timing), EWT (structure), and general technical analysis which enables me to warn subscribers of pending reversals in market trends and how far that trend can potentially carry. For a FREE 2-week trial, subscription options and payment plans, I encourage you to visit my website at https://marketurningpoints.com
The above comments and those made in the daily updates and the Market Summary about the financial markets are based purely on what I consider to be sound technical analysis principles. They represent my own opinion and are not meant to be construed as trading or investment advice but are offered as an analytical point of view which might be of interest to those who follow stock market cycles and technical analysis.
********

When Andre Gratian was a stock broker years ago, a friend introduced him to technical analysis of the market. Consequently, it is not an exaggeration to say that Andre fell in love with this approach! Ever since then, it has become an increasingly important part of his professional life. Gratian has studied the works of Wyckoff, Edwards & Magee, Edward J. Dewey (cycles) and many others. However, one of my most profitable undertaking has probably been to study Point & Figure charting, which he finds invaluable in analyzing stocks and indices. If he were restricted to one methodology, this is the one that he would choose. This well-rounded background has given him what he feels to be a special insight into the stock market, facilitating the recognition of meaningful patterns and the ‘turning points’ in all trends, whether they be short or long term. Andre feels very comfortable discussing the stock market and passing on meaningful information to others. His subscribers include individuals and money managers throughout the world. Moreover, his Newsletters are currently published on several financial sites, here and abroad.


