Technical Analysis Of The Markets


Current Position of the Market
SPX Long-term trend: There is some good evidence that we are still in the bull market which started in 2009 and which could continue into the first half of 2021 before coming to an end.
SPX Intermediate trend: SPX is not likely to end its intermediate trend until it reaches about 4150.
Analysis of the short-term trend is done daily with the help of hourly charts. They are important adjuncts to the analysis of daily and weekly charts which determine longer market trends.
Near Correction Low
Cycles: Looking ahead! 90-yr cycle – last lows: 1843-1933. Next low: ~2023.
7-yr cycle – last lows: 2009-2016. Next low: 2023
Market Analysis (Charts courtesy of QCharts
The current correction is affecting both indexes equally. For this reason, and because the P&F count suggests that we should move higher before reaching an intermediate top, the odds favor this retracement to be only a short-term consolidation which is nearly over.
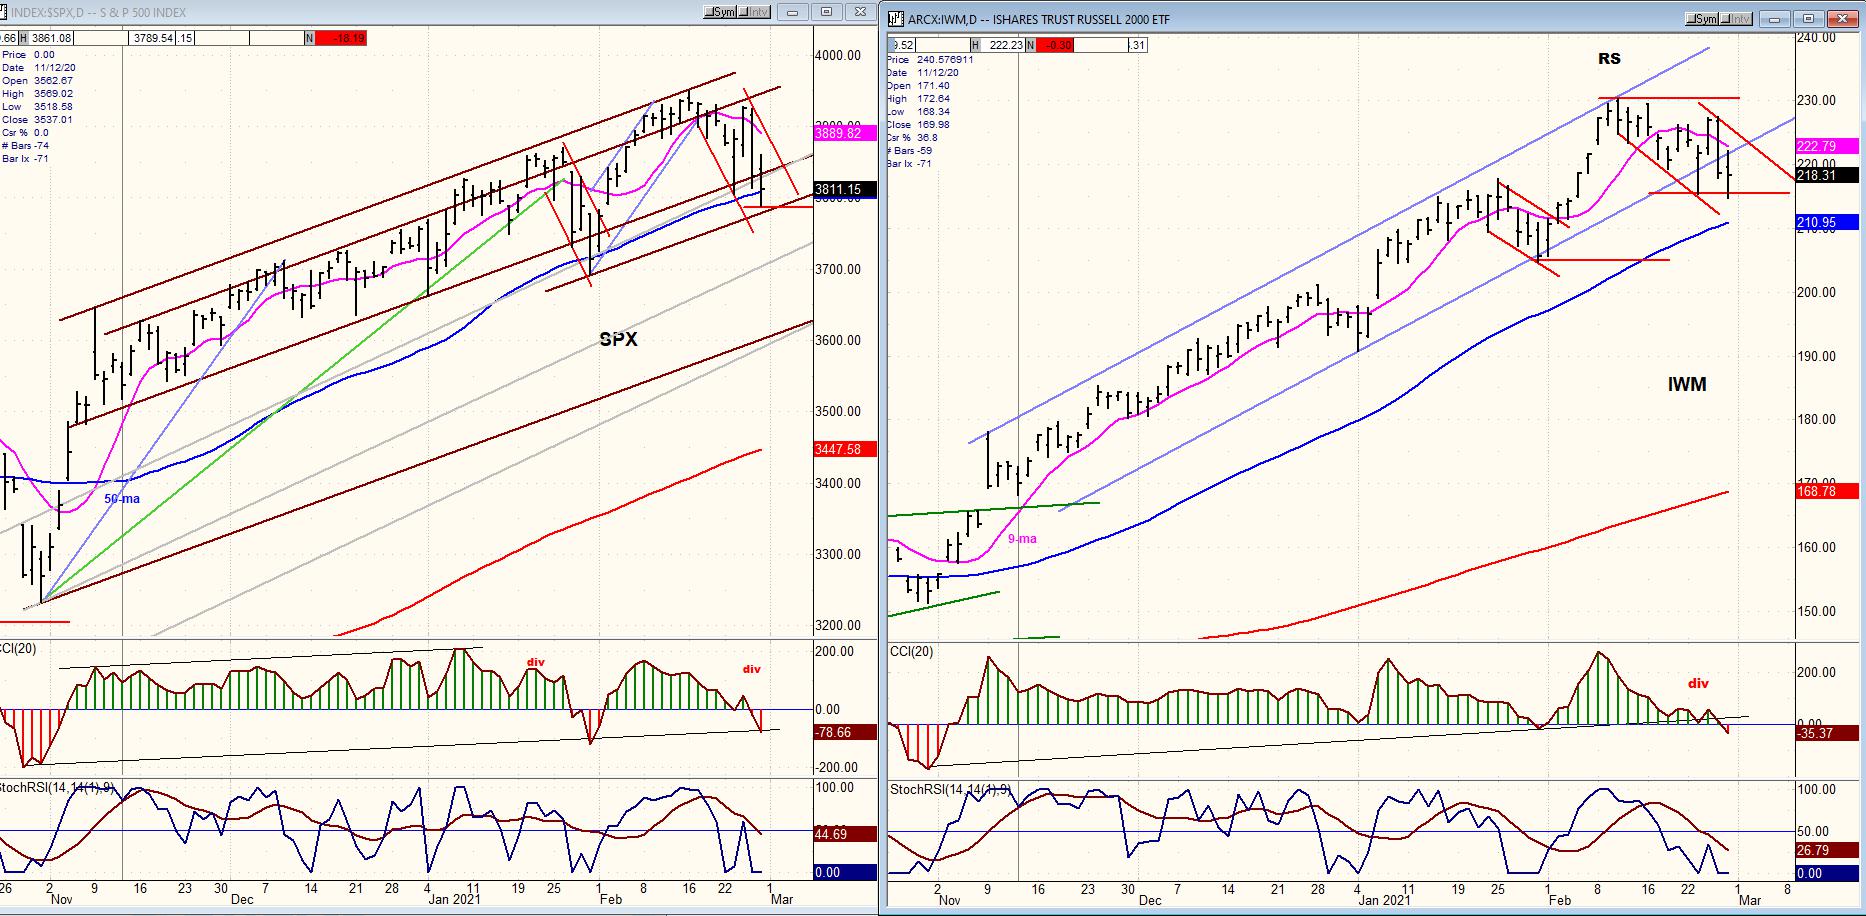
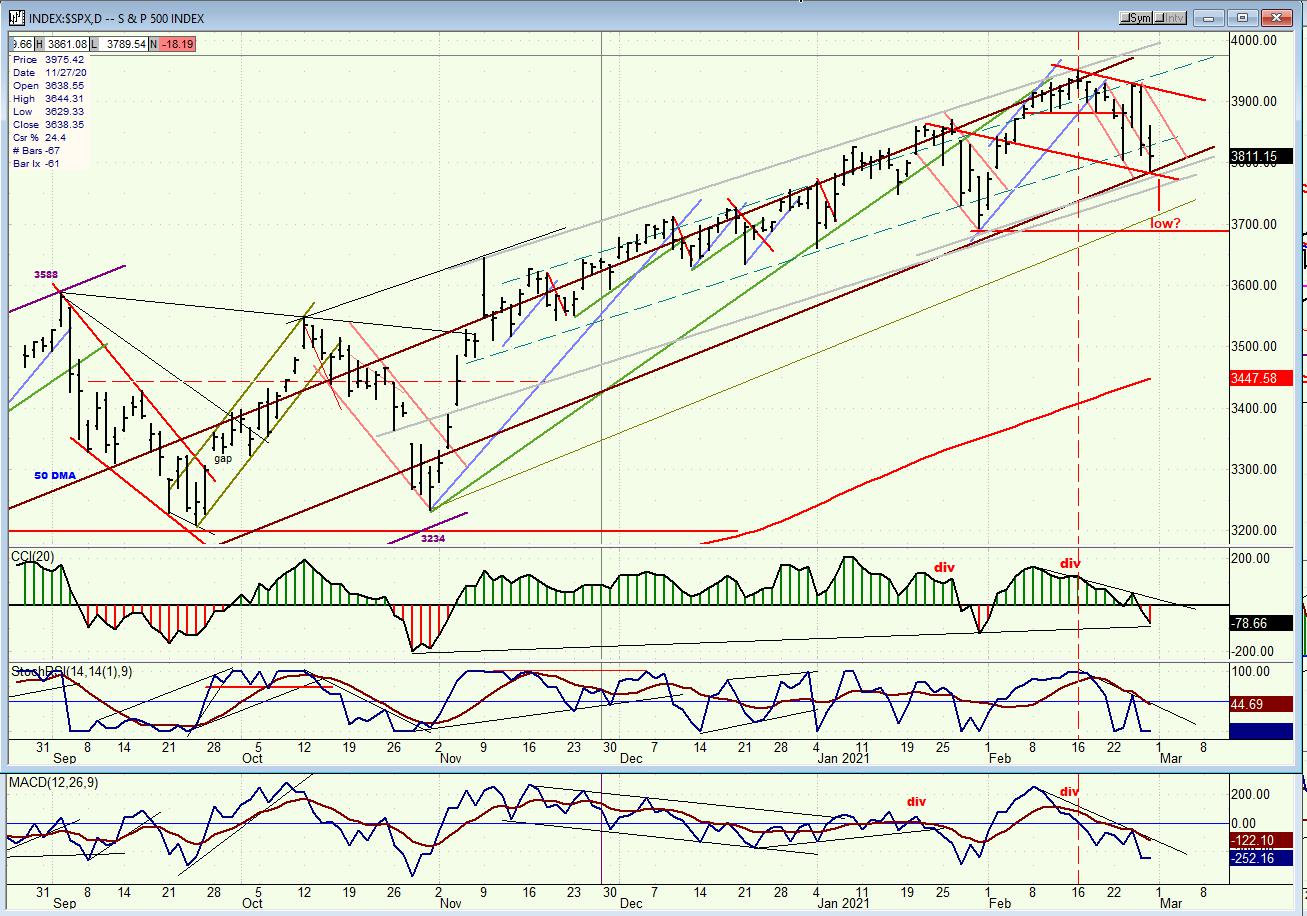
SPX daily chart
After reaching the top of its intermediate channel two weeks ago and drifting across the small blue channel -- moves which produced negative divergence in the daily oscillators -- SPX looked ready for a short-term correction. This was made all the more probable by the fact that the index had reached the P&F projection of 3950 which had been generated by the congestion pattern formed at the former short-term low. Trading outside of the blue channel signaled that the correction was about to begin.
During the past week SPX corrected 160 points, reaching 3790 on Friday before rebounding after touching the bottom intermediate channel line. The price recovery fell just shy of the normal .50 retracement of the decline from the previous high and the index spent the rest of the day in a trading range, but additional selling into the close suggests that the correction is not quite over.
If Monday brings about a new low to 3780, the correction could end quickly. This is the preferred scenario! If there is continued weakness, we could drop down to about 3700 before bottoming, but if the selling is over on Monday, the odds favor starting a new uptrend to a new all-time high. The near-term forecast still calls for a move to about 4150 before reaching the level at which a more important top will form.
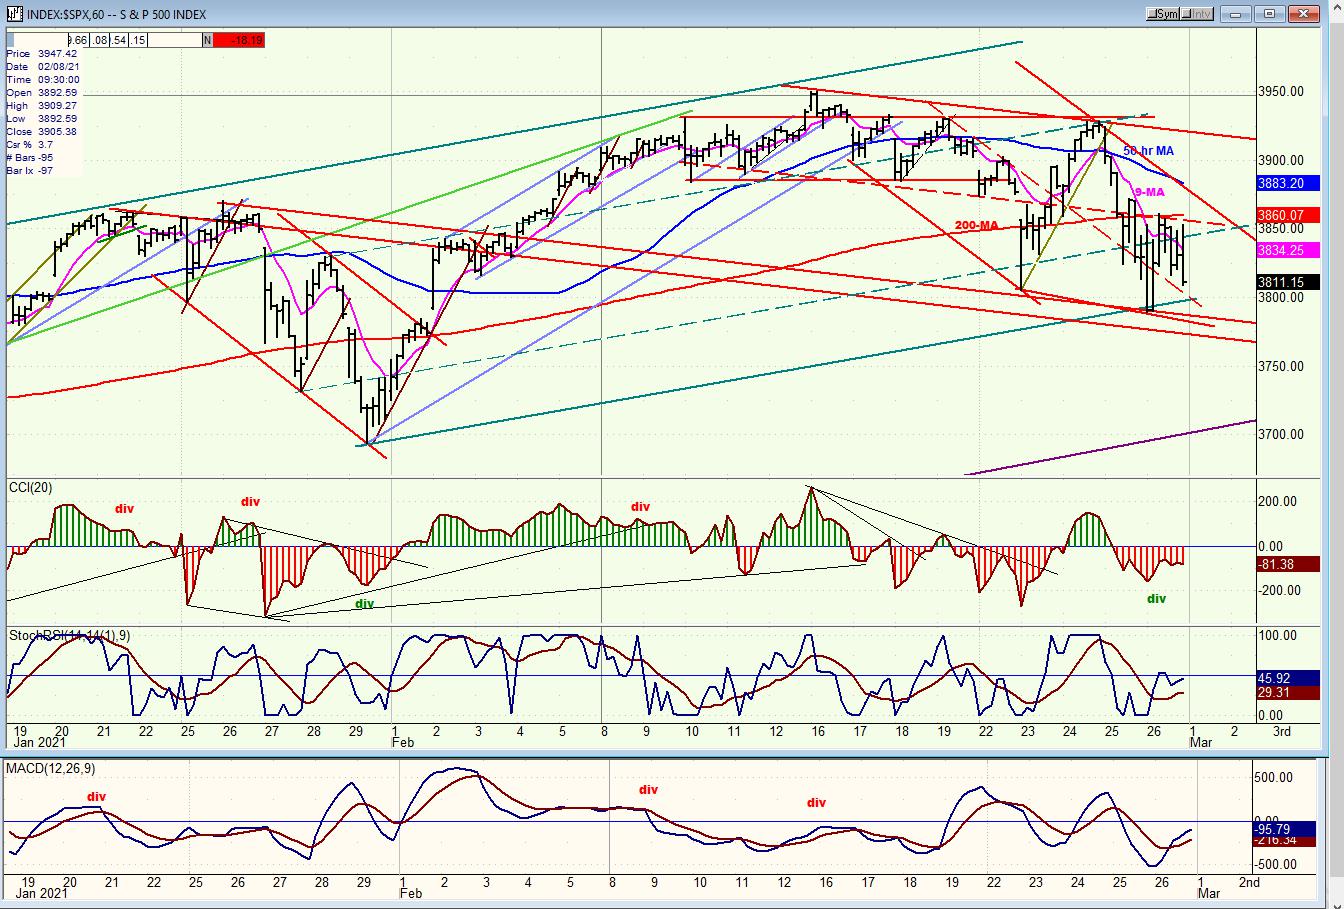
SPX hourly chart
The hourly chart shows the grey uptrend channel which stopped prices at their highs and at their lows. Dashed parallels which partition the trend channel into sections also provide support and resistance within the main channel. The blue 50-hr MA normally points to the beginning and to the end of the correction when it is crossed. As you can see, it was crossed near the channel top, leading to the first decline (a-wave) of the correction. Connecting the b-wave rally high to 3950 created a red downtrend line, and by drawing a parallel across the former short-term high of 3870, we formed a shallow channel the bottom of which has supported prices on two separate occasions.
Some steeper trend lines were also drawn to define the parameters of the shorter correction channel. Friday’s action took place in the outer half of the small channel, suggesting that the consolidation may soon come to an end -- probably after the index makes another trip to the bottom of the larger red channel. The downside projection derived from the top congestion pattern tells us that the correction is likely to end around 3780. If Friday’s late decline continues to the bottom of the larger channel, it will likely again find support at the targeted price level. A reversal would then be expected which would move the index out of the smaller channel, rise above the blue 50 MA, and challenge the former high. The index’s inability to cross above the top red downtrend line right away would not be a problem, but if it fails to do so on a second attempt after a small pullback, it could mean that a longer correction is underway, in which case the decline could continue down to about 3700.
If the positive divergence which has already formed in the hourly oscillators is preserved on the next low, it will add to the perception that we have probably come to an end of the correction.
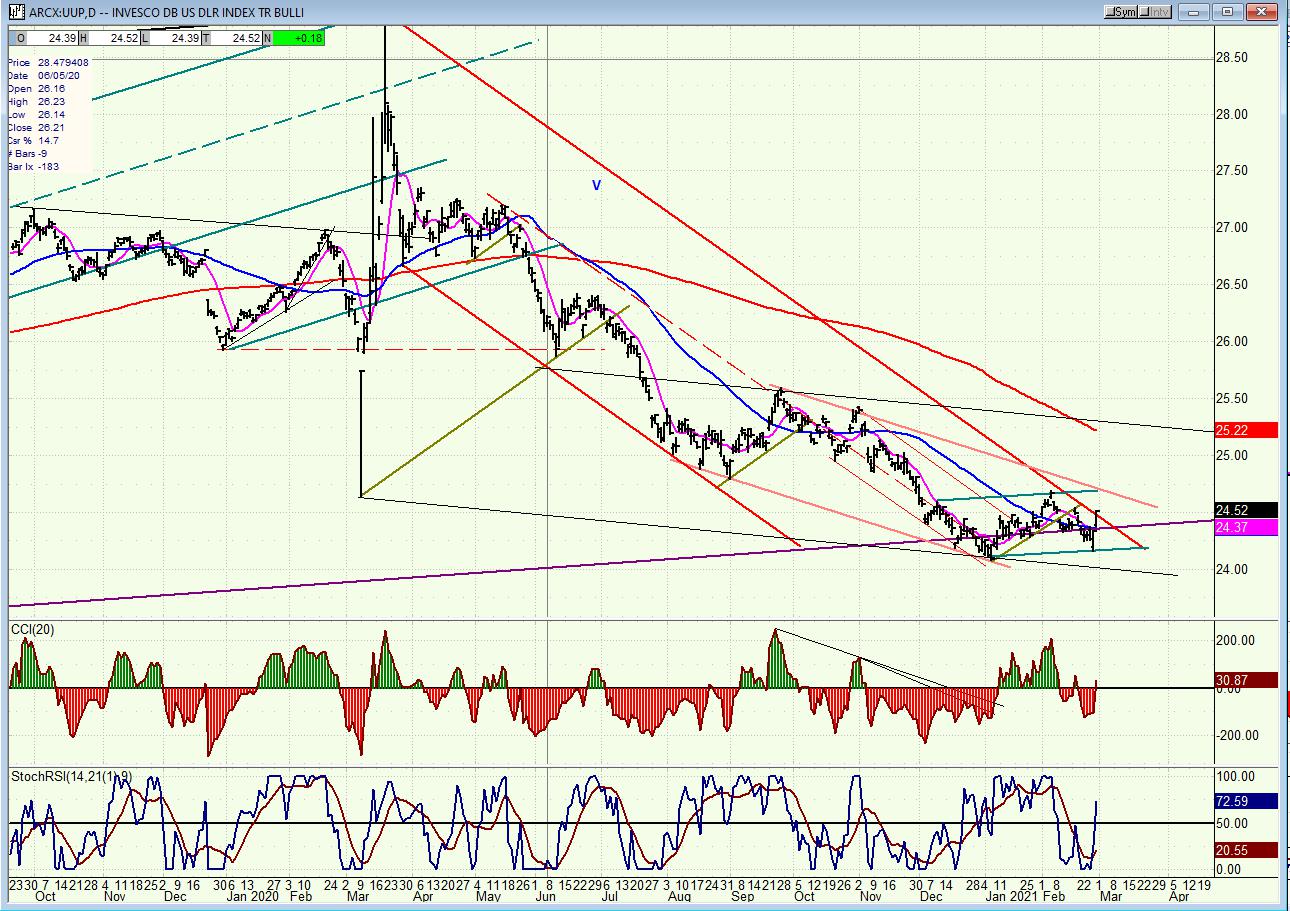
UUP (dollar ETF) DLY ($USD chart is not available from this data provider)
UUP is again finding support at its lower long-term channel and challenging the outer intermediate channel line. The pattern is still one of intermediate deceleration, so it is not yet a given that UUP can get back into an uptrend. In order to do that, it would first have to get out of the small red channel and then move past the red 200-dma.
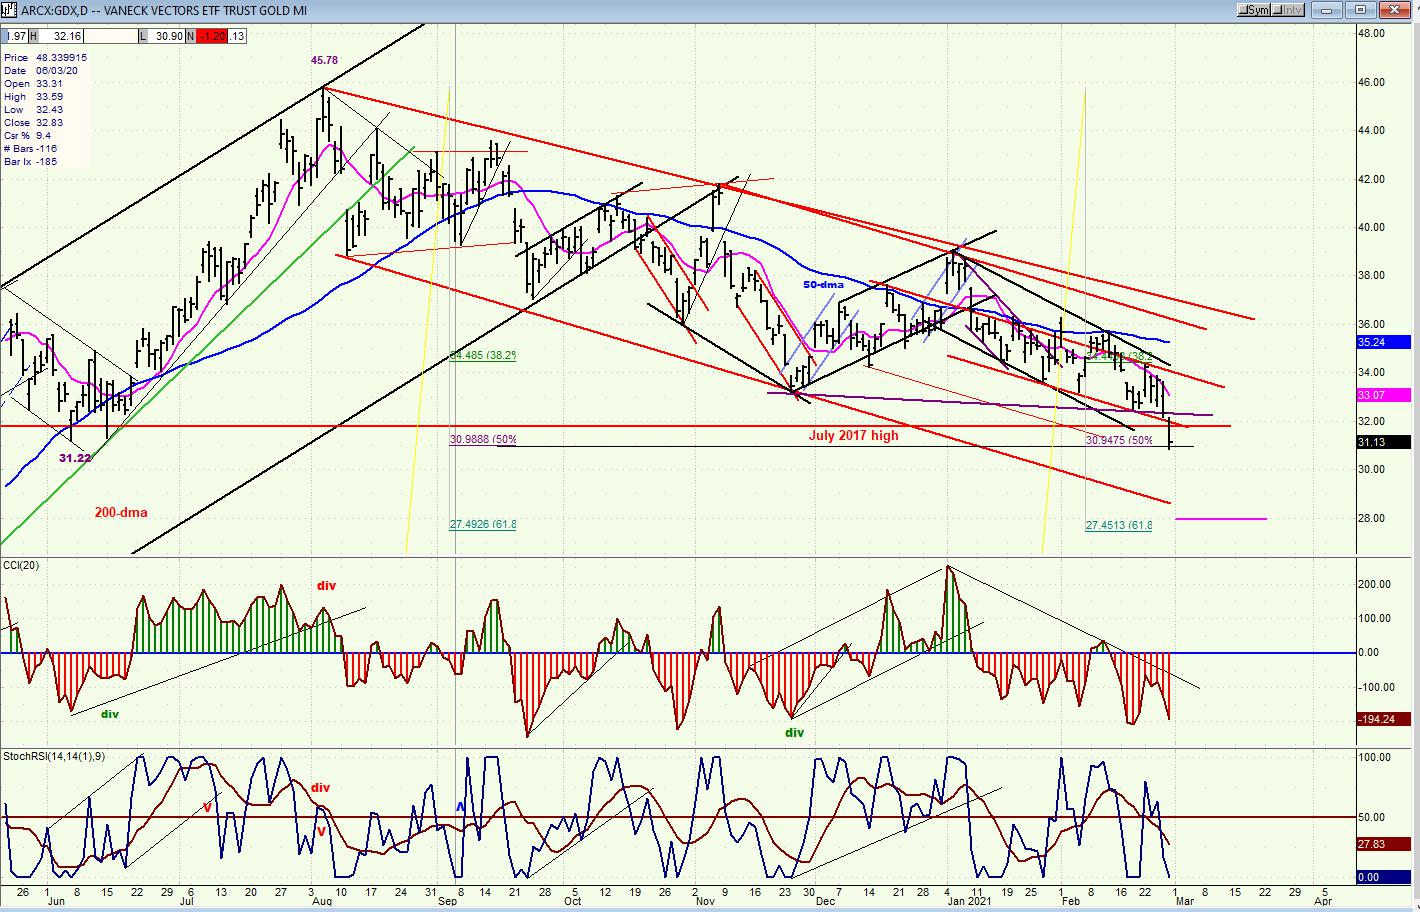
GDX (gold miners)-DLY
GDX could not take advantage of some cycles due to bottom in the past few days and, on Friday it made a new low. This keeps it in an intermediate trend correction channel with a good chance that it will move still lower. It may now not be able to reverse until it has retrced .618 of its previous up-trend. That would bring the low of the correction closer to 28.00 -- still another three points lower than where it closed on Friday.
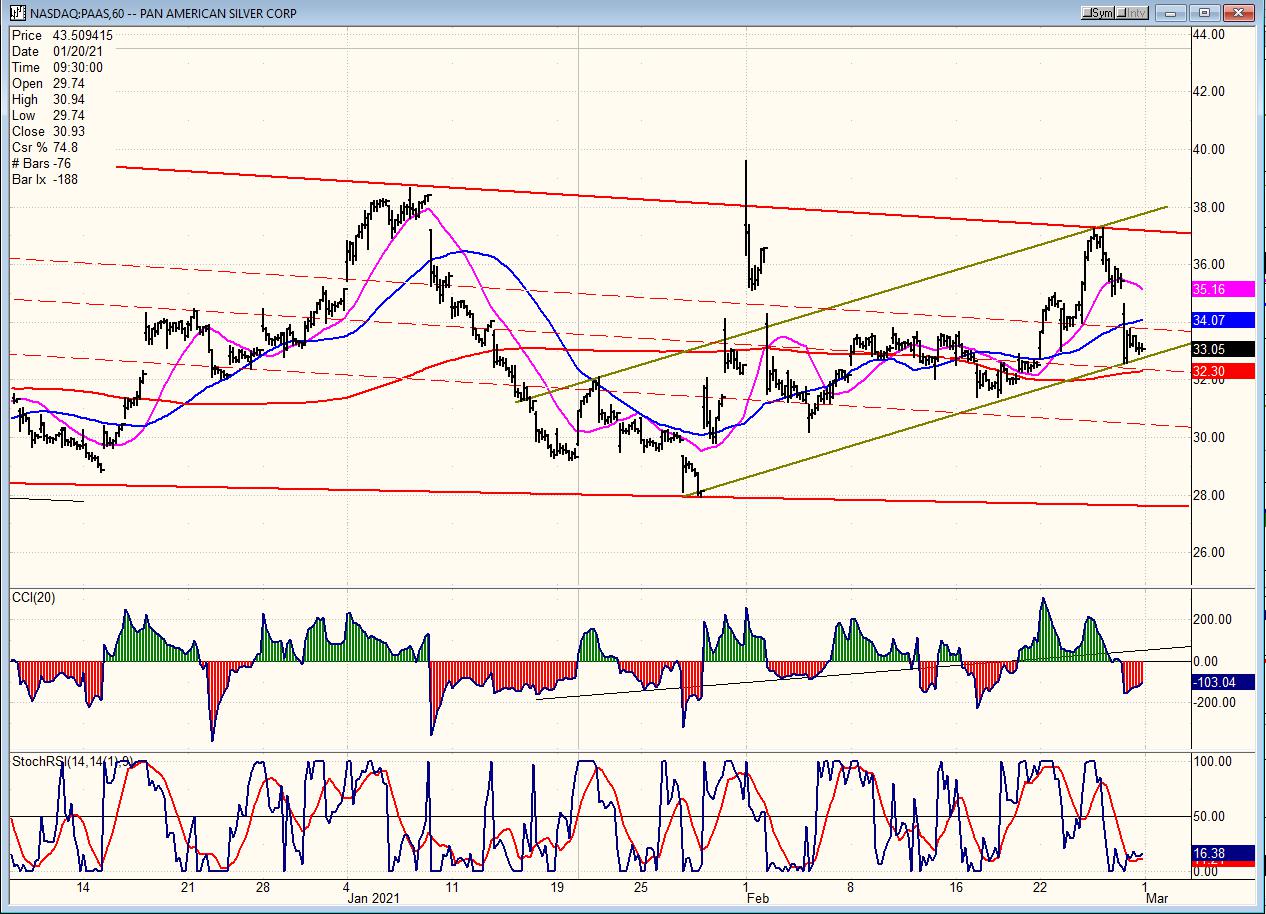
PAAS (Pan American Silver Corp-DLY)
Although much stronger than GDX, PAAS could not get out of its consolidation channel and it is retracing. It’s unlikely that it will drop back all the way down to the bottom of the channel, but it could still come down one or two points lower before making another attempt at resuming its long-term uptrend.
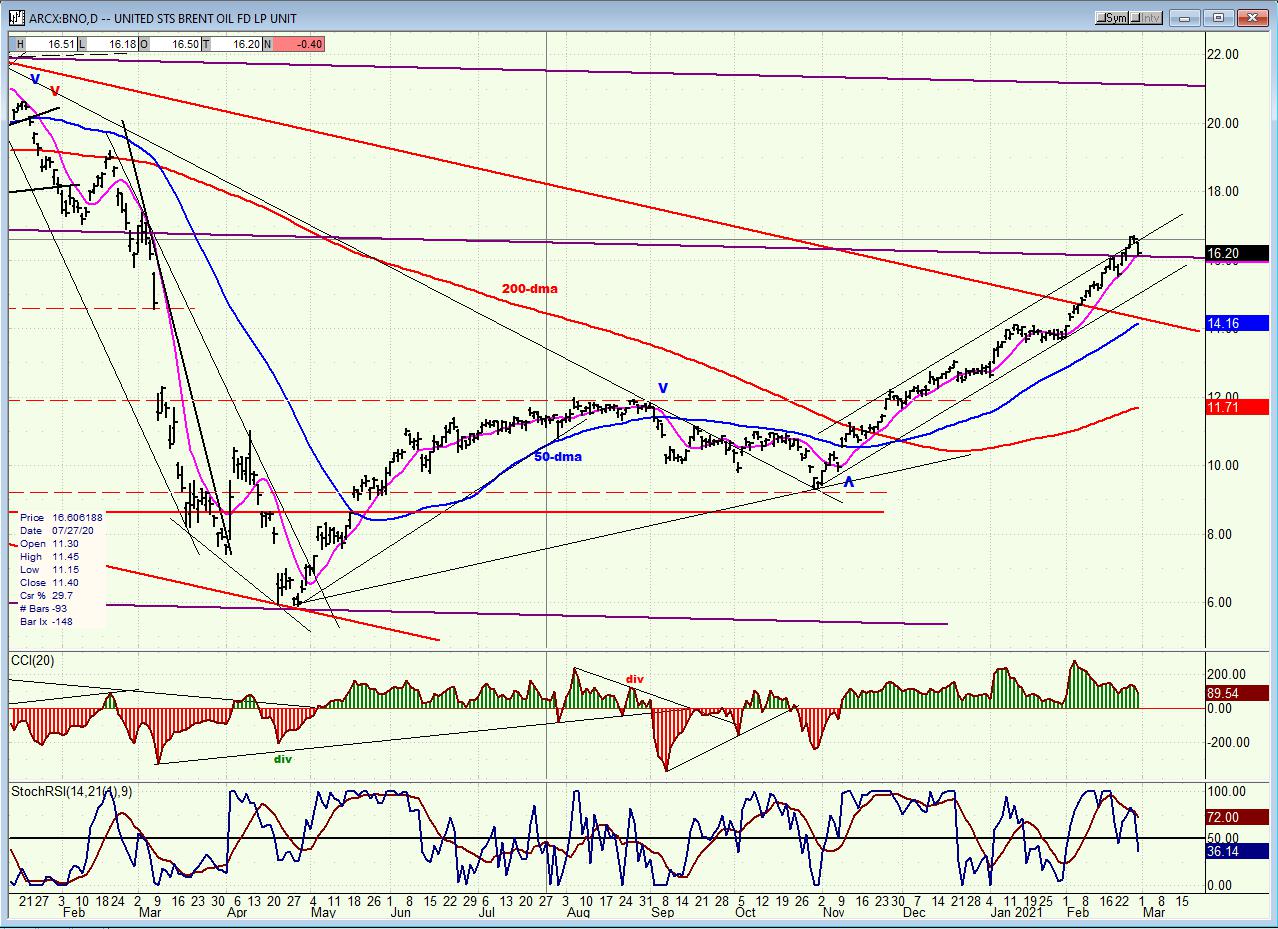
BNO (Brent oil fund) wkly.
BNO has now filled its projection to 16, has found resistance at the top of a bullish channel, and has started to pullback. It could take advantage of some weak count to push another point or two higher when SPX makes a new high.
SUMMARY
SPX is running into more and more resistance as it pushes closer to its ideal 4150 intermediate top, but the current short-term correction stands a good chance of being over as early as Monday.
Free trial subscription
With a trial subscription, you will have access to the same information that is given to paid subscribers, but for a limited time-period. Over the years, I have developed an expertise in P&F charting (price projection), cycles (timing), EWT (structure), and general technical analysis which enables me to warn subscribers of pending reversals in market trends and how far that trend can potentially carry. For a FREE 2-week trial, subscription options and payment plans, I encourage you to visit my website at www.marketurningpoints.com.
The above comments and those made in the daily updates and the Market Summary about the financial markets are based purely on what I consider to be sound technical analysis principles. They represent my own opinion and are not meant to be construed as trading or investment advice but are offered as an analytical point of view which might be of interest to those who follow stock market cycles and technical analysis.
*******

When Andre Gratian was a stock broker years ago, a friend introduced him to technical analysis of the market. Consequently, it is not an exaggeration to say that Andre fell in love with this approach! Ever since then, it has become an increasingly important part of his professional life. Gratian has studied the works of Wyckoff, Edwards & Magee, Edward J. Dewey (cycles) and many others. However, one of my most profitable undertaking has probably been to study Point & Figure charting, which he finds invaluable in analyzing stocks and indices. If he were restricted to one methodology, this is the one that he would choose. This well-rounded background has given him what he feels to be a special insight into the stock market, facilitating the recognition of meaningful patterns and the ‘turning points’ in all trends, whether they be short or long term. Andre feels very comfortable discussing the stock market and passing on meaningful information to others. His subscribers include individuals and money managers throughout the world. Moreover, his Newsletters are currently published on several financial sites, here and abroad.
More from Gold-Eagle


