Technical Analysis Of The Markets


Current Position of the Market
SPX Long-term trend: There is some evidence that we are still in the bull market which started in 2009 and which could continue into the first half of 2021 before major cycles take over and it comes to an end.
SPX Intermediate trend: SPX is starting on the next phase of its intermediate uptrend.
Analysis of the short-term trend is done daily with the help of hourly charts. They are important adjuncts to the analysis of daily and weekly charts which determine longer market trends.
Bullish Trend Continues
Cycles: Looking ahead!
90-yr cycle – Last lows: 1843-1933. Next low: ~2023
40-yr cycle -- Last lows: 1942 -1982. Next low: ~2022
7-yr cycle – Last lows: 2009-2016. Next low: ~2023
Market Analysis (Charts, courtesy of QCharts)
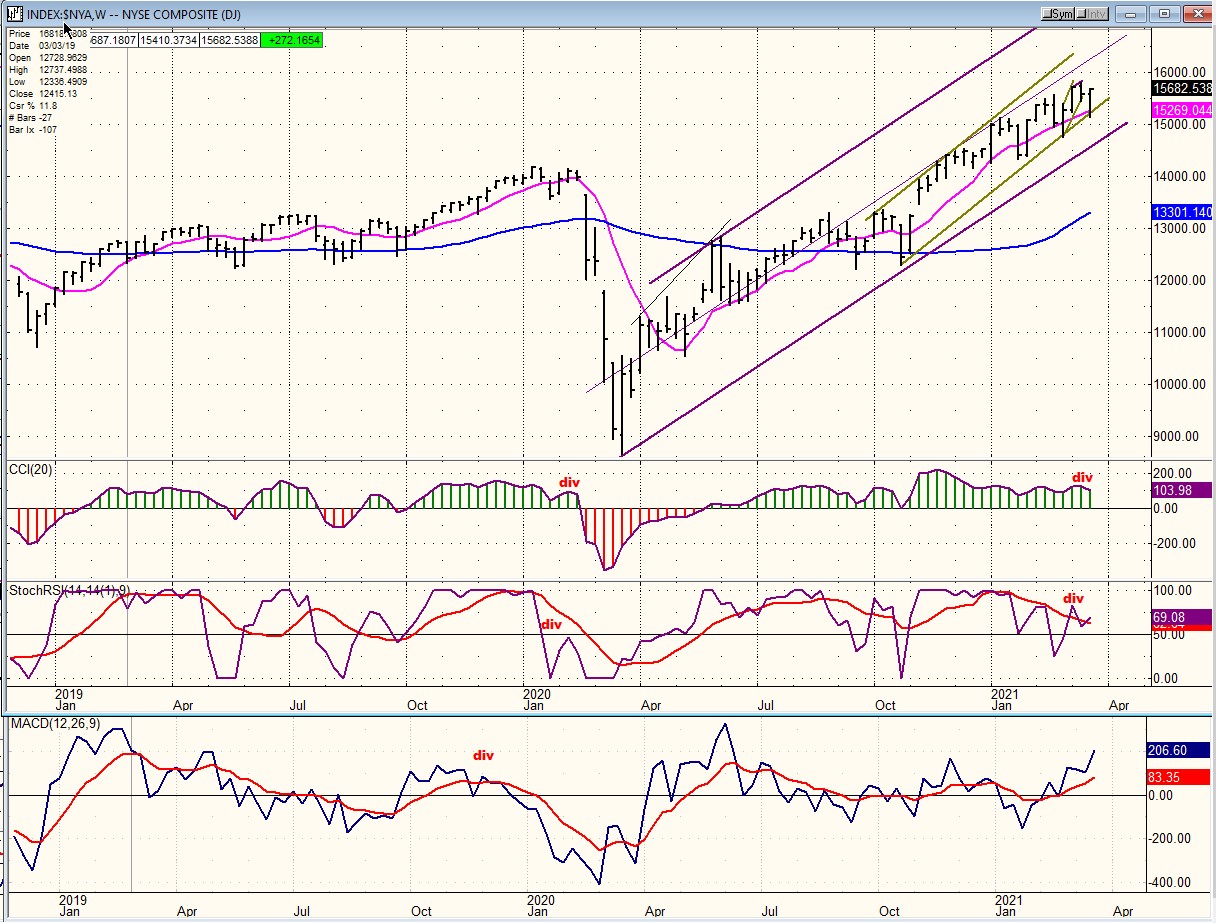
NYA (weekly)
The NYSE index is the broadest based index. That means that it is made up of more stocks than any other U.S. listed index! By tracking it, together with the SPX, which is a hybrid of the DJIA and NDX, we can arrive at a better perspective about the current state of the U.S. stock market.
In addition, because NYA is comprised of most listed stocks, by comparing market breadth (advancing issues vs. declining issues) to the price index we can augment that perspective. On the chart below, we can see that the MACD of the A-D was the first indicator to give us an early warning of the 2020 correction. And by using it in conjunction with the SRSI and CCI, as well as being aware of the index’s price relationship to its 50-wk MA, we can greatly improve market timing.
We are expecting major cycles (listed above) to make their lows over the next few months. They are expected to bring about a decline which could easily exceed the 40% retracement of the March 2020 decline, but spread over a much longer time-period. It therefore behooves us to keep an eye on these indicators to see if they are signaling that the stock market is in imminent danger of starting a major correction. As of now, they are not. So, we will revisit them in a few weeks when the market is closer to the high suggested by the SPX Point & Figure long-term chart.
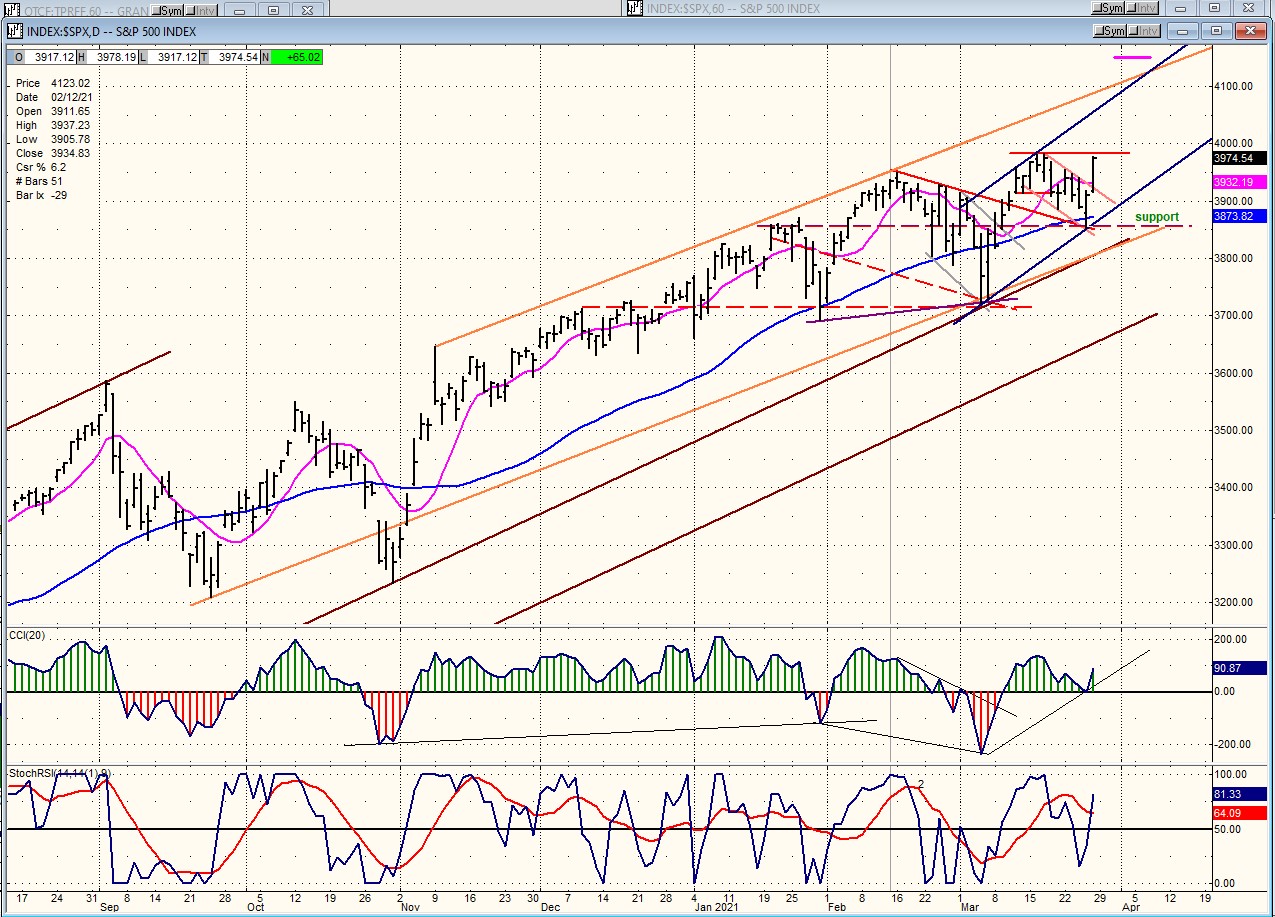
SPX daily chart
Based on the market action of the past two days, I suspect that we are now on our way to the next phase projection target of ~4100-4150 before consolidating.
After correcting down to the 3723 support, the index made a new high at 3980. Minor congestion at that level suggested a consolidation pullback to ~3855 before embarking on the next phase of the uptrend that started from 3723. This pullback was accomplished over a 10-day period, culminating with a retracement to 3853.50 last Thursday, and followed by an immediate reversal of over one hundred points by Friday’s close with the index closing near its high at 3974.
The recent high of 3981 should not be much of a challenge to overcome and, whether SPX pulls back slightly before moving higher or goes straight through, its next target should first be about 4150 and then about 4300. These projections are made based on the congestion established at the March 2020 base, and they are being confirmed by more recent SPX patterns.
Although the oscillators are currently lagging, it is not a sign of negative divergence and over the next couple of days they should move higher and confirm the new uptrend.
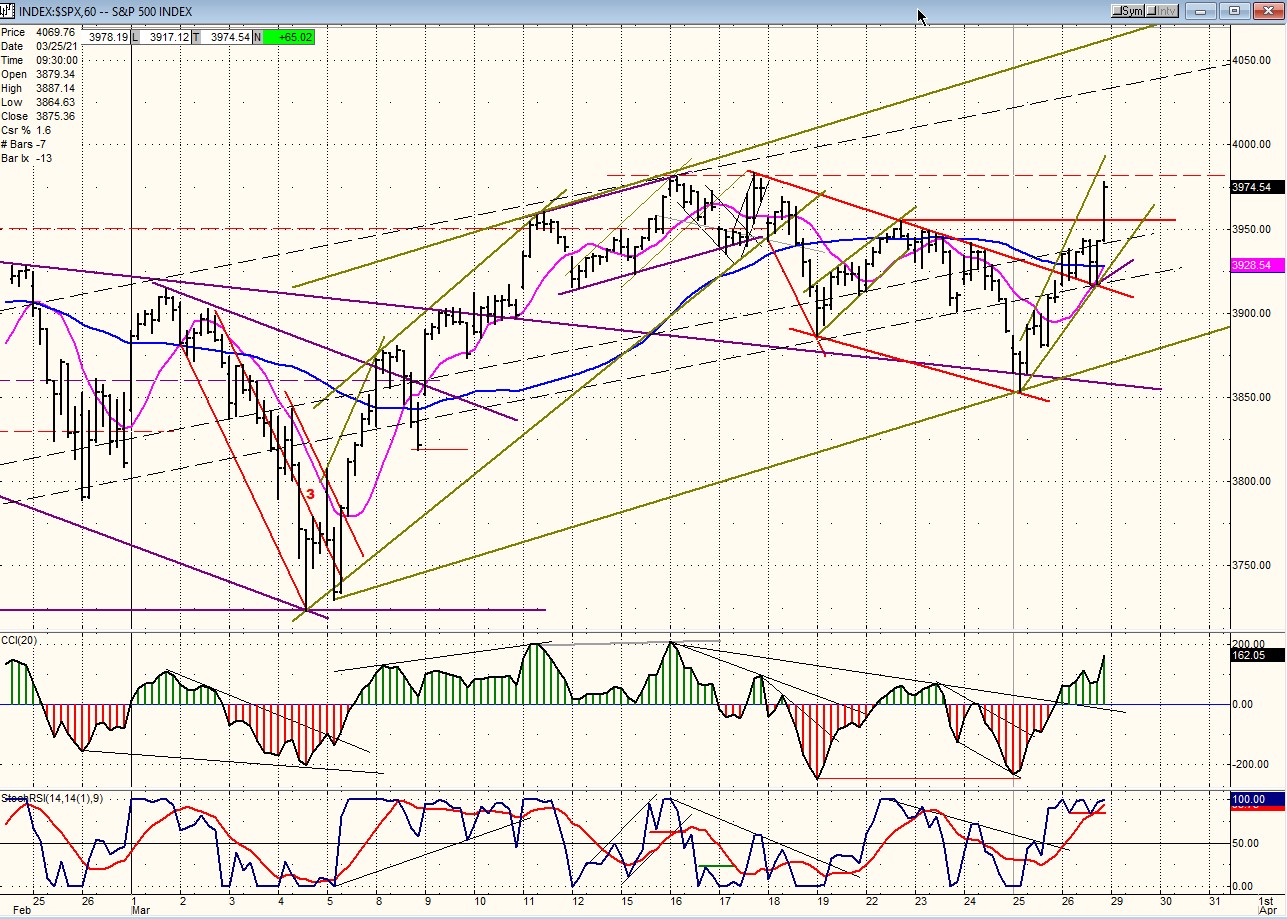
SPX hourly chart
The consolidation at the 3980 top created a small amount of congestion with a count down to 3855-60. The pullback lasted seven days and brought the index down to 3853 on Thursday, where it also found support on the previous declining channel line from 3950. From there, a rally started which quickly rose above the short-term downtrend line from 3980, briefly pulled back, and continued to close the day at 3974 on Friday, one hundred and twenty-one points from Thursday’s low and only five points from the previous high.
There could be a minor pullback on Monday, but the structure is suggesting that wave 3 of 3 may already be on its way; and for this reason, we could push to at least 4080-4150 before it comes to an end. Whether or not this is exactly how the structure develops, it is likely that SPX is in the process of forming a new upside (green) channel and could move close to the top channel line before consolidating.
Both oscillators are strong and overbought but they should start losing momentum as the index progresses higher, and it is not likely that a short-term sell signal will be given until 1) CCI shows some negative divergence, and 2) goes negative.
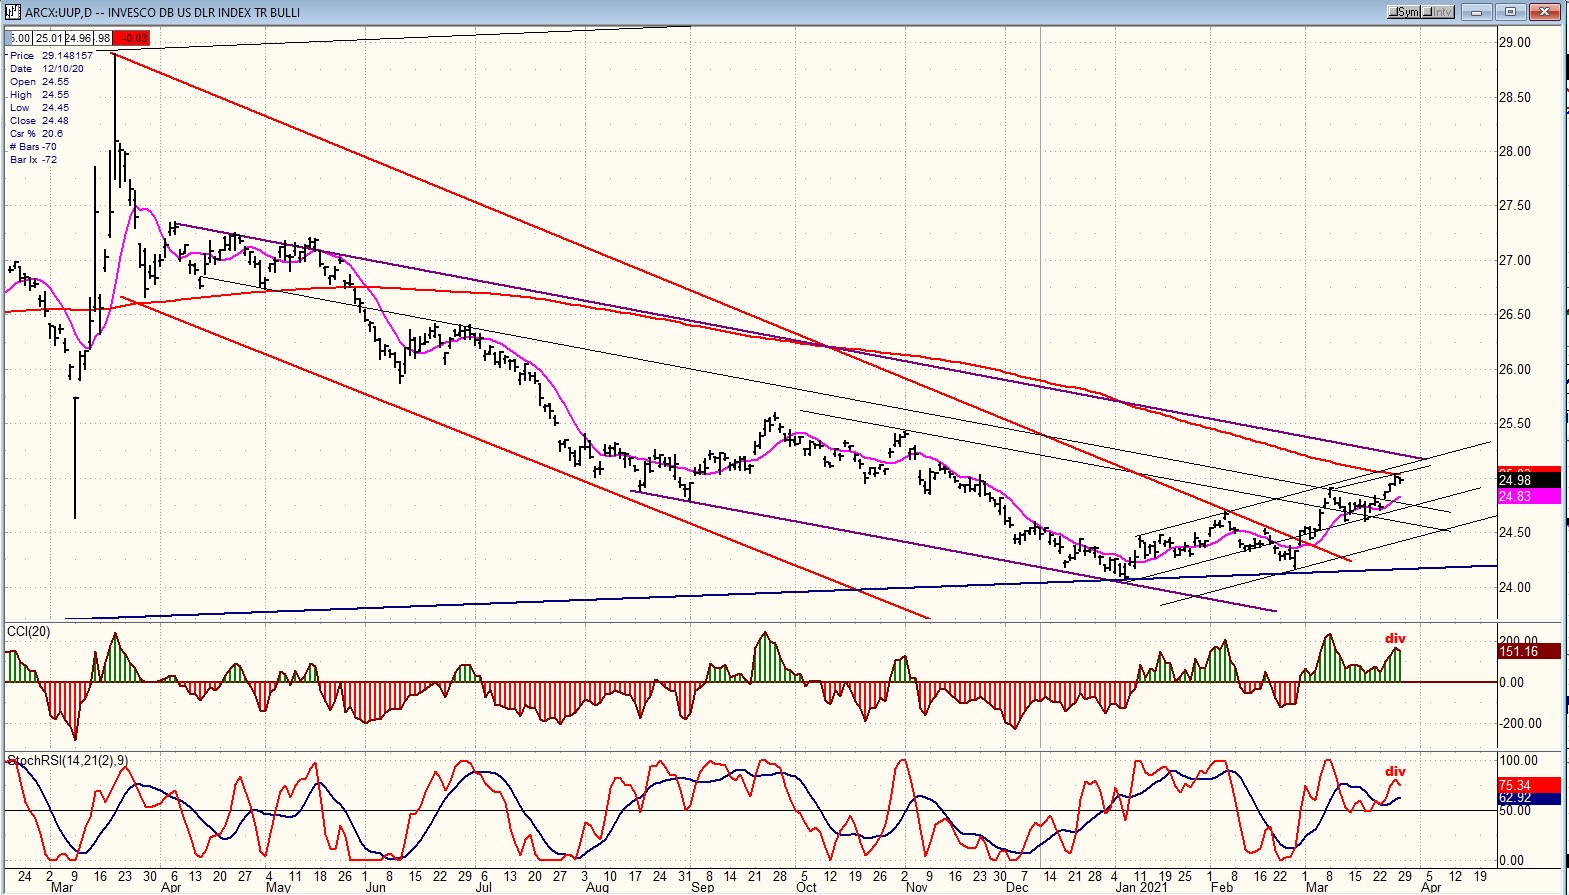
UUP (dollar ETF) DLY ($USD chart is not available from this data provider)
UUP may be close to completing its 3- month uptrend. Negative divergence has started to form in both daily oscillators and the index is running into resistance from its 200-dma. This is a slow-moving index, so it could be several days before a short/intermediate top is formed and a reversal takes place.
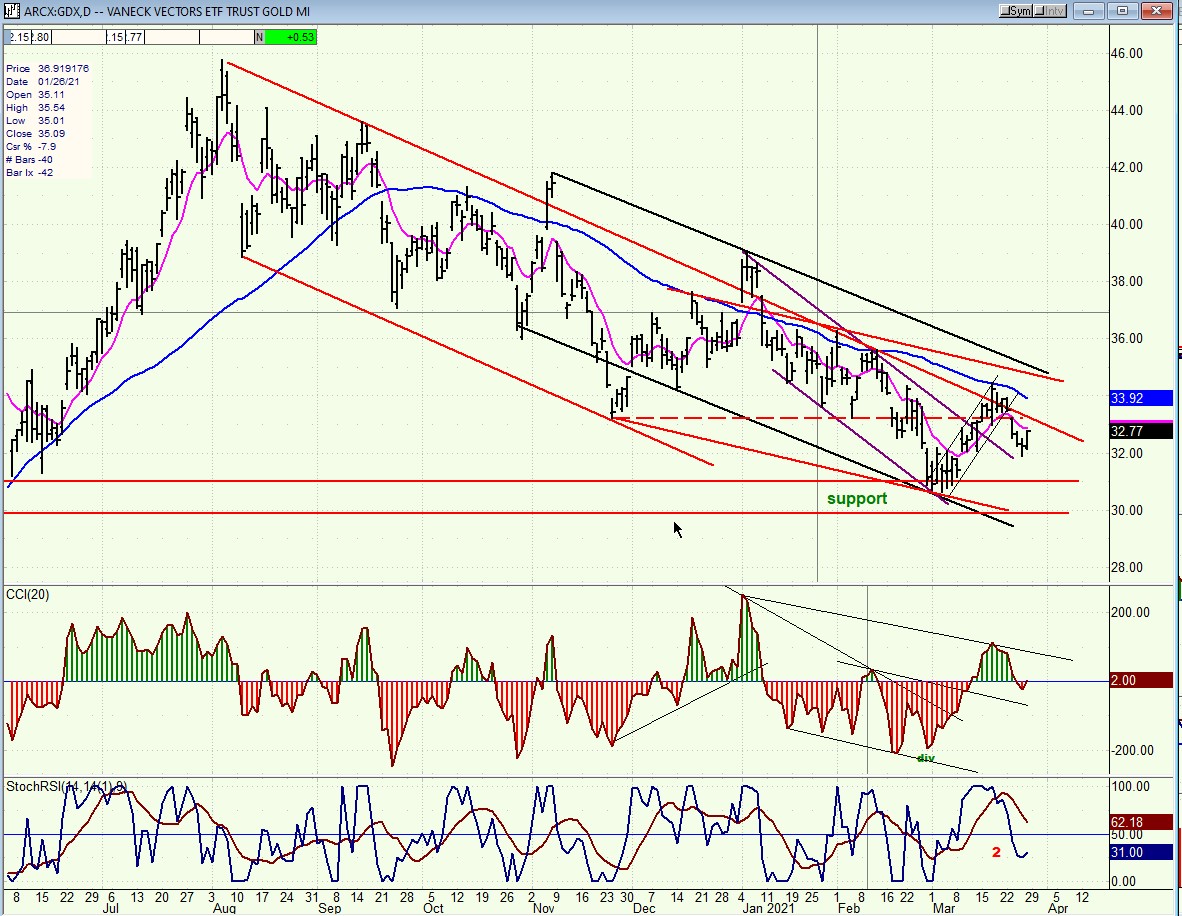
GDX (gold miners)-DLY
GDX made its big up-move during the time that the $USD was in a severe decline. Since then, the dollar’s downtrend has decelerated and reversed. The reversal is not expected to be a major turning point and the uptrend is already showing signs of having met its objective.
The same signs are occurring in GDX but in reverse. Consequently, it is likely that GDX has already completed its correction, may already have retested is low, and will soon be positioned to reverse course.
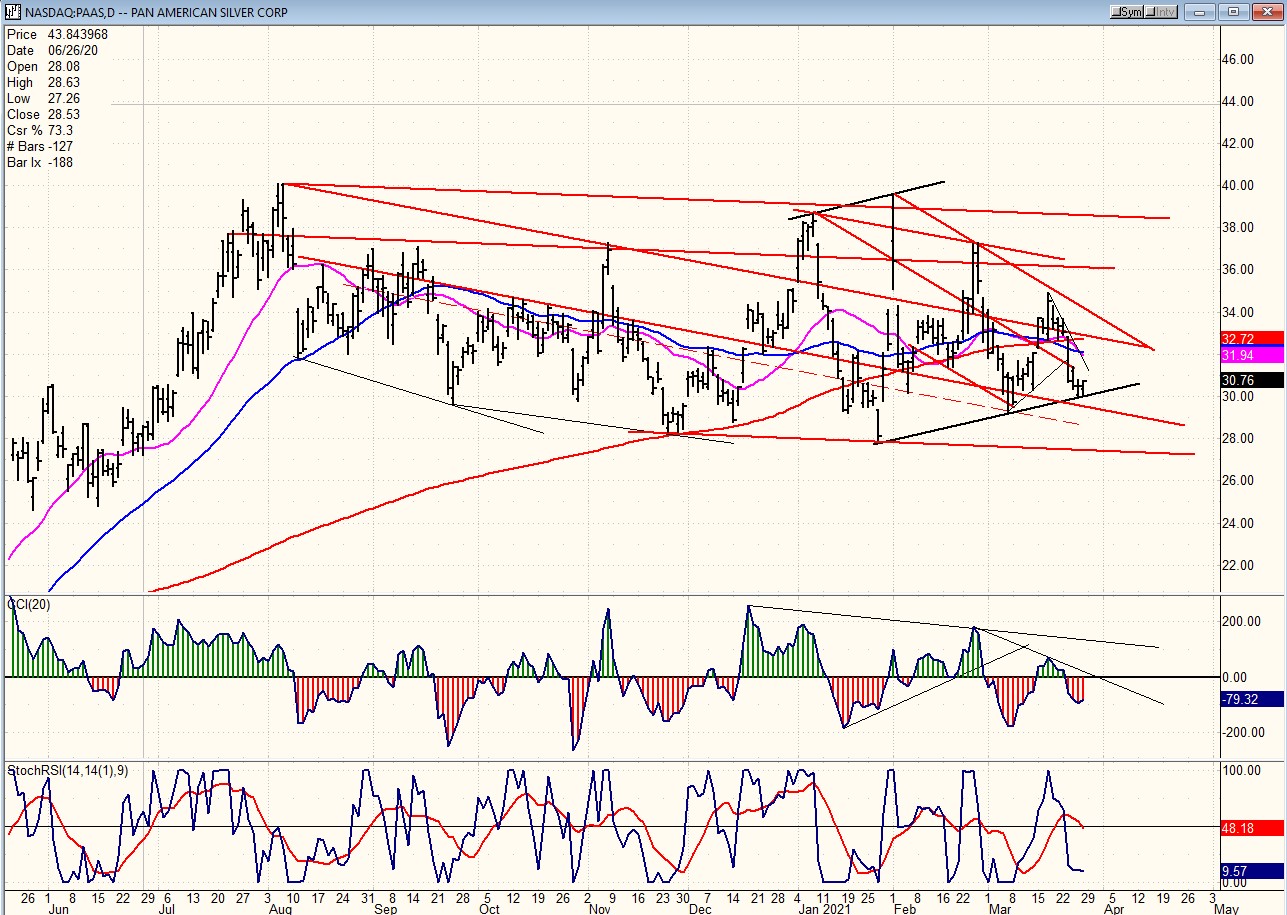
PAAS (Pan American Silver Corp-DLY)
What was said about GDX and gold also applies to PAAS and silver, with the only difference being that PAAS’s correction was milder and that it did not retrace as much ground.
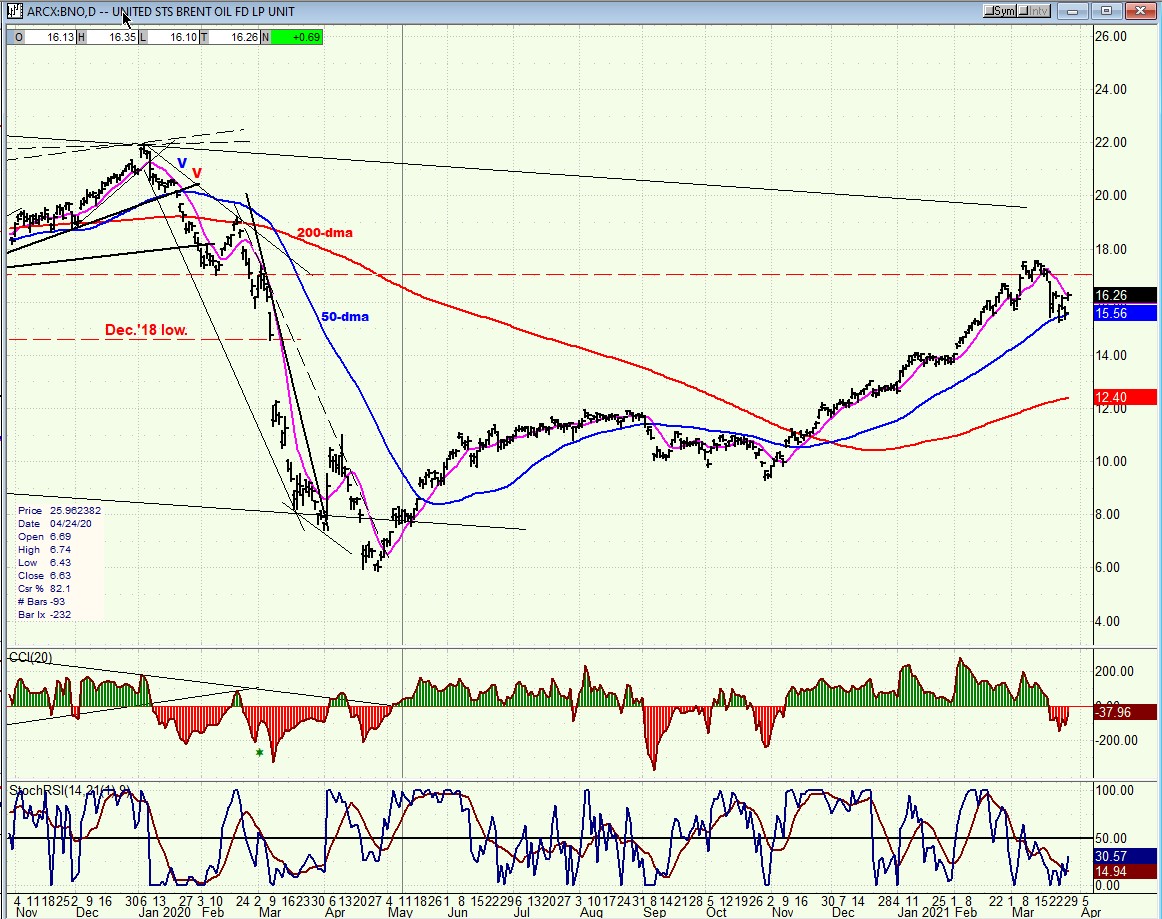
BNO (Brent oil fund) DLY.
BNO met a secondary projection and is correcting. It is now ready to move higher but could retest its high in conjunction with market strength.
SUMMARY
SPX started a new intermediate uptrend from 3723 with the first phase ending at 3980. After a pullback to 3953 last Thursday, the index started the second phase which is aiming for ~4150. After another brief consolidation, a third phase should continue higher to about 4300-4350. After we reach that level, we should start looking for a possible top to the advance from 2009.
Free trial subscription
With a trial subscription, you will have access to the same information that is given to paid subscribers, but for a limited time-period. Over the years, I have developed an expertise in P&F charting (price projection), cycles (timing), EWT (structure), and general technical analysis which enables me to warn subscribers of pending reversals in market trends and how far that trend can potentially carry. For a FREE 2-week trial, subscription options and payment plans, I encourage you to visit my website at www.marketurningpoints.com.
The above comments and those made in the daily updates and the Market Summary about the financial markets are based purely on what I consider to be sound technical analysis principles. They represent my own opinion and are not meant to be construed as trading or investment advice but are offered as an analytical point of view which might be of interest to those who follow stock market cycles and technical analysis.
********

When Andre Gratian was a stock broker years ago, a friend introduced him to technical analysis of the market. Consequently, it is not an exaggeration to say that Andre fell in love with this approach! Ever since then, it has become an increasingly important part of his professional life. Gratian has studied the works of Wyckoff, Edwards & Magee, Edward J. Dewey (cycles) and many others. However, one of my most profitable undertaking has probably been to study Point & Figure charting, which he finds invaluable in analyzing stocks and indices. If he were restricted to one methodology, this is the one that he would choose. This well-rounded background has given him what he feels to be a special insight into the stock market, facilitating the recognition of meaningful patterns and the ‘turning points’ in all trends, whether they be short or long term. Andre feels very comfortable discussing the stock market and passing on meaningful information to others. His subscribers include individuals and money managers throughout the world. Moreover, his Newsletters are currently published on several financial sites, here and abroad.


