Technical Analysis Of The Markets


Current Position of the Market
SPX Long-term trend: There is some evidence that we are still in the bull market which started in 2009 and which could continue into the first half of 2021 before major cycles take over, and it ends. A move past 4500 is possible before the current bull market makes a final top and SPX corrects into its next major cycle low due in 2023.
SPX Intermediate trend: Phase three (wave 5 rom 3723) is now likely underway.
Analysis of the short-term trend is done daily with the help of hourly charts. They are important adjuncts to the analysis of daily and weekly charts which determine longer market trends.
A New Uptrend Starting?
Cycles: Looking ahead!
7-yr cycle – Last lows: 2009-2016. Next low: ~2023
Market Analysis (Charts, courtesy of QCharts)
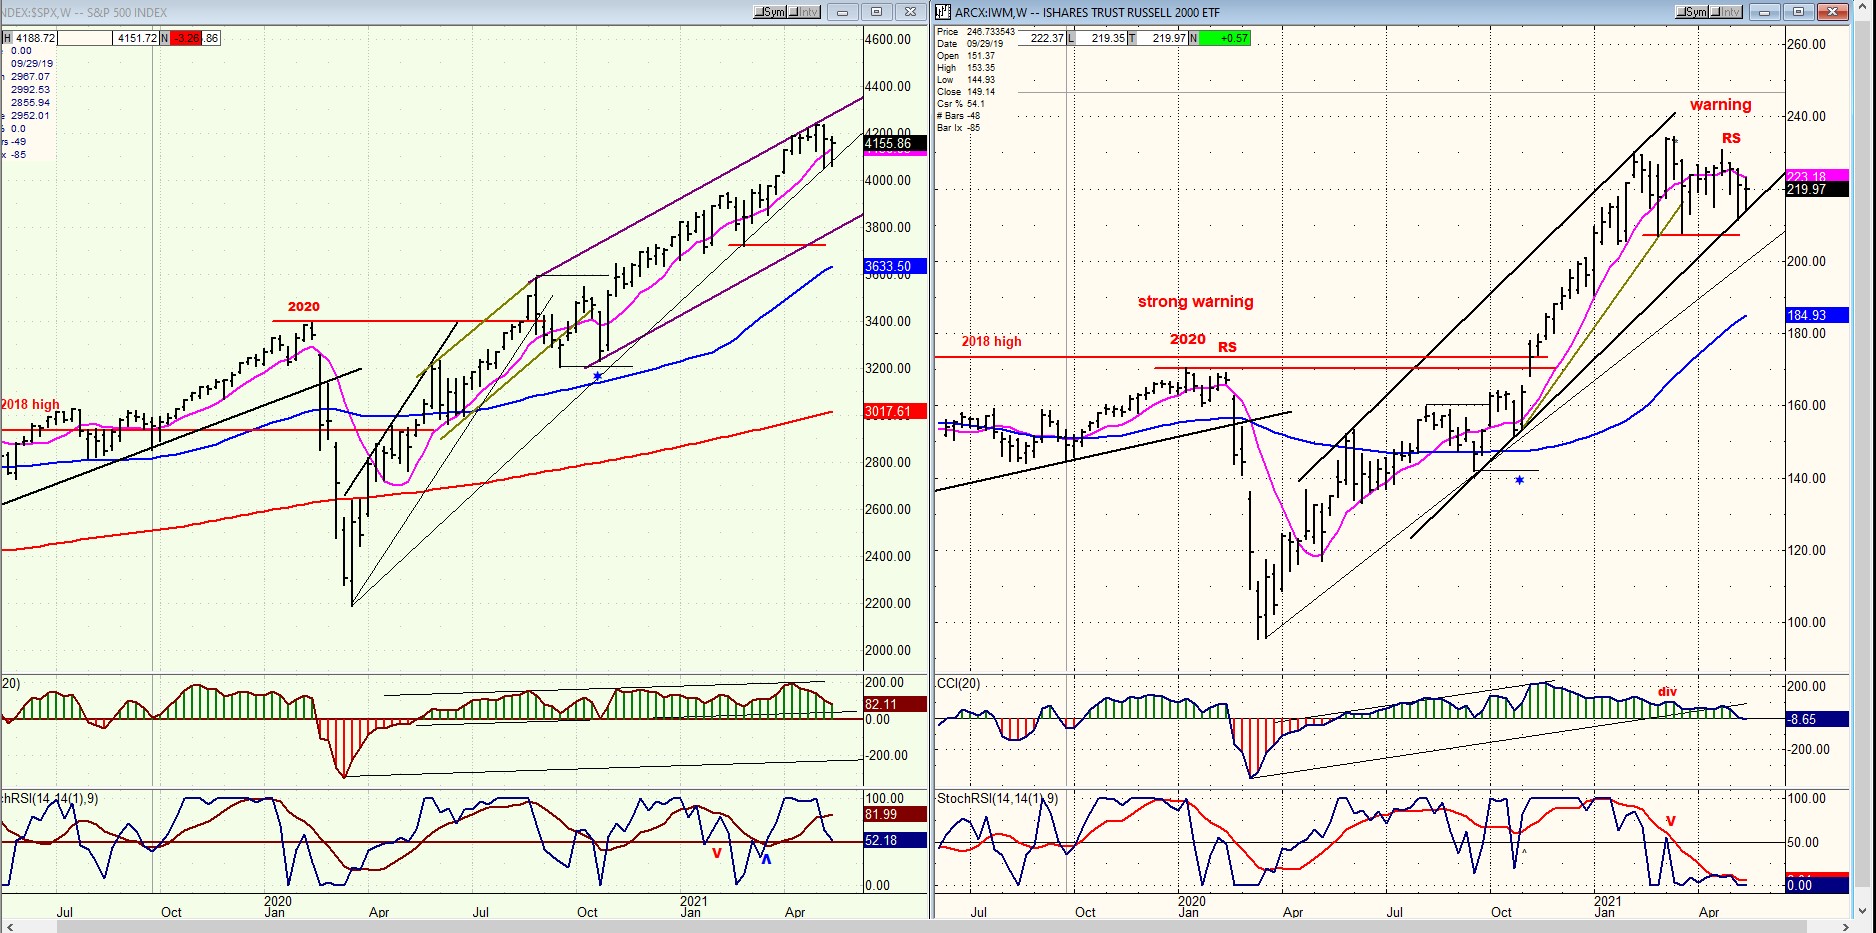
IWM - SPX (weekly)
IWM continues to diverge significantly from SPX over the intermediate term. Based on previous similar divergences, one should be prepared for an important correction to take place in SPX, but perhaps not before the latter makes a new high to complete its current structure.
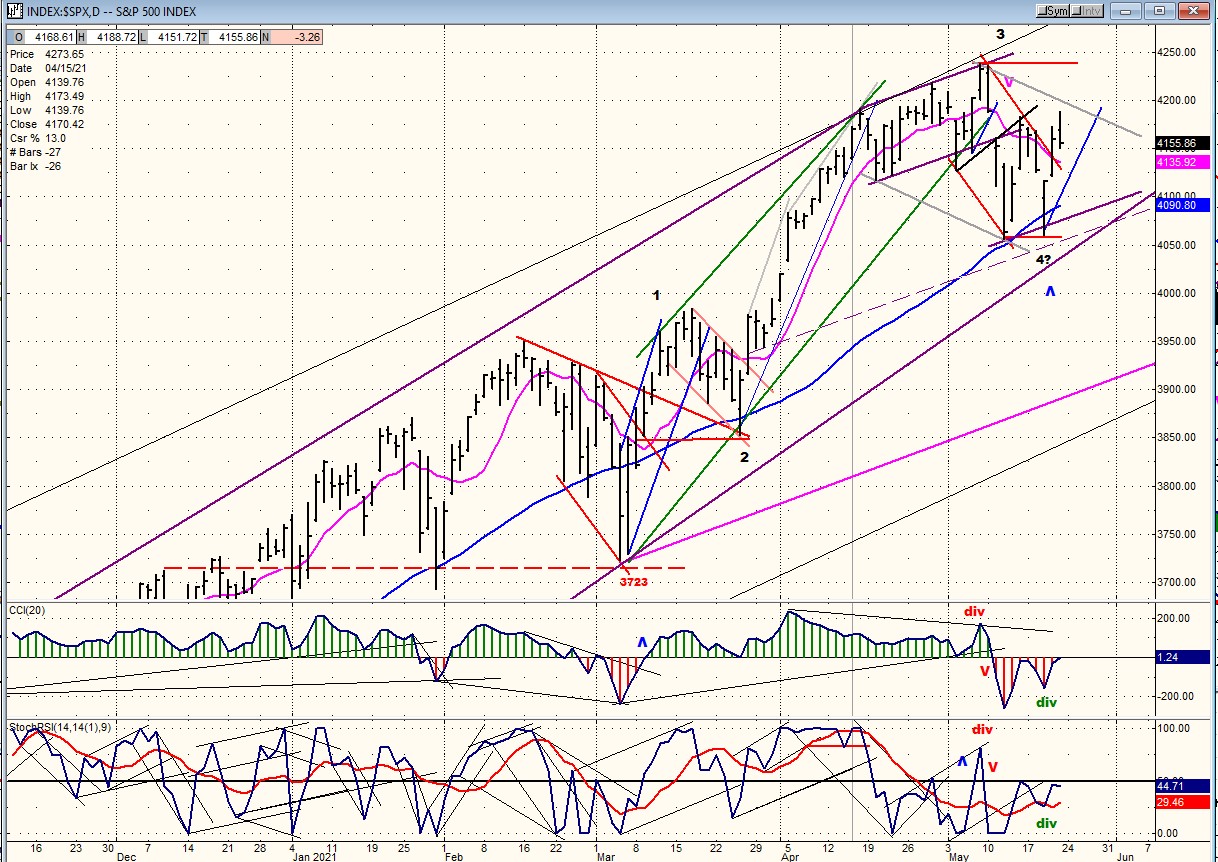
SPX daily chart
Last week’s letter warned that a minor cycle low was due on the 5/17-18 - time frame. In fact, the cycle made its low on 5/19, bringing about a retest of the former short-term bottom. From a structural standpoint, now that this has taken place, it is likely that wave 4 of the move which started from 3723 is complete and that wave 5 has started. Friday’s index action appears to have completed the first leg of a new uptrend which should lead it to a new all-time high before long.
The long-term P&F base established at the March 2020 low consists of multiple phases, each of which corresponding to a specific count which determines the consecutive price levels to be achieved by SPX during its uptrend, and from which it should correct before moving to the next indicated level. This is a peculiarity which does not appear on a bar chart but can only be observed on a P&F chart. The last phase gave us a count to 3950 which was attained precisely on 2/16/2021 and followed by a three-week correction of 227 points down to 3723 before a new uptrend started.
The next phase, which is currently underway gives us a count to ~4310. Long-term base counts which are provided by a 3X10 chart can be fine-tuned and re-confirmed by the 1X10 chart pattern which defines the most recent re-accumulation phase – in this case, with a count taken across the 4100 level. This short-term count calls for a move to ~4350, which in fact pretty well verifies and confirms the base phase count taken in 03/2020. This price projection would seem to be in tune with the structural pattern which calls for one more short-term move higher (wave 5), to complete the structure from 3723, from which the last phase uptrend got underway.
As always, there is a caveat that the analysis could go awry, and this would become evident if SPX should fail to make a new high over the next week or so.
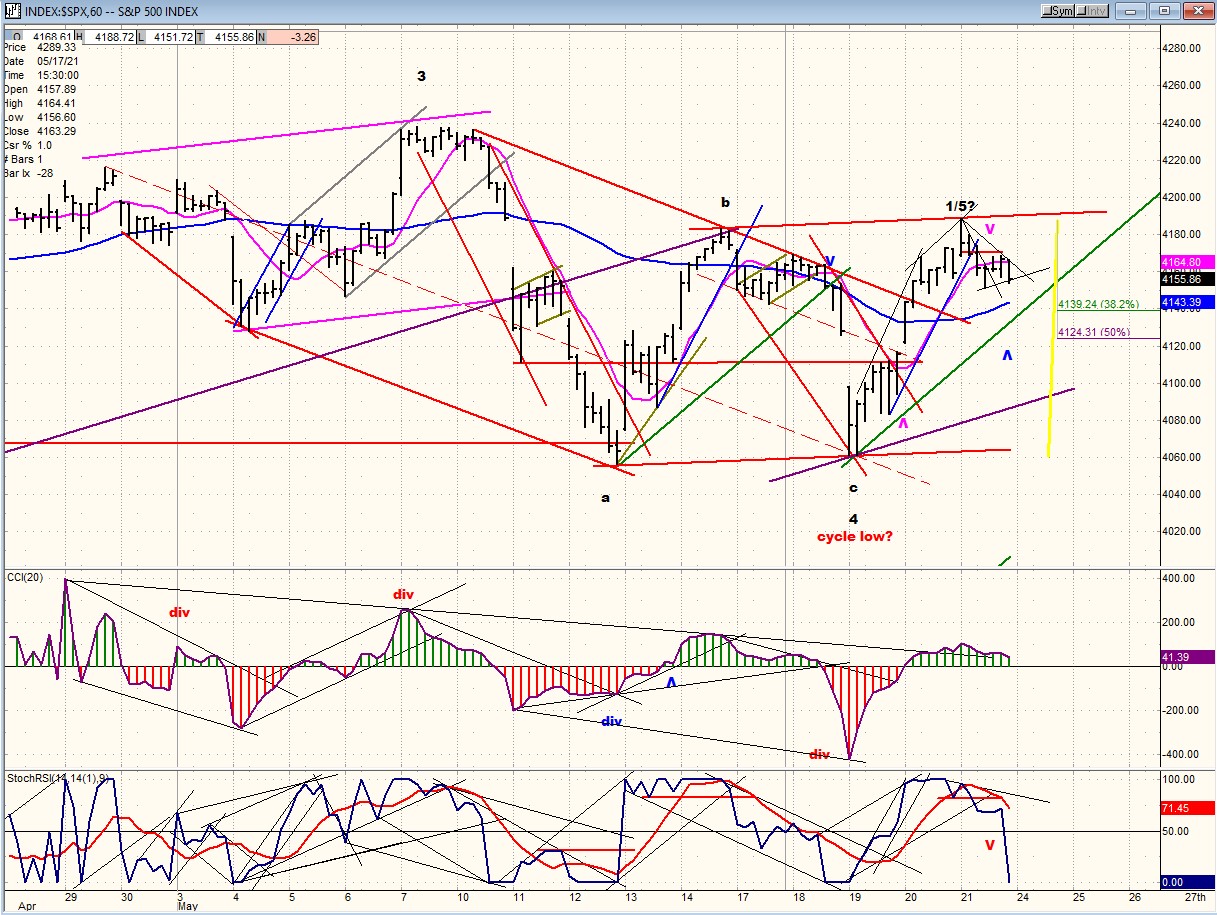
SPX hourly chart
On the hourly chart we can follow the short-term progress of the index. After ostensibly making a wave 3 high at 4238 on 5/07, and a wave 4 double-bottom prompted by the bottoming of the short-term cycle last Tuesday, SPX now appears to have started wave 5 which made a high at Friday’s opening (1/5?) and started a near-term correction which does not appear quite complete, and which could retrace .382 of the first wave to 4139 before it is ready to resume its uptrend. Since it would also find support from the 50-hr MA at that level, it would appear the more logical target, but we cannot exclude a full 50% retracement to 4124 since this is more frequent.
A continuation of the price declining beyond 50% would be suspicious and could lead to a revision of the current analysis.
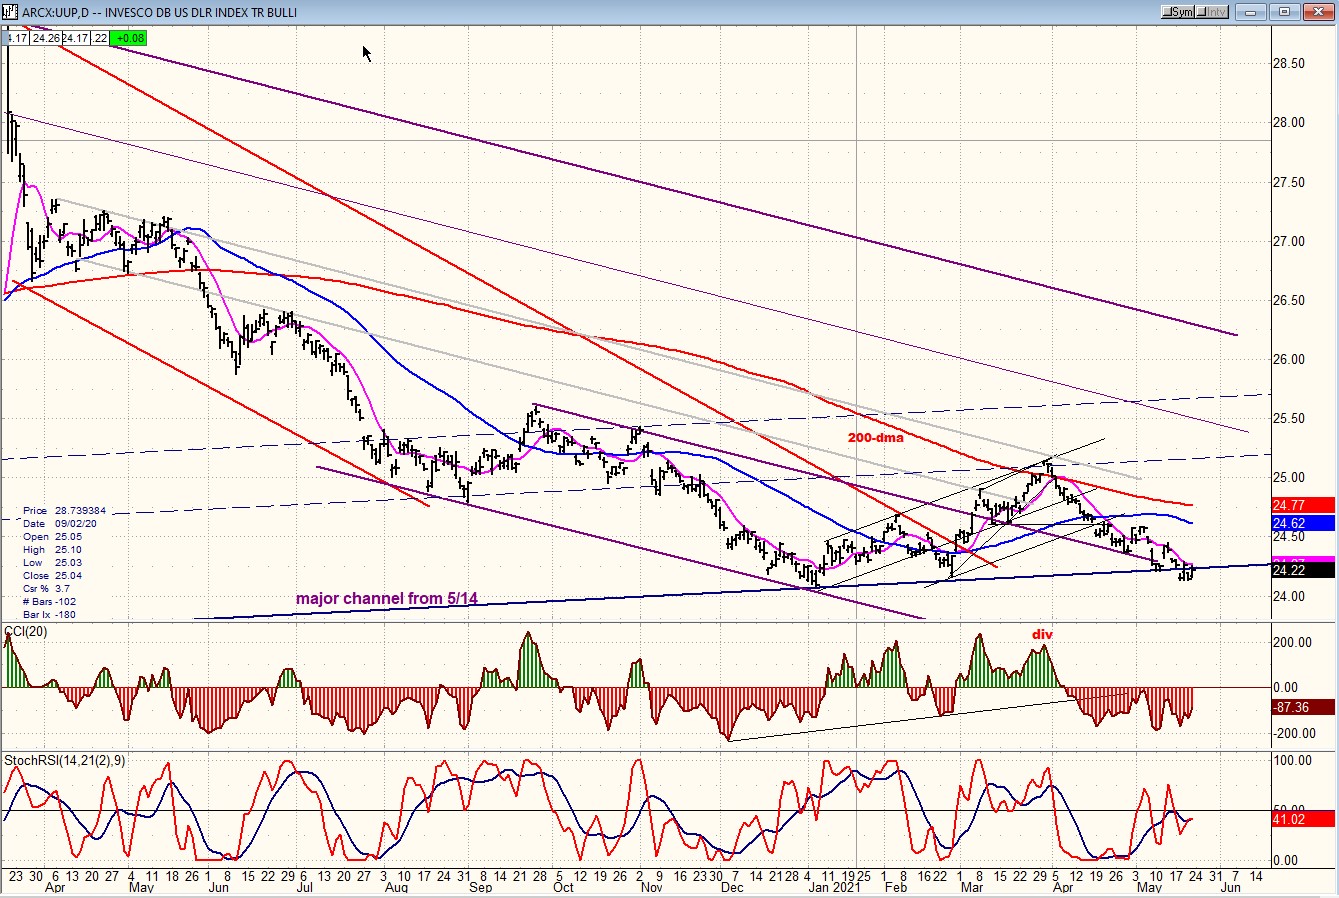
UUP (dollar ETF) DLY ($USD chart is not available from this data provider)
UUP again made a new low last week, but that low was made last Monday, and the index held that low for the rest of the week which gave the oscillators the opportunity to develop positive divergence, which is more apparent in the SRSI. This could mean that it is ready for at least a short-term reversal. At the same time, $USD appears to be at or near a (temporary?) downside projection on its P&F chart.
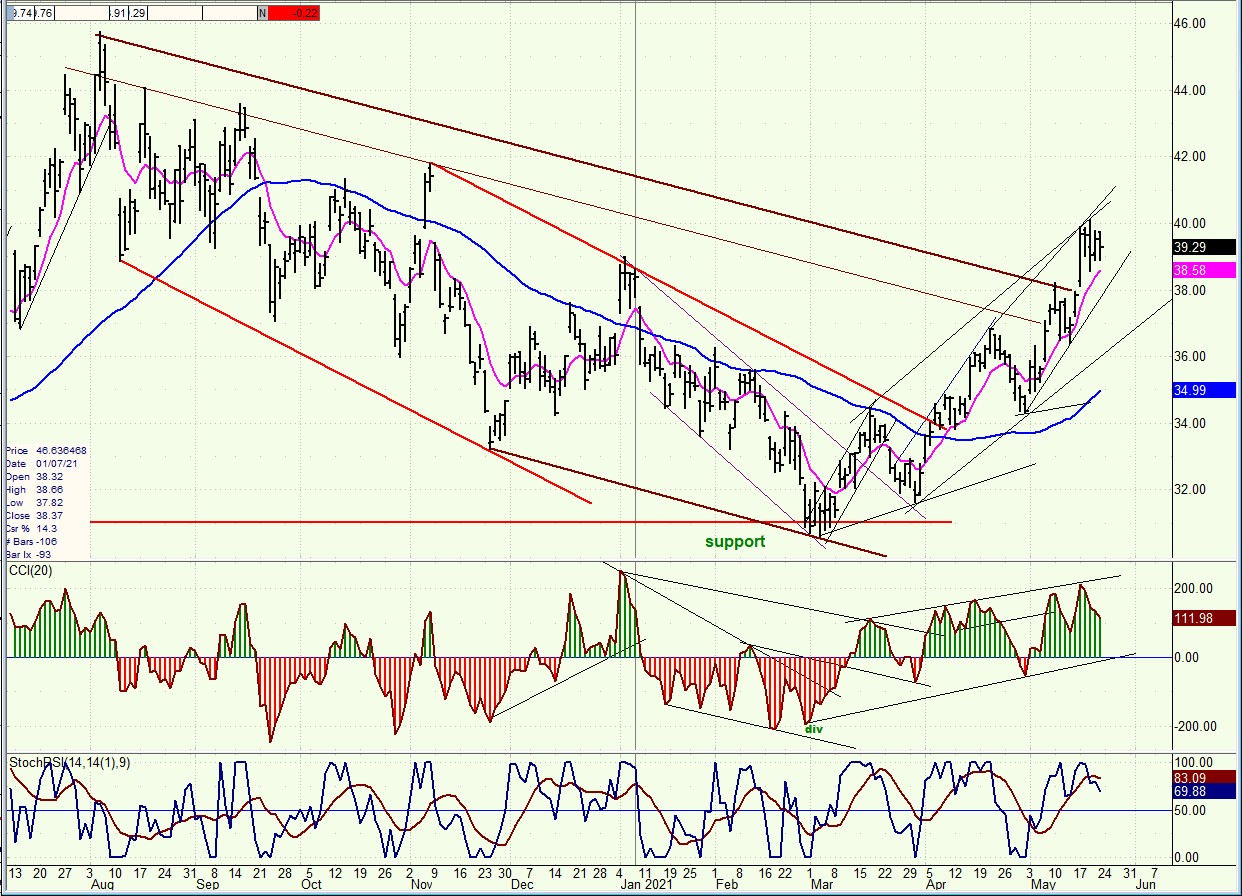
GDX (gold miners)-DLY
GDX has broken out of its correction channel. At the same time, it may have filled a near-term objective on its P&F chart which could require a little consolidation before it moves higher. The daily CCI does not show negative divergence but this does not seem to be always required in this index for a top to be formed at the daily level, whereby it appears to be much more consistent at the weekly time frame. The MAs appear to be much better indicators of a trend reversal. In this case we should watch for a decline below 38.58 as a sign that a short-term top has been established. However, by having moved well past its 50-dma, the index has clearly given an intermediate buy signal.
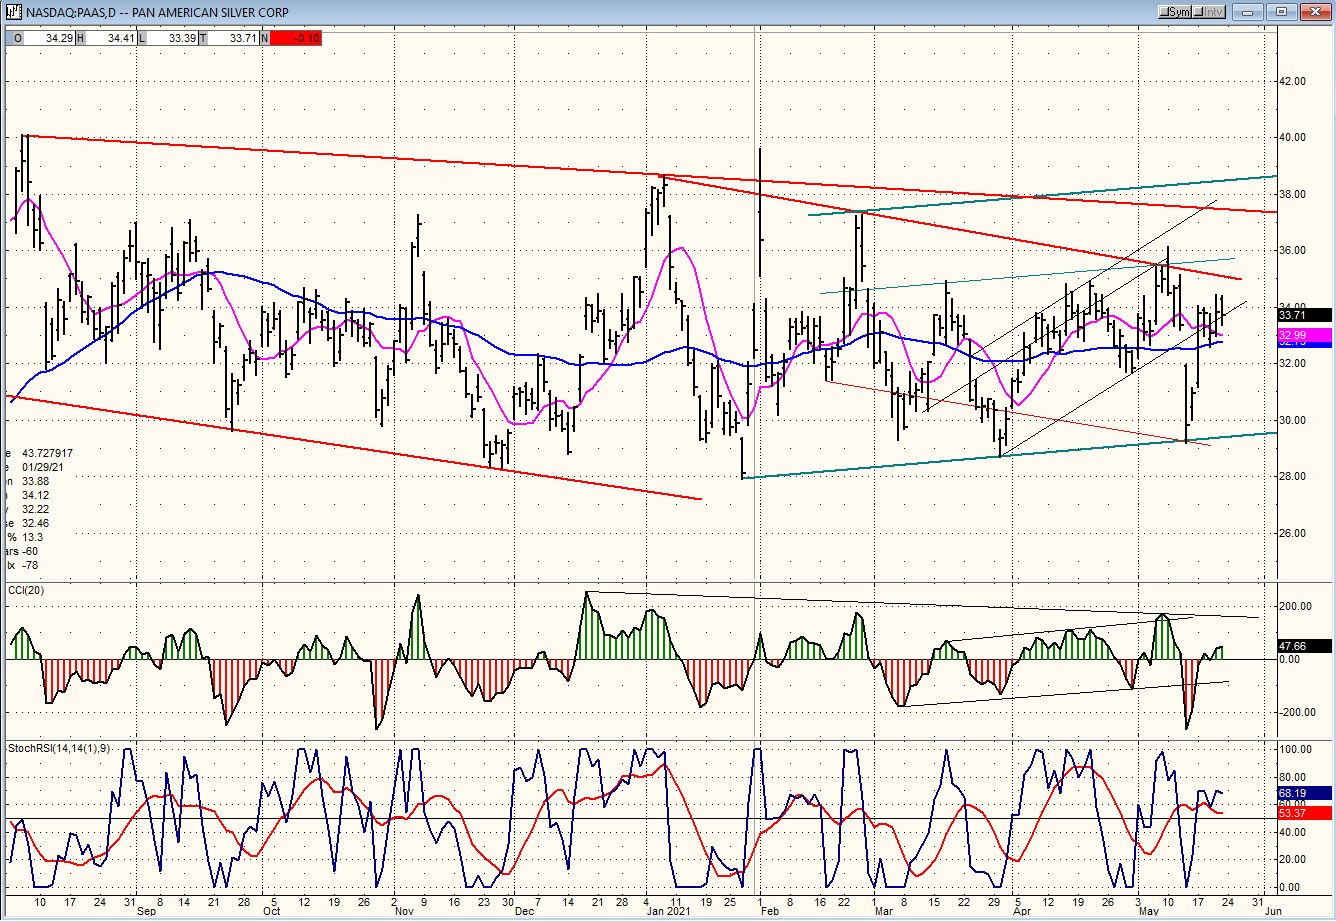
PAAS (Pan American Silver Corp-DLY)
PAAS pulled back to its lower channel line after it reported disappointing earnings for its last quarter. This was viewed as an opportunity by traders who were aggressive buyers. In the case of PAAS, both oscillators do show some negative divergence which could lead to additional consolidation. The stock has been trading in a 9/10-point range for several months and should experience a good uptrend if it can get past the former top of 38.
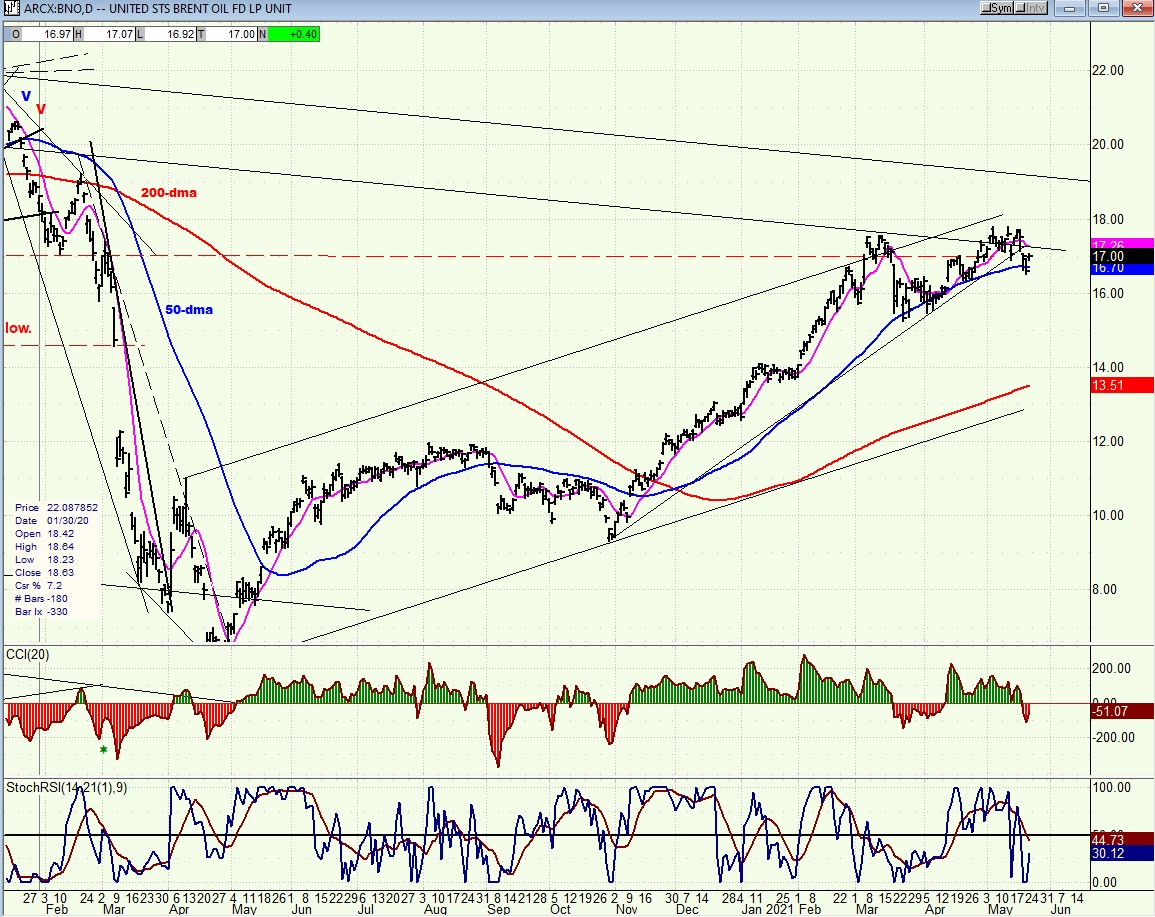
BNO (Brent oil fund) DLY.
Last week I suggested that, due to the negative divergence manifest in the CCI, BNO looked ready for a pullback. This took place last week. Now, the index must remain above its 50-dma or it will be retesting its former short-term low before long.
SUMMARY
SPX appears to have completed a 4th wave correction from 3723…and to have started on its 5th and final move of this uptrend. After a little more consolidation, it should be ready to make a new high.
Free trial subscription
With a trial subscription, you will have access to the same information that is given to paid subscribers, but for a limited time-period. Over the years, I have developed an expertise in P&F charting (price projection), cycles (timing), EWT (structure), and general technical analysis which enables me to warn subscribers of pending reversals in market trends, and how far that trend can potentially carry. For a FREE 2-week trial, subscription options, and payment plans I encourage you to visit my website at www.marketurningpoints.com.
The above comments and those made in the daily updates and the Market Summary about the financial markets are based purely on what I consider to be sound technical analysis principles. They represent my own opinion and are not meant to be construed as trading or investment advice but are offered as an analytical point of view which might be of interest to those who follow stock market cycles and technical analysis.
*********

When Andre Gratian was a stock broker years ago, a friend introduced him to technical analysis of the market. Consequently, it is not an exaggeration to say that Andre fell in love with this approach! Ever since then, it has become an increasingly important part of his professional life. Gratian has studied the works of Wyckoff, Edwards & Magee, Edward J. Dewey (cycles) and many others. However, one of my most profitable undertaking has probably been to study Point & Figure charting, which he finds invaluable in analyzing stocks and indices. If he were restricted to one methodology, this is the one that he would choose. This well-rounded background has given him what he feels to be a special insight into the stock market, facilitating the recognition of meaningful patterns and the ‘turning points’ in all trends, whether they be short or long term. Andre feels very comfortable discussing the stock market and passing on meaningful information to others. His subscribers include individuals and money managers throughout the world. Moreover, his Newsletters are currently published on several financial sites, here and abroad.


