Technical Analysis Of The Markets


Current Position of the Market
SPX Long-term trend: There is some evidence that we are still in the bull market which started in 2009 and which could continue into the first half of 2021 before major cycles take over, and it ends. A move up to ~4500 is possible before the current bull market makes a final top and SPX corrects into its next major cycle low due in 2023.
SPX Intermediate trend: Phase three (wave 5 from 3723) is now likely underway.
Analysis of the short-term trend is done daily with the help of hourly charts. They are important adjuncts to the analysis of daily and weekly charts which determine longer market trends.
Consolidation Ahead
Cycles: Looking ahead!
7-yr cycle – Last lows: 2009-2016. Next low: ~2023
Market Analysis (Charts, courtesy of QCharts)
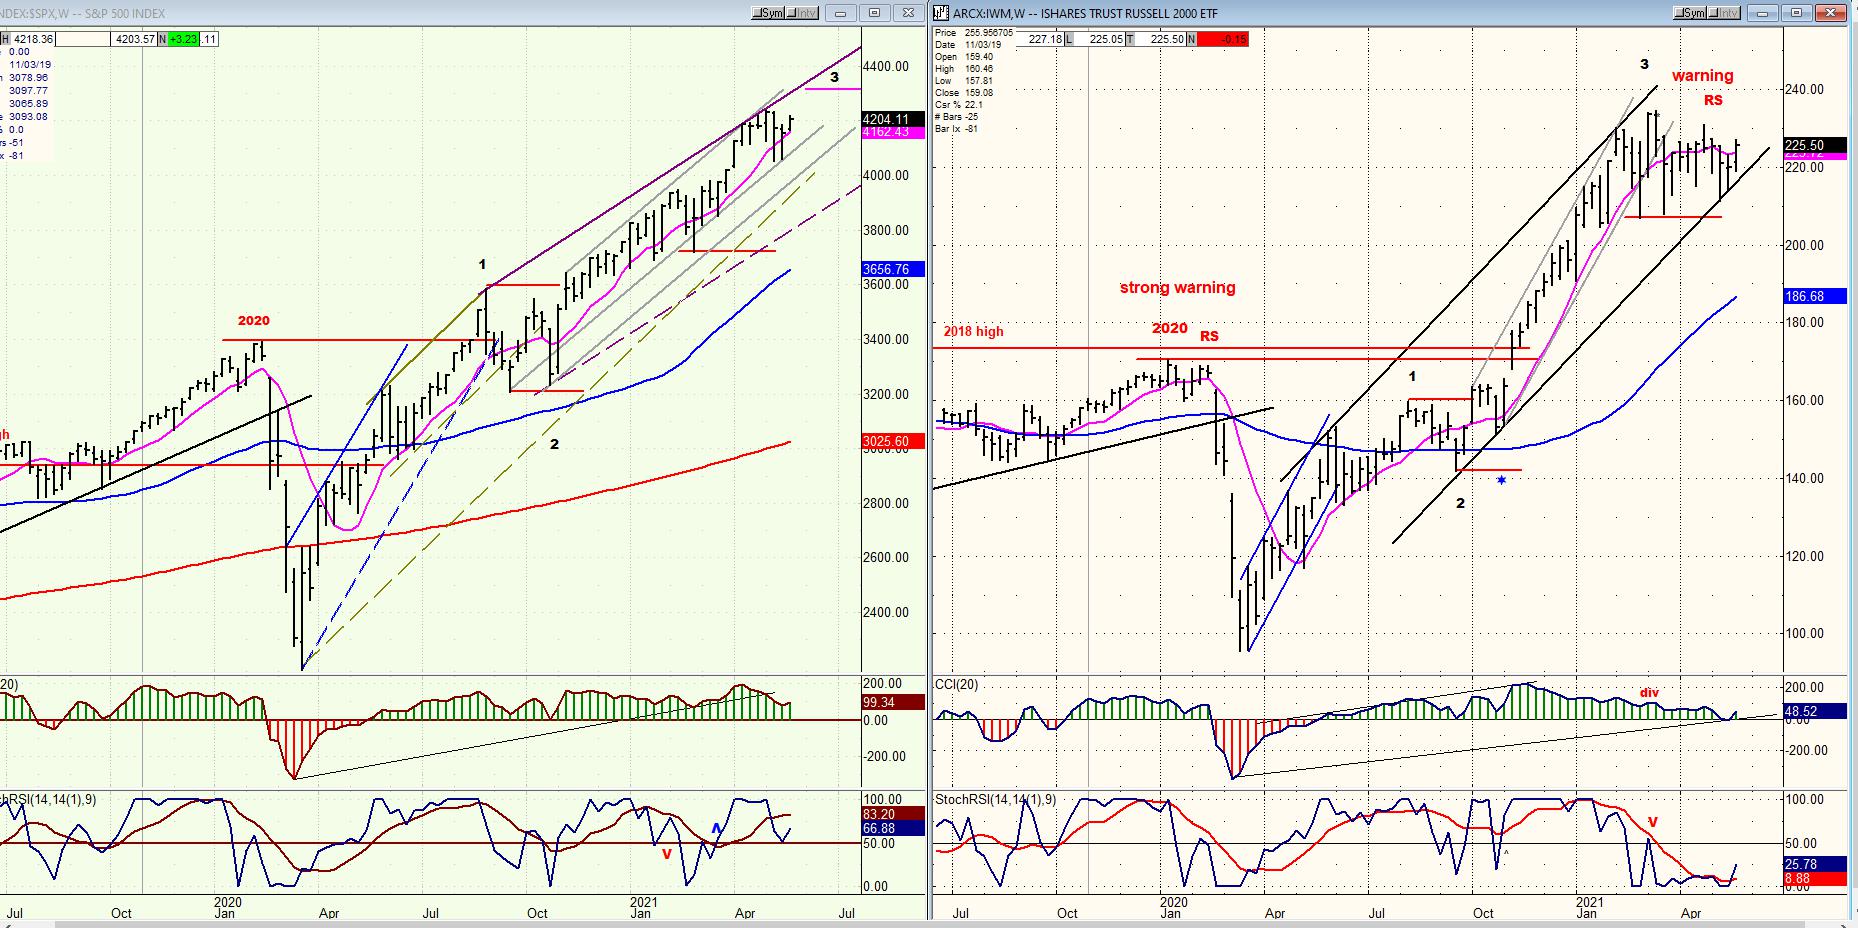
IWM - SPX (weekly)
Structurally, IWM appears to run a little ahead of SPX. Starting from the March low, IWM has already completed three waves up, while SPX is still in the final stages of doing so. This is the reason for the “early warning” which is regularly given by IWM. It is therefore likely that IWM will remain in a warning mode until SPX has completed wave 3, which may still be a couple of weeks away
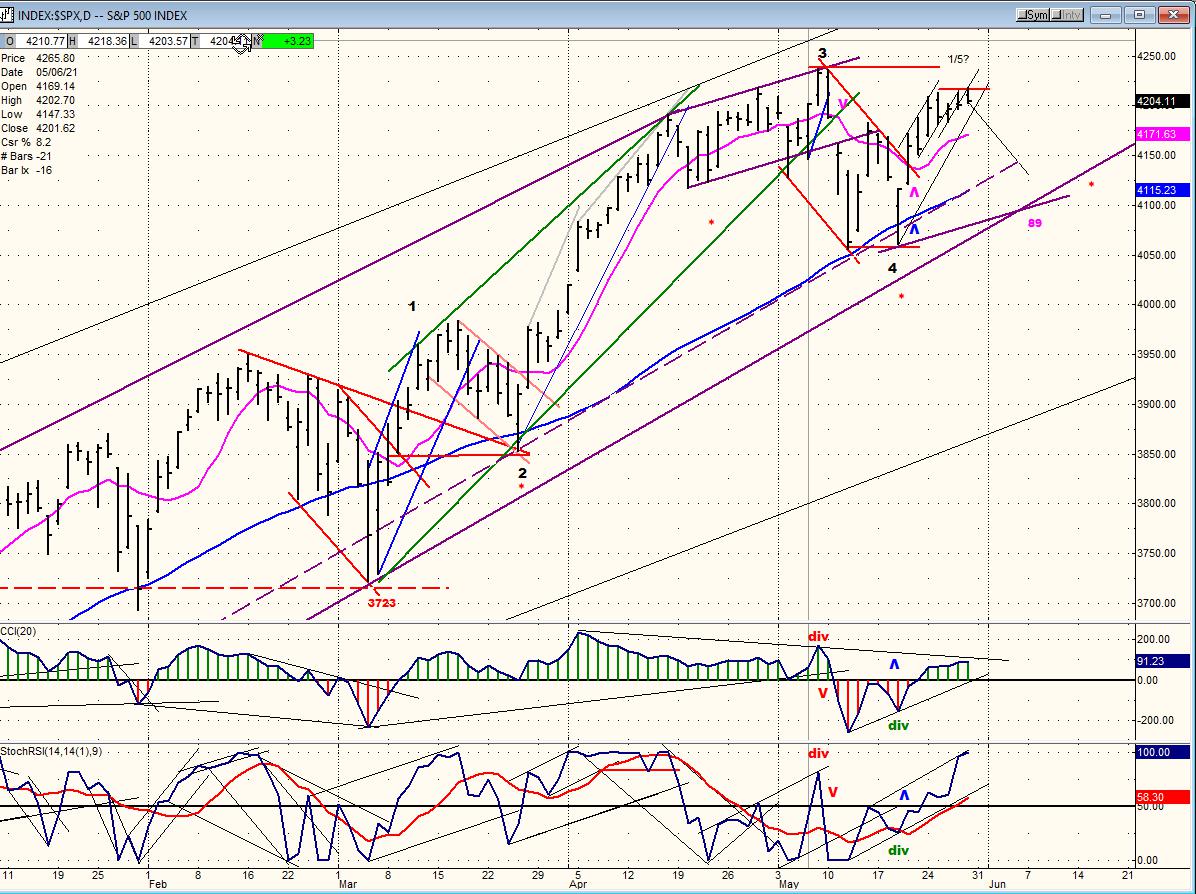
SPX daily chart
At the daily level, SPX is showing the deceleration pattern which precedes a minor top. During the past two days, the index crawled to a fractional new high, but each day failed to retain its daily gain and pulled back at the end of the day. This is better illustrated on the hourly chart which we will analyze next.
This deceleration is caused by the imminent bottoming of an ~18-wk cycle expected to make its low next week. The index appears to have reached the end of 1 of 5, and the cycle would ideally bring about wave 2 of 5 since the amount of distribution established last week is not very substantial and the minor correction may not exceed the 4130 level.
With the rally from the 4061 low, the oscillators have fully recovered from their negative readings and are strongly positive. They are expected to remain positive while wave 5 from 3723 continues to unfold, and will warn us that it is about to end when negative divergence appears in the CCI.
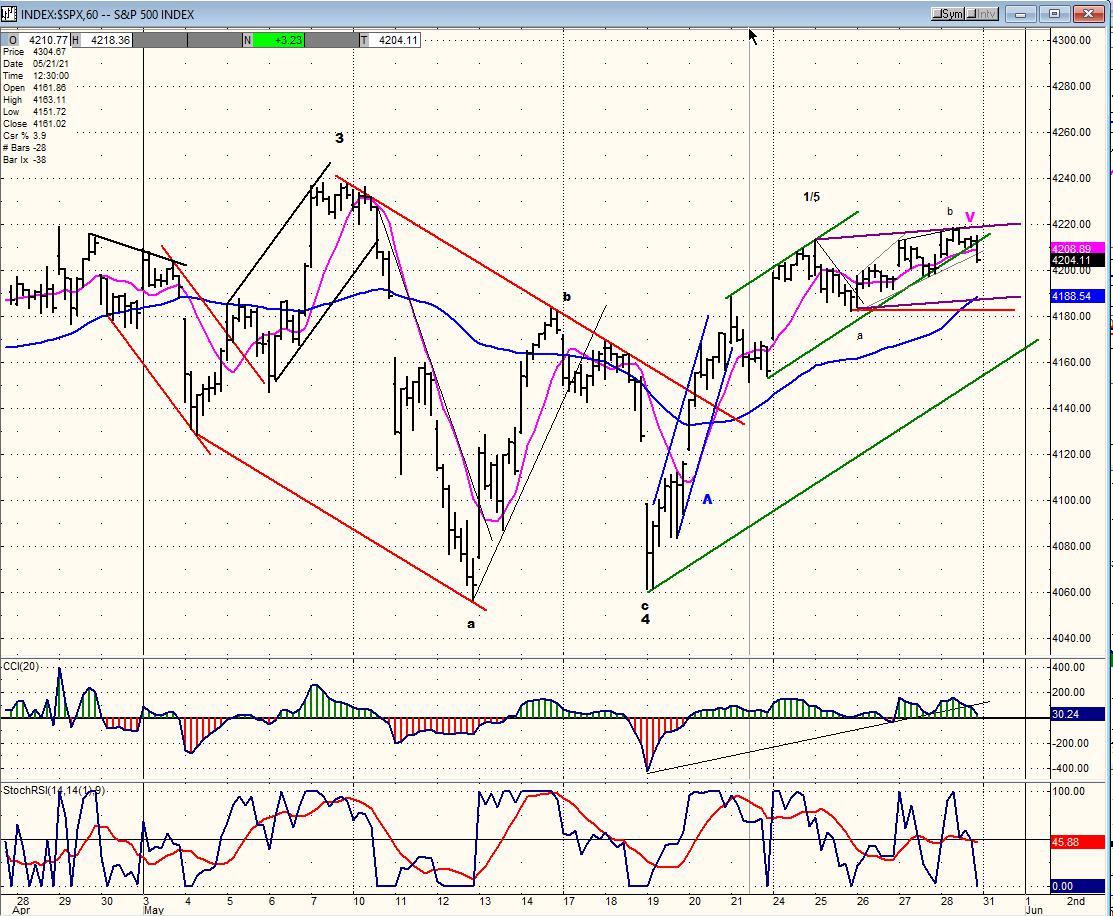
SPX hourly chart
The SPX hourly chart provides a detailed, close-up view of its current structure, with wave 3 from 3723 having completed at 4238, and wave 4 also complete after making an a-b-c pattern down to 4061 before starting on wave 5.
After the index had made a return move to 4213 by last Monday, the following action was a little murky since the expectation was that wave 1 of 5 had topped after reaching its ~4210 target and that wave 2 should now be causing a retracement; but the index refused to correct right away and instead made a little topping pattern which probably completed at Friday’s close. If so, it would suggest that Tuesday morning should continue the expected pull-back into wave 2 with the assistance of the bottoming 18-wk cycle.
We can only speculate beforehand on the impact that cycles and structure will have on the market, so let us see if we get the anticipated market action over the next week or so. Also remaining to be proven will be the P&F projection which calls for wave 5 of 5 to top at 4310+
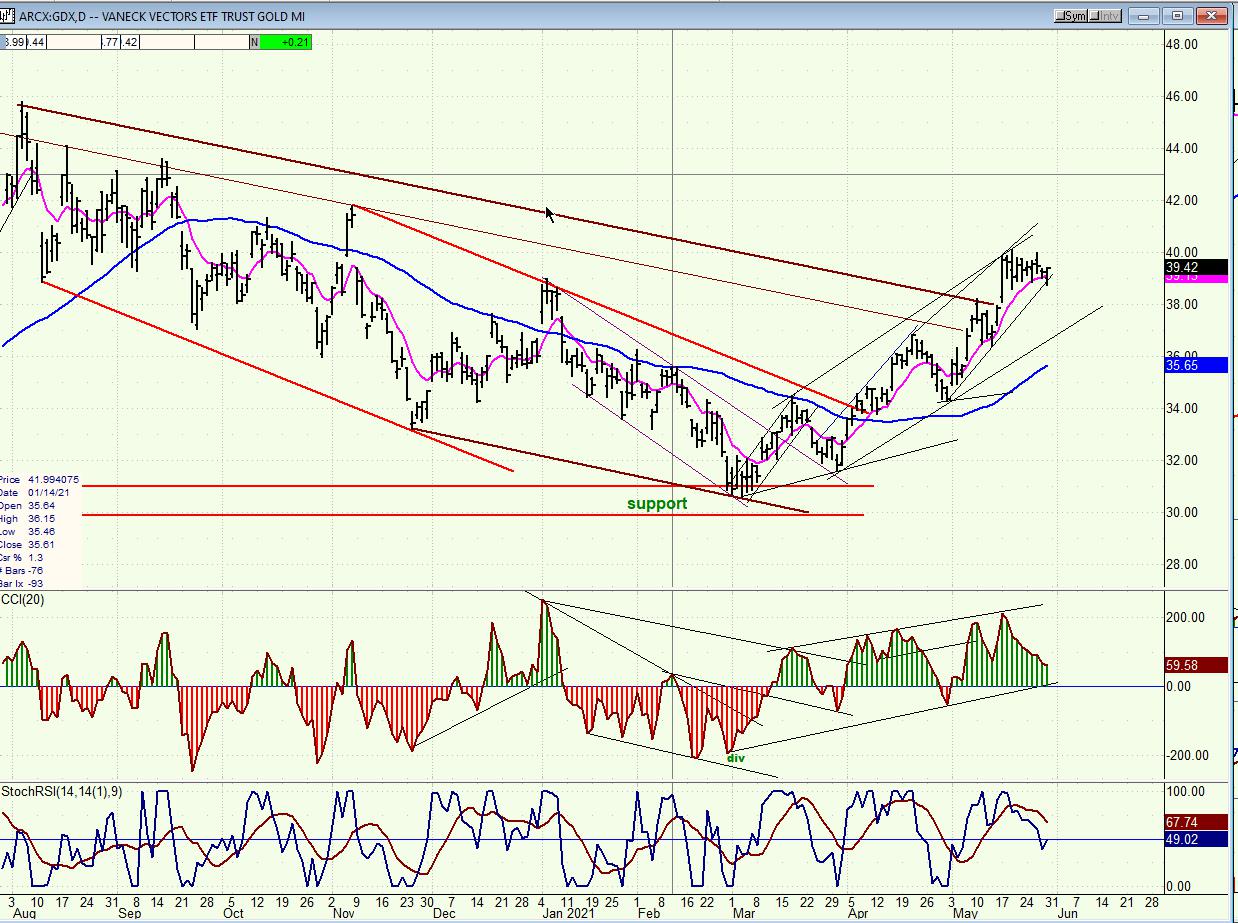
GDX (gold miners)-(dly)
If GDX can consolidate a little longer without going below 38, it could extend its rally to about 43.
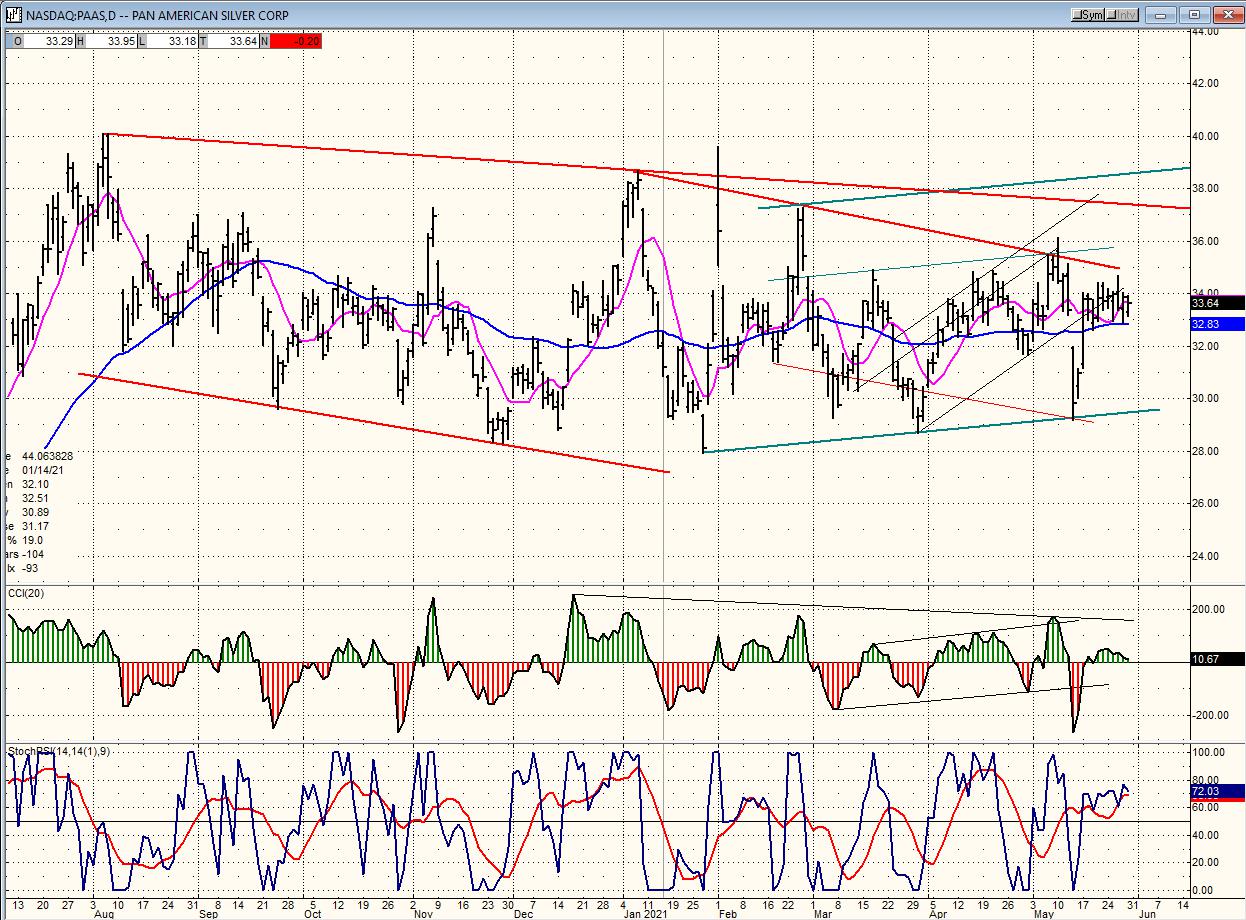
PAAS (Pan American Silver Corp-(dly)
PAAS also needs to consolidate a little longer without showing real weakness if it wants to reach 40 on its next move. What GDX does will affect PAAS in a similar manner.
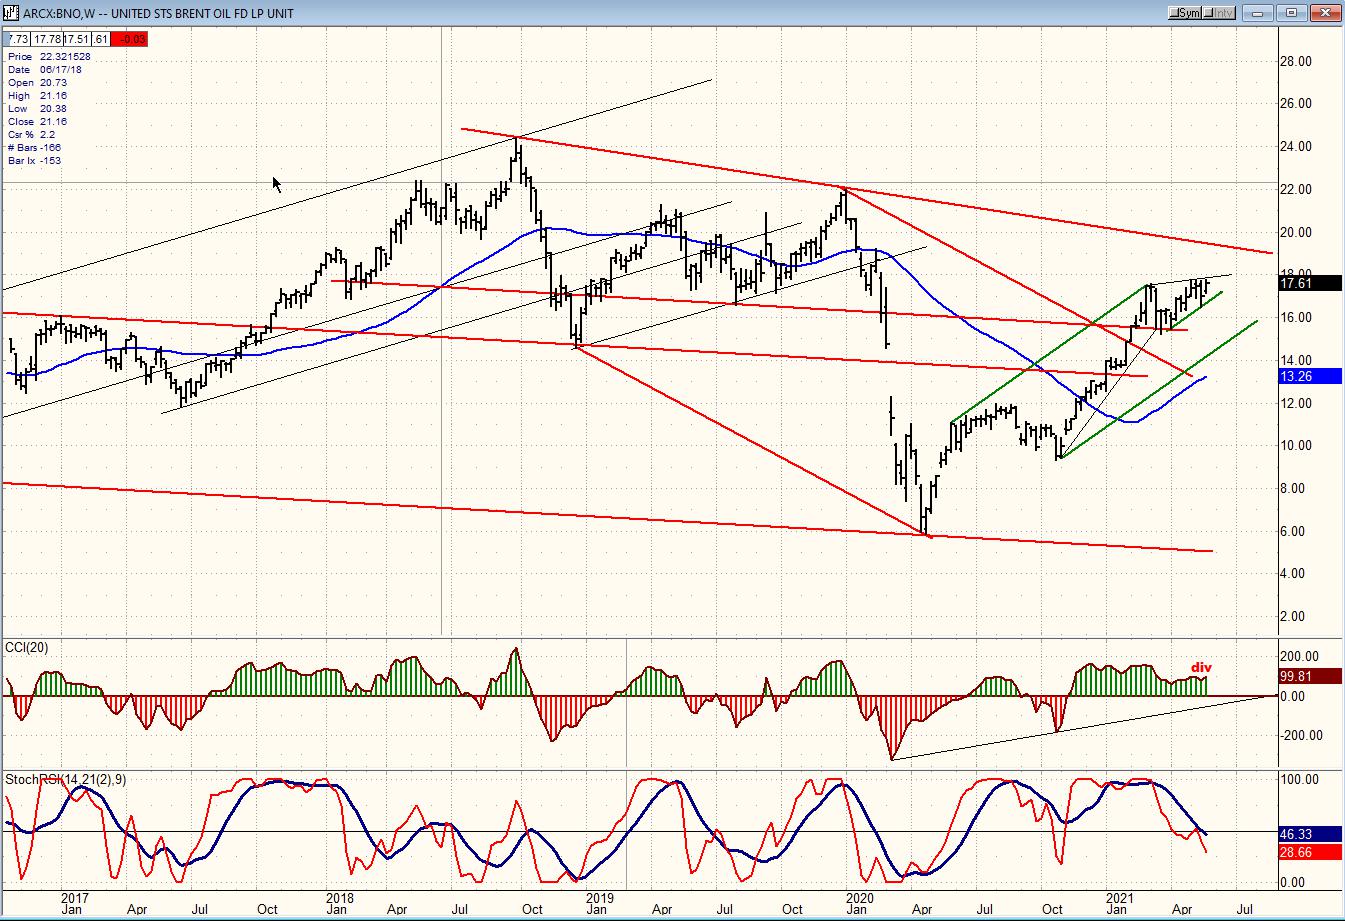
BNO (Brent oil fund) wkly
The weekly chart of BNO gives us a better appreciation of its price pattern. The past 10 weeks have moved in a crawling uptrend which has barely exceeded the previous high. The index is also struggling in an area of overhead resistance which will not be overcome with this kind of action. The odds rather favor a pullback to the previous short-term support where a decision will be made about the future trend.
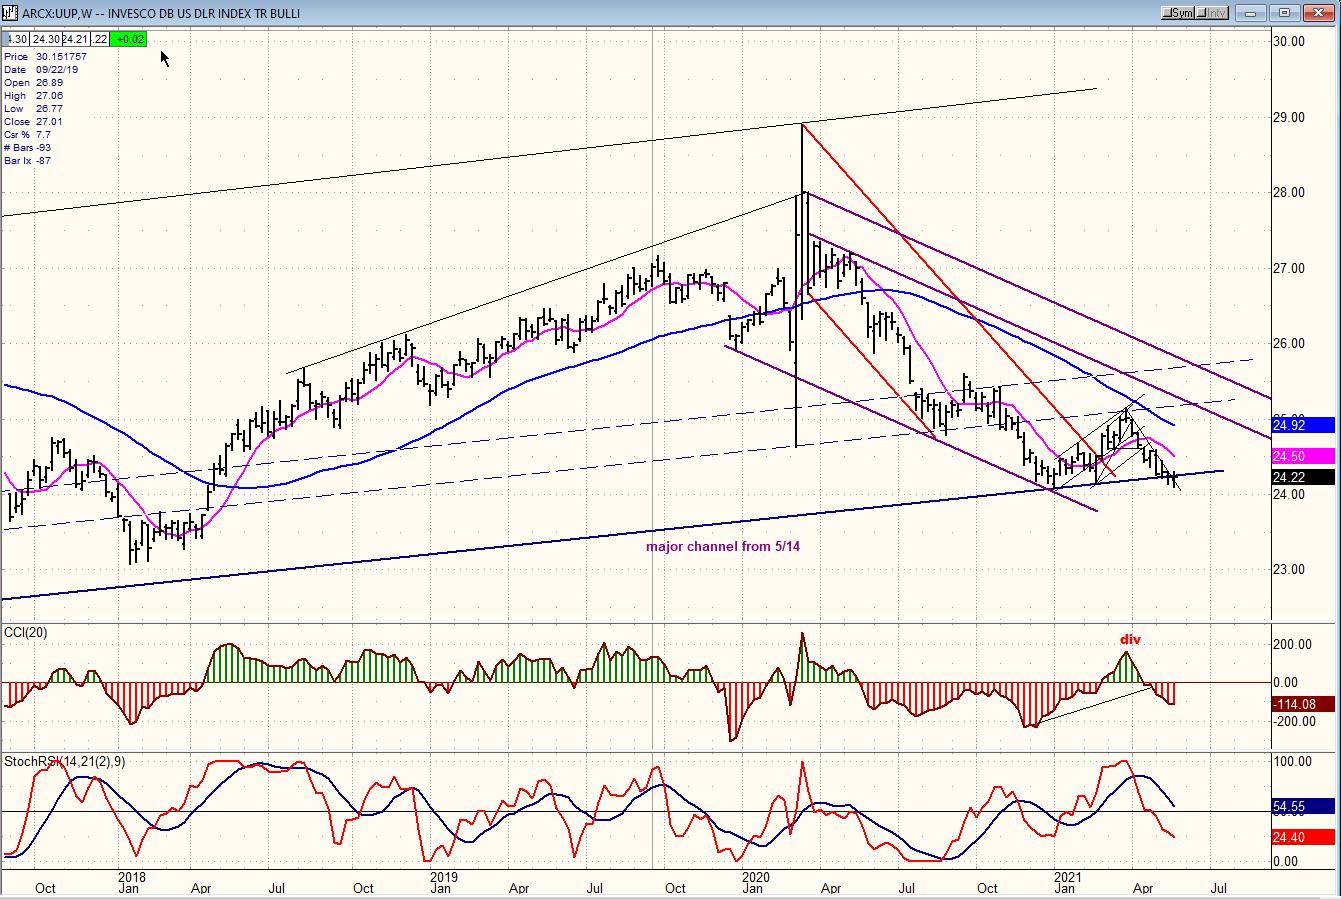
UUP (dollar ETF) (wkly) ($USD chart is not available from this data provider)
UUP appears to want to hold at previous support or just a little lower. Some good positive divergence is building in the CCI, but it still needs to do a lot of work to reverse its downtrend. After breaking its 50-dma at a much higher level, it did manage to rally back up to it, but was immediately repelled. It does not look as if much strength will be forthcoming unless it can overcome that MA.
SUMMARY
Best guesstimate is that SPX has completed wave 1 of 5 from 3723 and that it is ready to embark on wave 2. This will have to be confirmed by next week’s action. Until proven otherwise, the index could still reach about 4310+ upon completion of wave 5.
Free trial subscription
With a trial subscription, you will have access to the same information that is given to paid subscribers, but for a limited time-period. Over the years, I have developed an expertise in P&F charting (price projection), cycles (timing), EWT (structure), and general technical analysis which enables me to warn subscribers of pending reversals in market trends, and how far that trend can potentially carry. For a FREE 2-week trial, subscription options, and payment plans I encourage you to visit my website at www.marketurningpoints.com.
The above comments and those made in the daily updates and the Market Summary about the financial markets are based purely on what I consider to be sound technical analysis principles. They represent my own opinion and are not meant to be construed as trading or investment advice but are offered as an analytical point of view which might be of interest to those who follow stock market cycles and technical analysis.
*********

When Andre Gratian was a stock broker years ago, a friend introduced him to technical analysis of the market. Consequently, it is not an exaggeration to say that Andre fell in love with this approach! Ever since then, it has become an increasingly important part of his professional life. Gratian has studied the works of Wyckoff, Edwards & Magee, Edward J. Dewey (cycles) and many others. However, one of my most profitable undertaking has probably been to study Point & Figure charting, which he finds invaluable in analyzing stocks and indices. If he were restricted to one methodology, this is the one that he would choose. This well-rounded background has given him what he feels to be a special insight into the stock market, facilitating the recognition of meaningful patterns and the ‘turning points’ in all trends, whether they be short or long term. Andre feels very comfortable discussing the stock market and passing on meaningful information to others. His subscribers include individuals and money managers throughout the world. Moreover, his Newsletters are currently published on several financial sites, here and abroad.


