Technical Analysis Of The Markets


Current Position of the Market
SPX Long-term trend: There is some evidence that we are still in the bull market which started in 2009 and which could continue into 2021 before major cycles take over, and it ends. A move up to ~4500 is possible before the current bull market makes a final top and SPX corrects into its next major cycle low due in 2023.
SPX Intermediate trend: SPX has likely reached the end of an intermediate phase.
Analysis of the short-term trend is done daily with the help of hourly charts. They are important adjuncts to the analysis of daily and weekly charts which determine longer market trends.
Cycles: Looking ahead!
7-yr cycle – Last lows: 2009-2016. Next low: ~2023
Market Analysis (Charts, courtesy of StockCharts)
Long-term review
DJIA
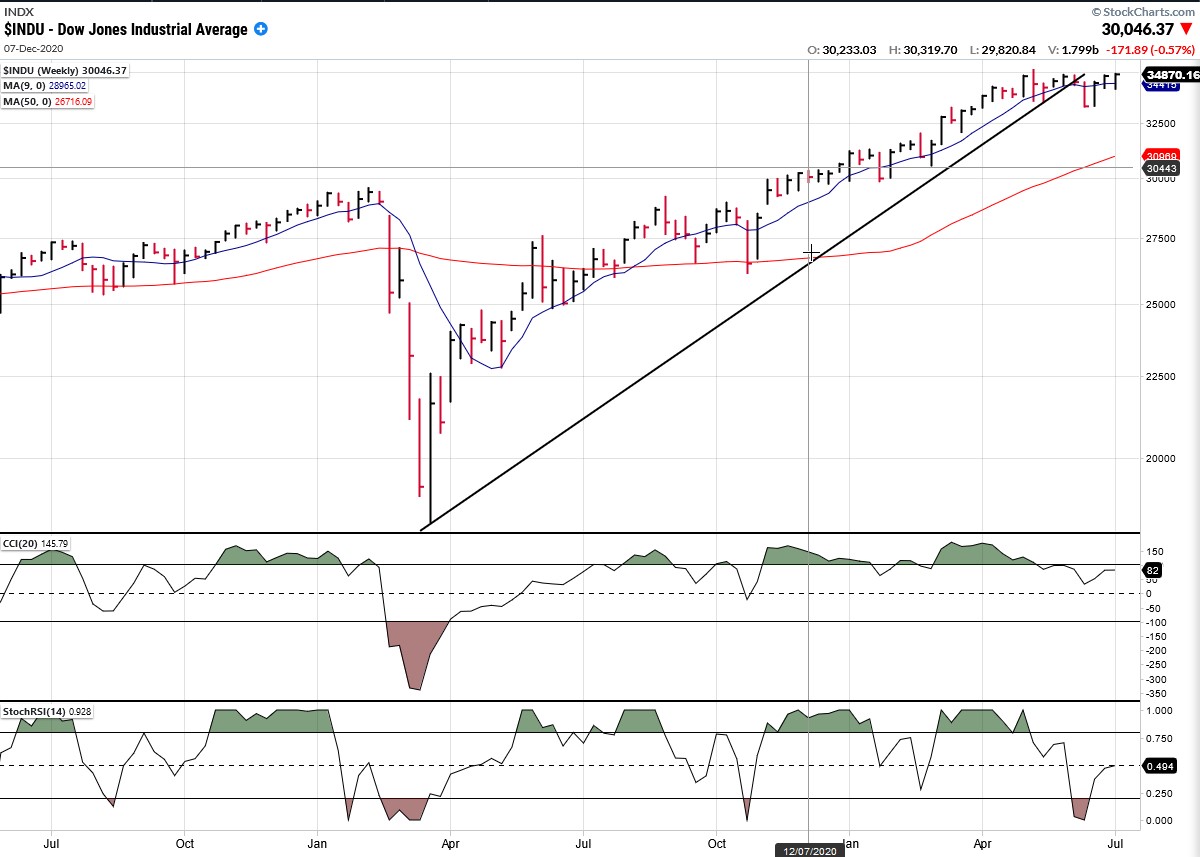
Analyzing the trend from the March low, DJIA has steadily decelerated in the past few weeks and made a high two months ago which it has not been able to surpass; but, although it has broken its long-term trend line, it has not yet been able to generate a downtrend. A few high-tech components have been able to keep it from exhibiting real weakness.
NDX
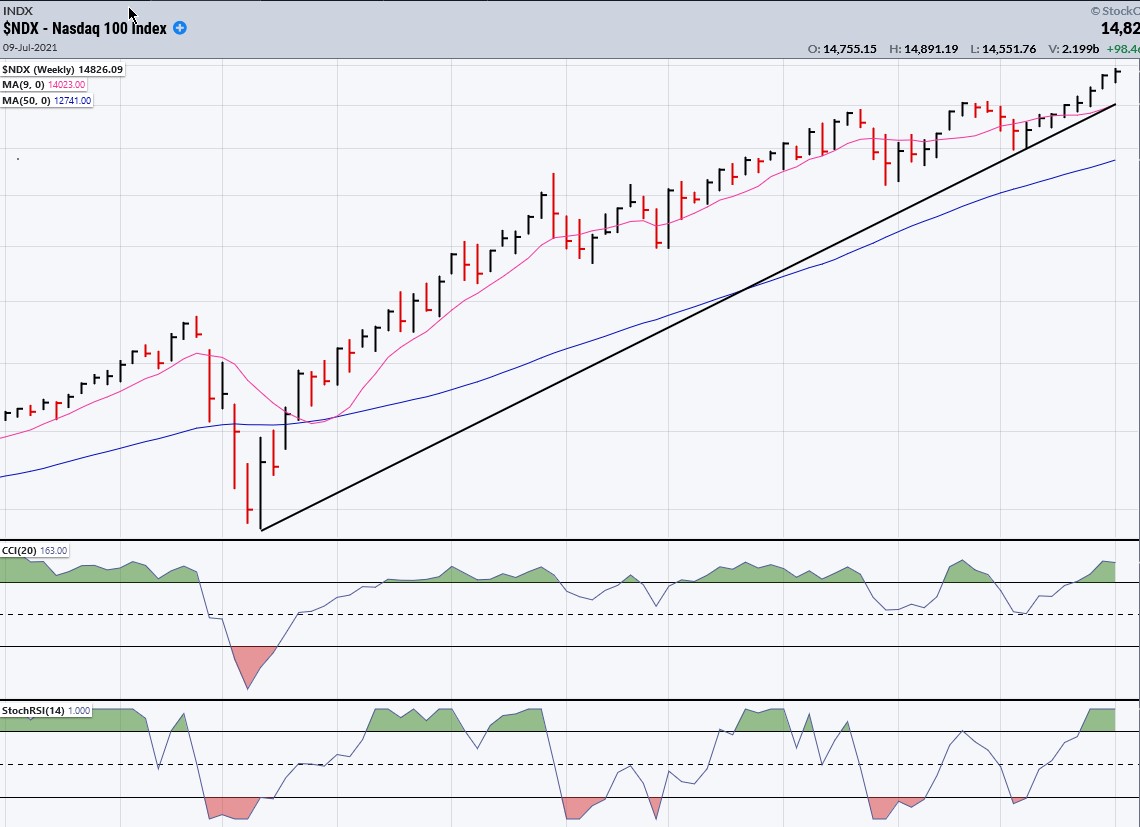
These high-tech stocks and others which make up the NDX have driven the index to new all-time highs day after day. Starting this week, its indicators are beginning to lose their upside momentum and are giving an inkling that they may be about to reverse. If they follow through, it could mean that NDX is ready to challenge its long-term uptrend line as well.
SPX
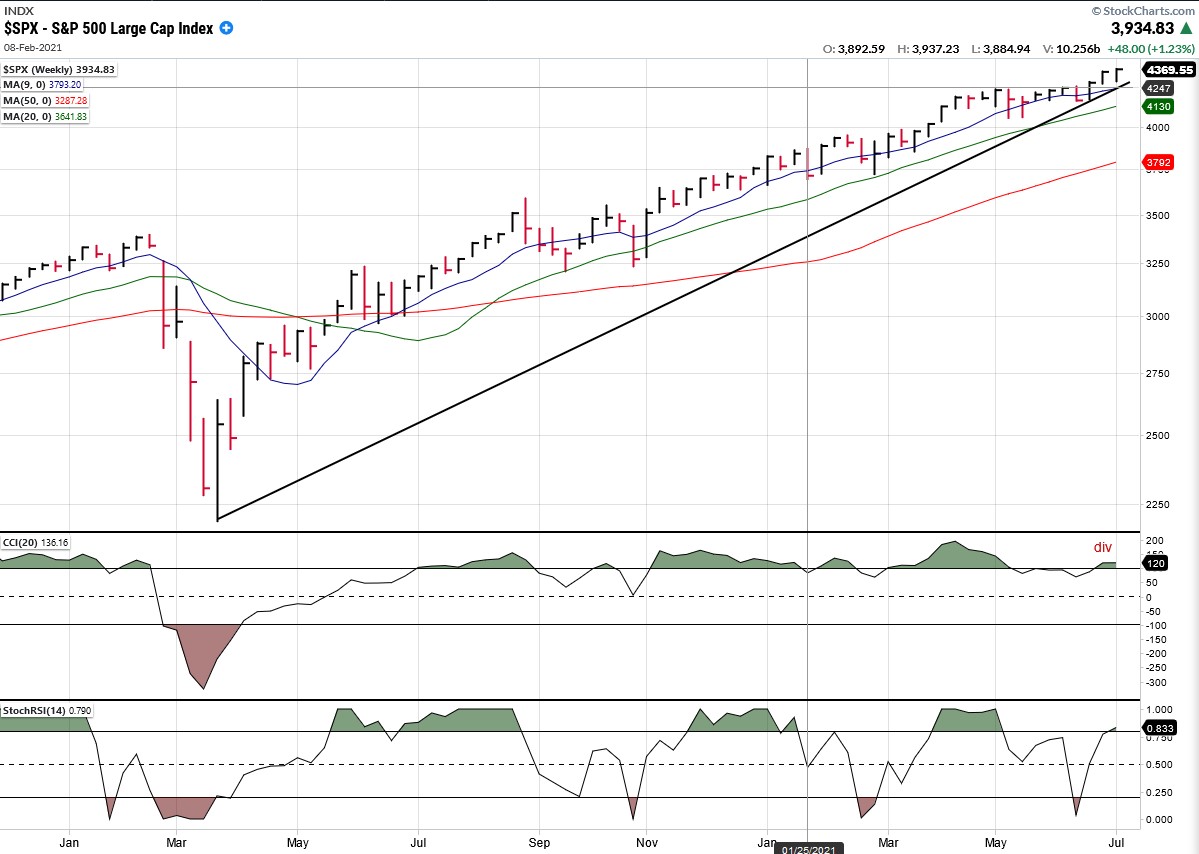
A hybrid of the two above indexes, SPX is stronger than DJIA and weaker than NDX, but may be about ready to join the former with a broken trend line. Each of the past three weeks, the index closed on its high of the week but, although it made a new high last week, it was only by a fraction, and both indicators are displaying strong negative divergence which could forecast an imminent move below the trend line.
SPX daily chart
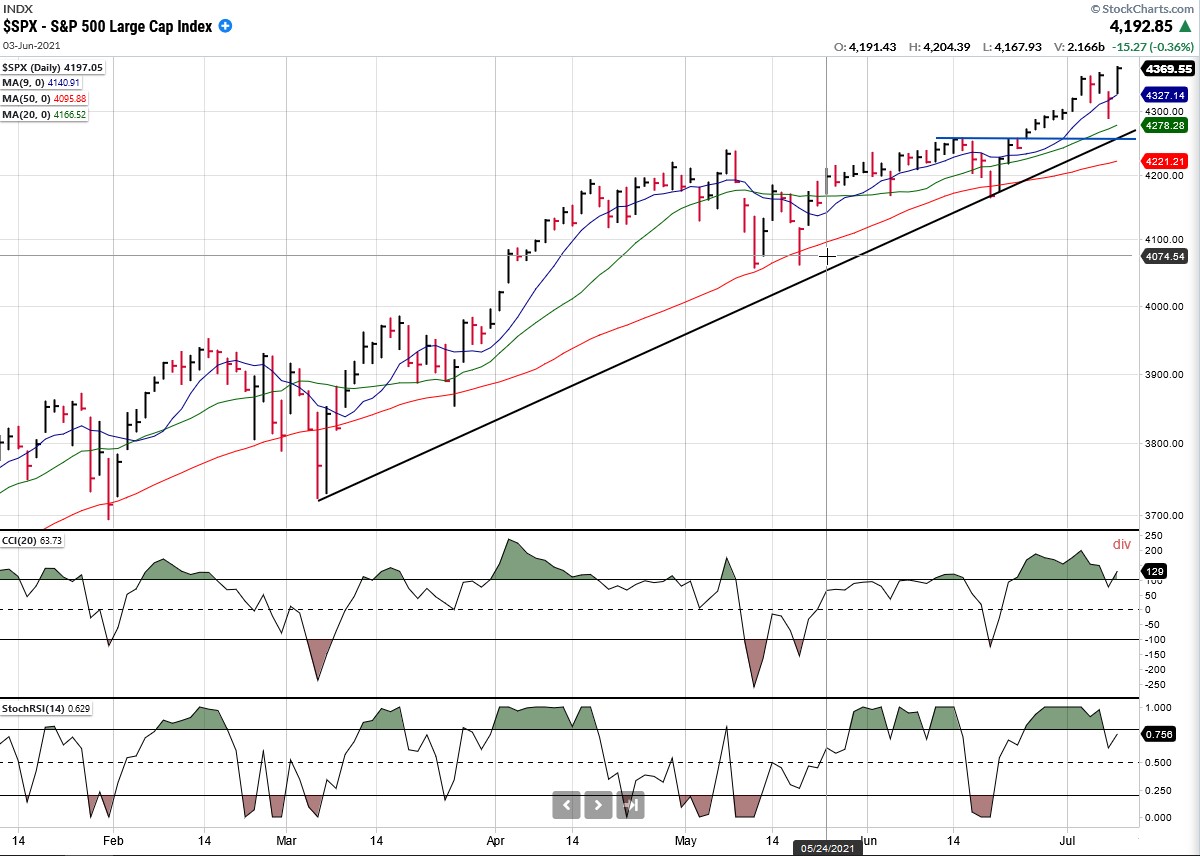
The daily chart of SPX has shown a pick-up in volatility over the past few days with a 70+ point drop on Thursday followed by a rally to a new high on Friday. In the last newsletter I suggested that a base projection pointed to the end of a bullish phase at about this level which was being reinforced by the cyclic configuration of this index. Last week’s action is probably part of the process of establishing a top, including the volatility which forms the necessary congestion through a set of reversals on the P&F chart denoting distribution. The combination of price analysis supplanted by indicators, P&F projections, and market cycle awareness (courtesy of Eric Hadik ([email protected])) provide a fairly accurate reading of what the market is doing. The current action strongly suggests that an important top is in the process of forming. The base P&F formation created in March 2020 shows the possibility of higher levels being attained before the bull market comes to an end as the 7-year cycle due to bottom in 2023 reverses the current trend, but P&F charting only produces approximate targets, so we cannot determine, at this time, if we are already coming to the end of the bull market, or if this is only going to be an intermediate correction marking the last correction prior to the final bull market top.
Elliott Wave theorists argue that a decline into early 2023 would not put an end to the bull market which started in 2009, but that SPX would still make a new high that would mark the true ending of the 2009 bull market after which, a devastating bear market would take hold. Of course, defining what constitutes a bear market is a matter of semantics. If you think that a ~2-year decline into early 2023 is long enough to be called a bear market, then so-be-it!
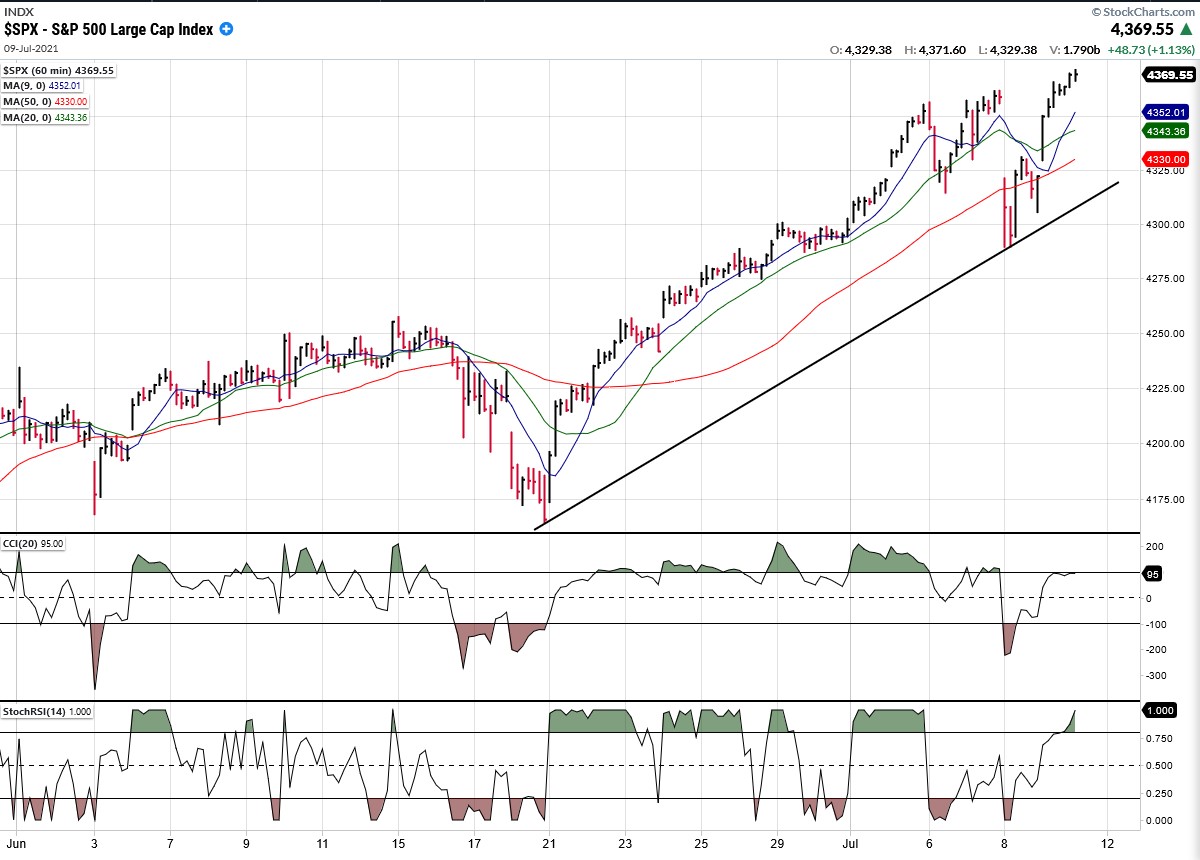
SPX hourly chart
With a new high struck on Friday, the former trend line was invalidated and a new one drawn. But with the short-term cycle low due in about a week, the new one should give way and be followed by an estimated 80-point decline, based on an incomplete P&F pattern at this time which will have to be confirmed after the reversal takes place. If we should continue lower, there is good support starting at about 4260.
After the cycle has made its low, we shall have to see if SPX can make another new high. If this turns out to be an intermediate term top, it is possible that the next rally will only challenge the current high and create additional congestion from which we can then determine the extent of the total correction. At this time, if we are in the process of correcting the move which started from 3723, we should expect the decline to continue down to about 4030 (a 50% retracement).
There was no liquidation in the futures after Friday’s close, so it is possible that we could push just a little higher on Monday before the correction takes hold.
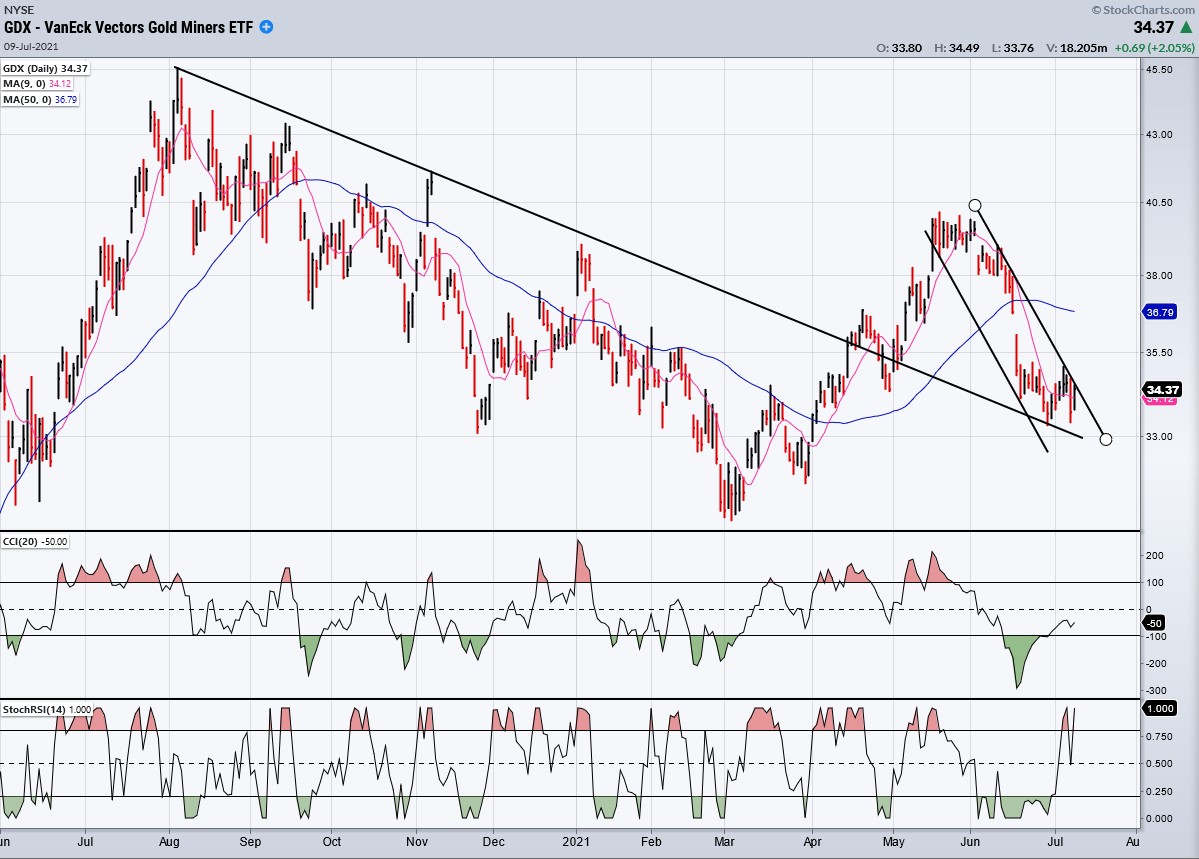
GDX (gold miners) (dly)
GDX has now pulled back to its trend line where it should find support and rebound, but we should not expect a big rally to start from there. More congestion will probably have to form between 35 and 40 to create another base capable of supporting a bigger move before the index can overcome its recent short-term peak.
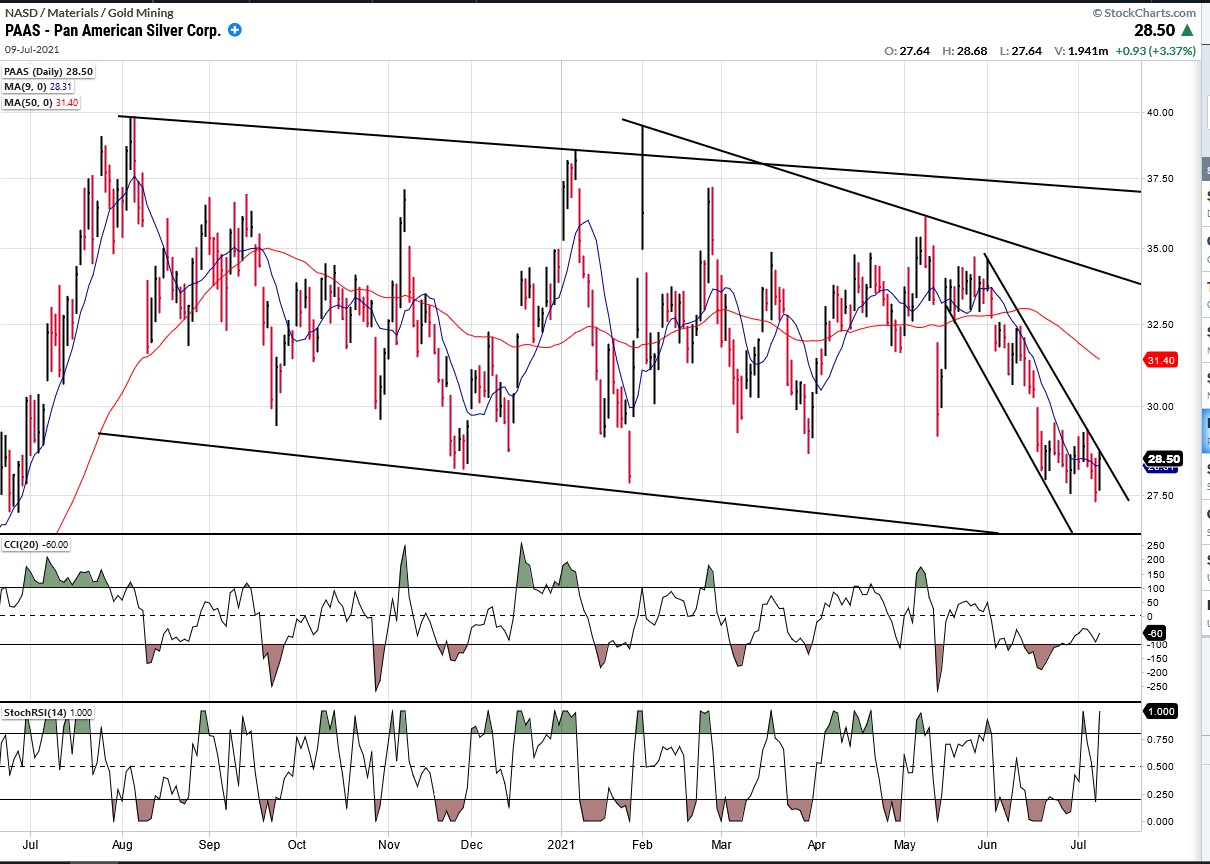
PAAS (dly)
PAAS has declined to the lower confines of a broad consolidation band which is now a year long. Like GDX, when it comes out of its short descending channel it will be limited to a rally of about four points and then it will have to form a higher shelf which will serve as a base that will eventually enable it to move out of the larger pattern. This process could take several months.
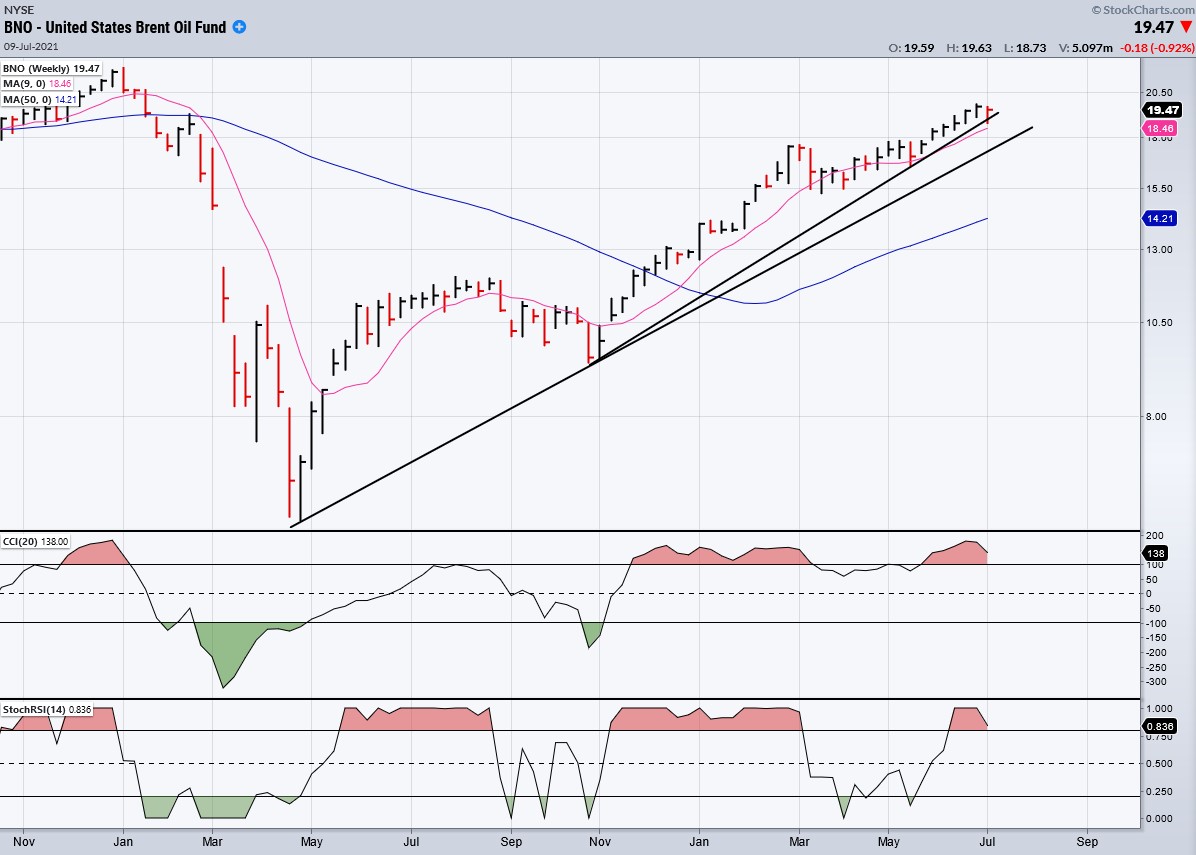
BNO (Brent oil fund) wkly
A weekly chart is best to show the progress that BNO has made since the bottom of the severe decline from its 46.68 high of mid-2014. A .382 retracement of that downtrend would take it a couple of points higher, but it may need to pull back to the larger trend line and around 18 before finishing that move.
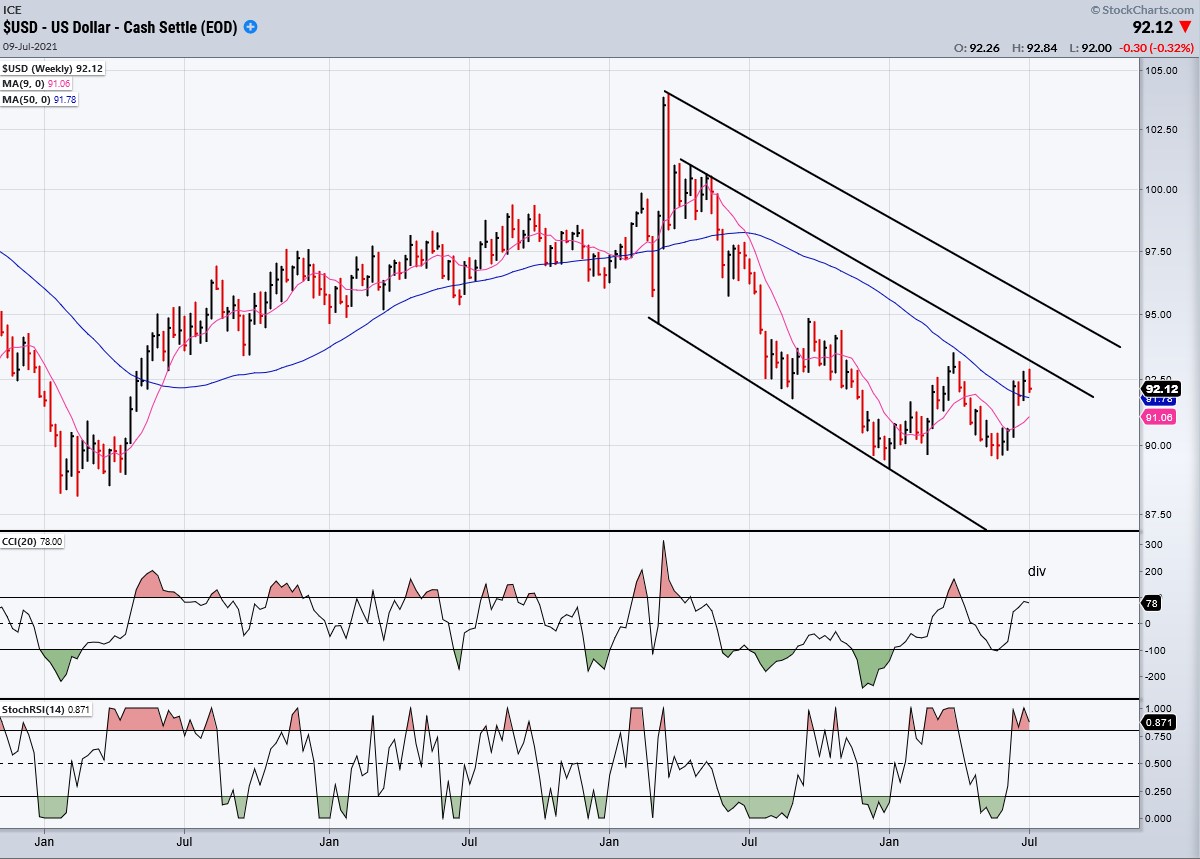
USD (dollar) (wkly)
The dollar is consolidating after finding support at ~89. It could continue to move sideways for several more weeks and months until it arrives in the vicinity of the top channel line. It has severe resistance starting around 95 which has already repelled it once and may be about to do so again when it gets back to that level -- which would also represent a .382 retracement of the decline from its 104 level. In other words, it does not look like it is going very far in either direction for some time with a major trend decision most likely postponed until it reaches the outer corrective channel line.
SUMMARY
SPX is probably in the process of creating a double-top which will push prices back a few days after mid-month and into the short-term cycle low. The extent of the decline into that time frame and the following rebound will determine what kind of a top the index is currently making with a bias currently being toward one of intermediate dimension.
Free trial subscription
With a trial subscription, you will have access to the same information that is given to paid subscribers, but for a limited time-period. Over the years, I have developed an expertise in P&F charting (price projection), cycles (timing), EWT (structure), and general technical analysis which enables me to warn subscribers of pending reversals in market trends, and how far that trend can potentially carry. For a FREE 2-week trial, subscription options, and payment plans I encourage you to visit my website at www.marketurningpoints.com.
*********

When Andre Gratian was a stock broker years ago, a friend introduced him to technical analysis of the market. Consequently, it is not an exaggeration to say that Andre fell in love with this approach! Ever since then, it has become an increasingly important part of his professional life. Gratian has studied the works of Wyckoff, Edwards & Magee, Edward J. Dewey (cycles) and many others. However, one of my most profitable undertaking has probably been to study Point & Figure charting, which he finds invaluable in analyzing stocks and indices. If he were restricted to one methodology, this is the one that he would choose. This well-rounded background has given him what he feels to be a special insight into the stock market, facilitating the recognition of meaningful patterns and the ‘turning points’ in all trends, whether they be short or long term. Andre feels very comfortable discussing the stock market and passing on meaningful information to others. His subscribers include individuals and money managers throughout the world. Moreover, his Newsletters are currently published on several financial sites, here and abroad.


