Technical Analysis Of The Markets
 share
share
 share
share
 share
share
 share
share
 share
share
Current Position of the Market
SPX Long-term trend: There is some evidence that we are still in the bull market which started in 2009 and which could continue into 2021 until major cycles take over, and it ends. A move up to ~4500 is possible before the current bull market makes a final top and SPX corrects into its next major cycle low due in 2023.
SPX Intermediate trend: SPX May wat to push all the way to the top projection before making an important correction.
Analysis of the short-term trend is done daily with the help of hourly charts. They are important adjuncts to the analysis of daily and weekly charts which determine longer market trends.
SPX Going for the Major Top?
Cycles: Looking ahead!
7-yr cycle – Last lows: 2009-2016. Next low: ~2023
Market Analysis (Charts, courtesy of StockCharts)
SPX daily chart
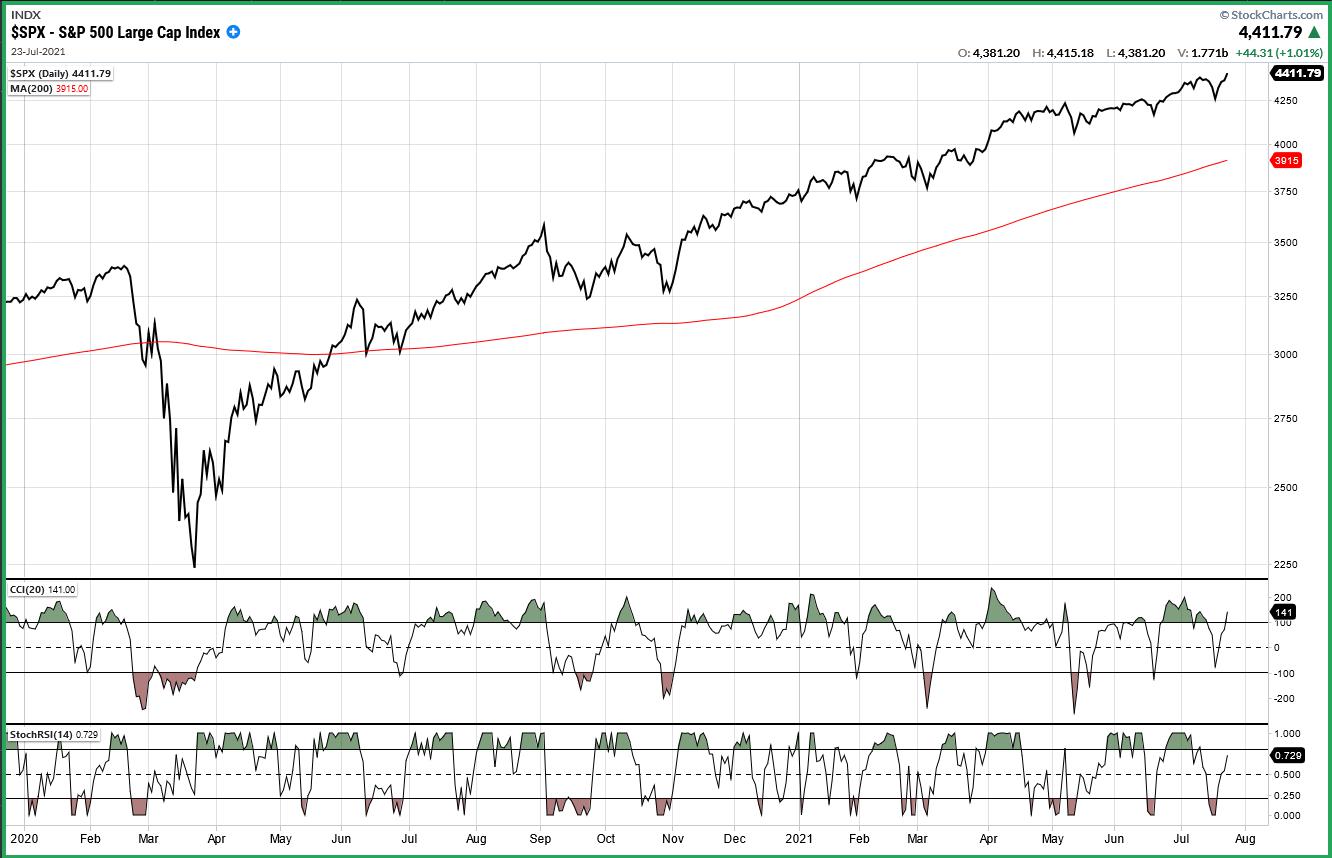
According to the P&F base which was formed at the March 2020 low, SPX was capable of an uptrend which would take it up to the vicinity of 4550. Point & Figure patterns only project price, not time. Since the index reached an all-time high of 4410 on Friday, this should be getting us close to the final high, and it is important that we get this right because, with the prospect of a 7-year cycle low due in 2023, this market top could be followed by a severe correction which could last many months.
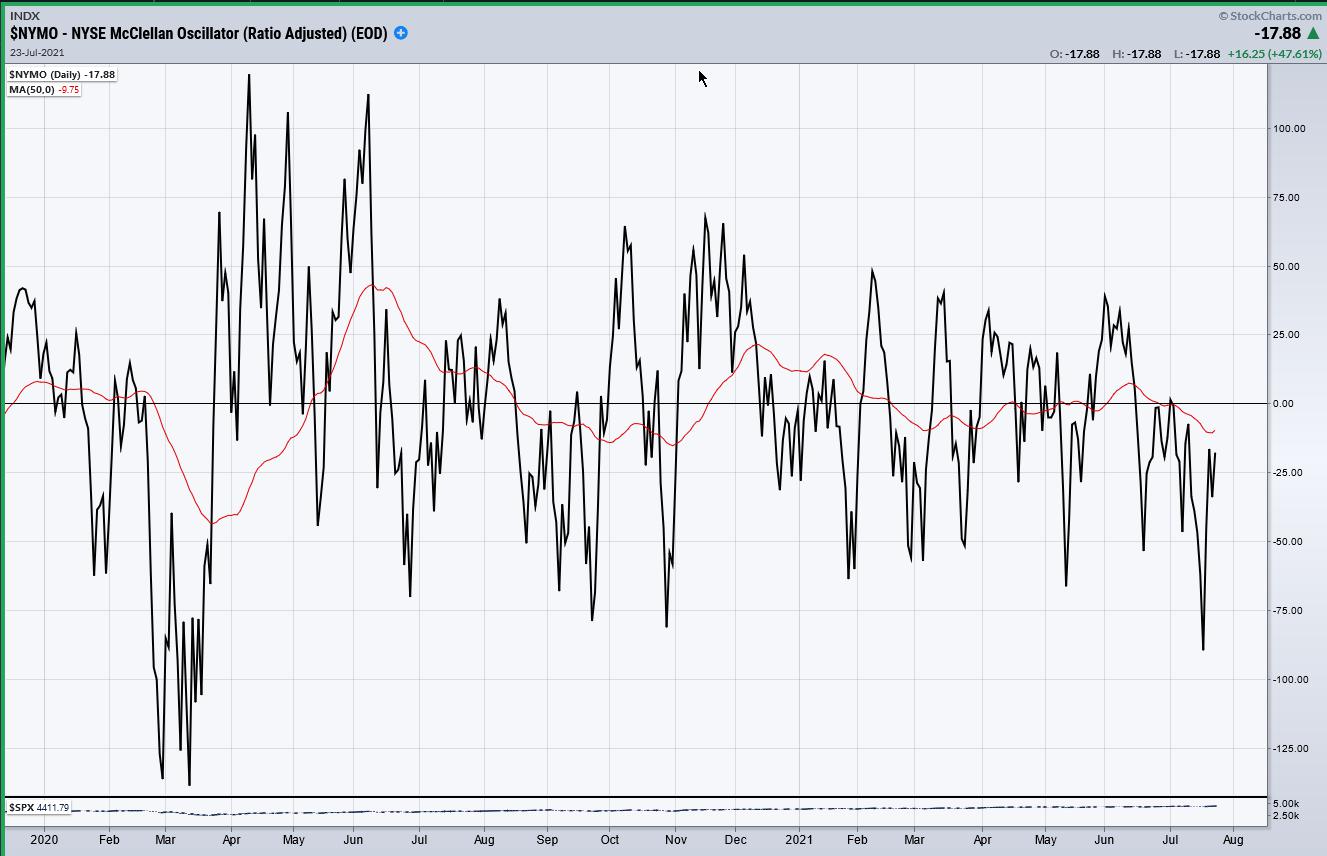
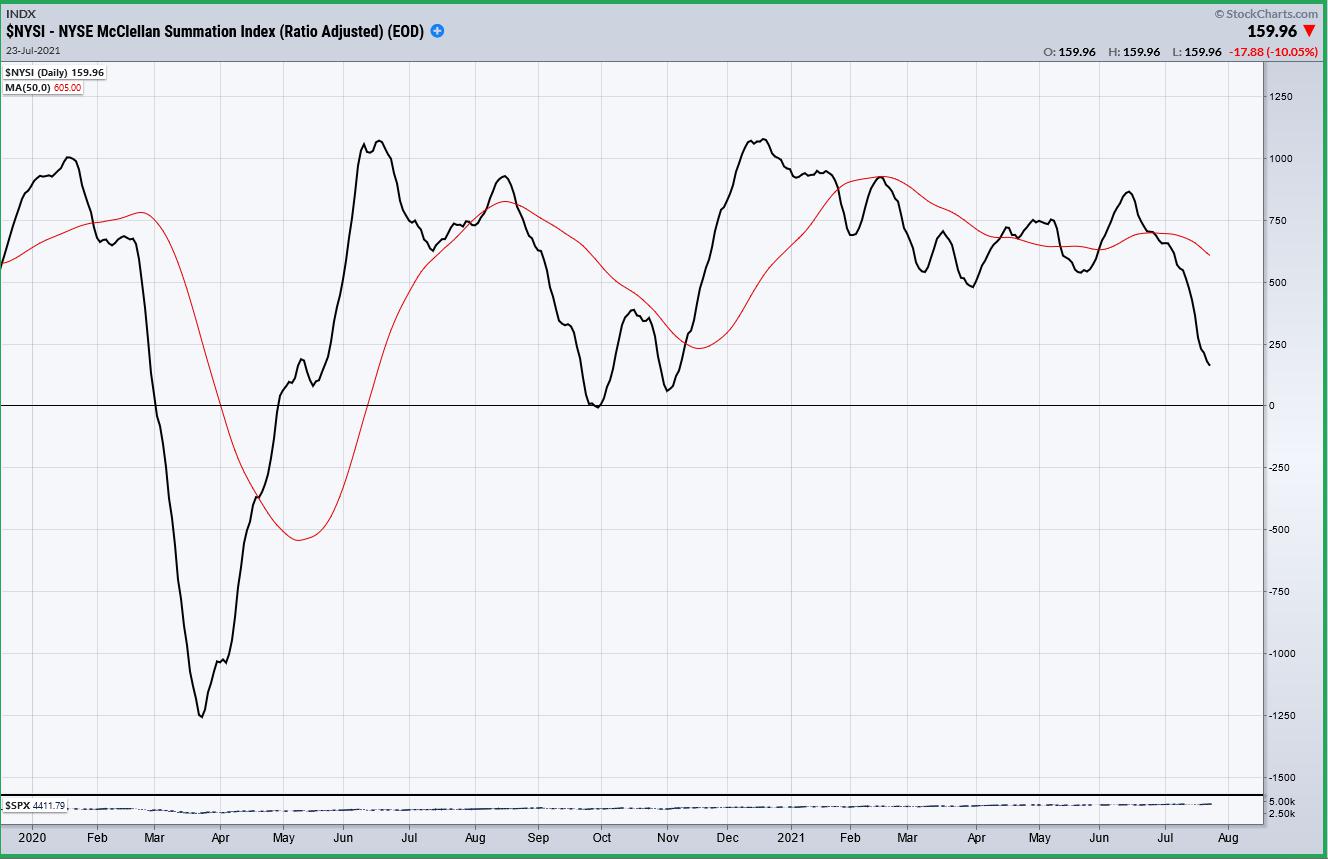
We do not have to depend solely on an analysis of the price to determine the validity of the P&F projection, we can get the assistance of breadth indicators to confirm what is expected. The McClellan oscillator and the McClellan summation index are excellent indicators which measure market breadth: the former on a shorter-term basis, and the latter on an intermediate basis. Both indicators have been posted below the chart of the SPX, and all three charts span the uptrend which started from the March 2020 low. We do not have to analyze the entire chart. We only want to see if the breadth indicators support the view that we are approaching an important market top, and indeed they do! While the SPX is still recording new all-time highs, the summation index peaked in December 2020 and maintained a strong positive reading until last month; then started to deteriorate and accelerate downward during the month of July. It is now approaching the zero line and, at the current rate of decline, could cross into negative territory by the end of the month. This suggests that we may be near to experiencing a market correction of intermediate nature.
The sharp rally which occurred this past week lifted the shorter oscillator from an oversold level -- the lowest reached since March of last year -- but it remains in a downtrend, well below its June peak. The next short-term peak in the oscillator could also be the next short-term peak in the market.
The momentum indicators below the price charts remained well below their former highs, even though SPX made a new all-time high. In other words, whether you look at the market on a short-term or on an intermediate basis, the indicators are flashing warning signs.
SPX hourly chart
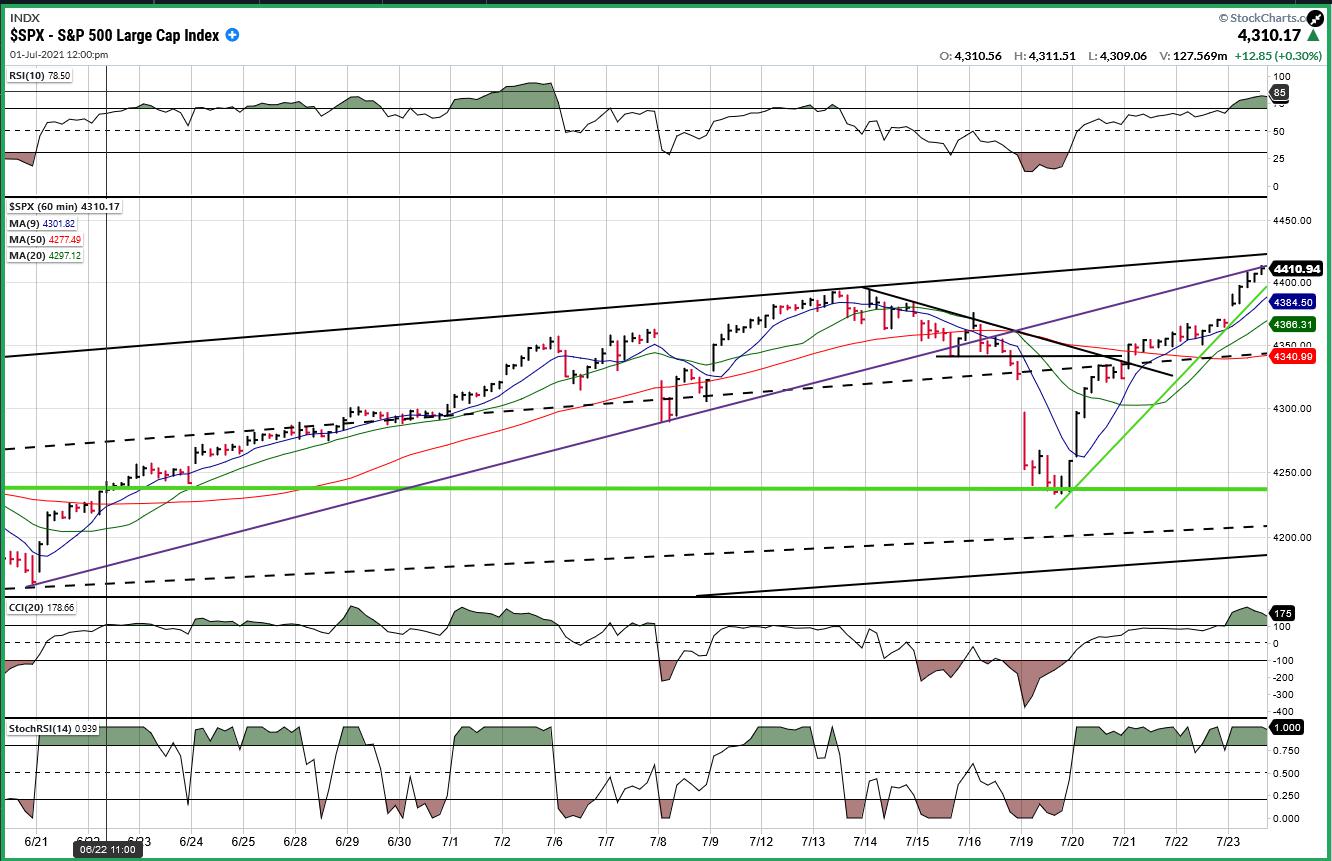
The short-term cycle which was ideally due to make its low last Friday had brought only a mild correction to the index, and the sharp follow through on Monday was a bit of a surprise. But the rally which came afterwards was even more surprising, rising 180 points to a new high with nothing more than a 5-point retracement. Finally, on Friday, there were signs that the rebound might have run its course. The index was beginning to find resistance underneath the former broken trend line extension, and the CCI which had become sharply overbought was showing some signs of deceleration. The cycle will enter its 5th day on Monday and could be ready for a pullback, even if we have not made the final high of the move. Breaking the green trend line could bring about that first correction before continuing the rally to 4440 or a little higher.
The question that we should ask ourselves is whether SPX intends to continue its uptrend until it reaches its final projection (which is deemed to be to about 4550) without having a good consolidation, first. So far, the intermediate indicator shown above has only given a warning, not a sell signal.
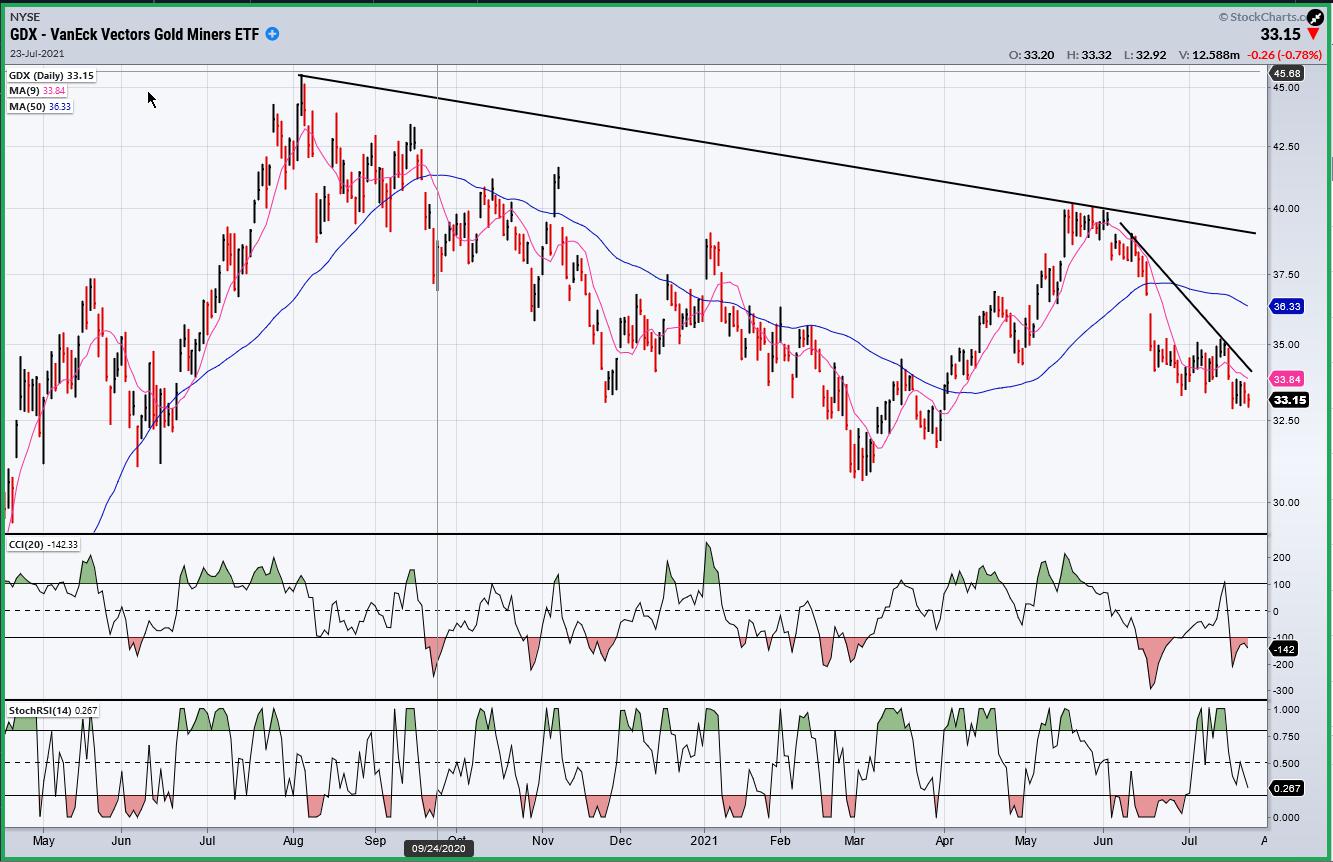
GDX (gold miners) (dly)
GDX continues to correct. It is in an area of support and will have to show that it is able to hold this level. The best that could be expected short-term would be to build a small base from which it can try to get back into a short-term uptrend. Until it shows the propensity to challenge its 50-dma, it is not likely to do very much on the upside and could continue to drift lower. Moving outside of its short-term downtrend line would be a positive.
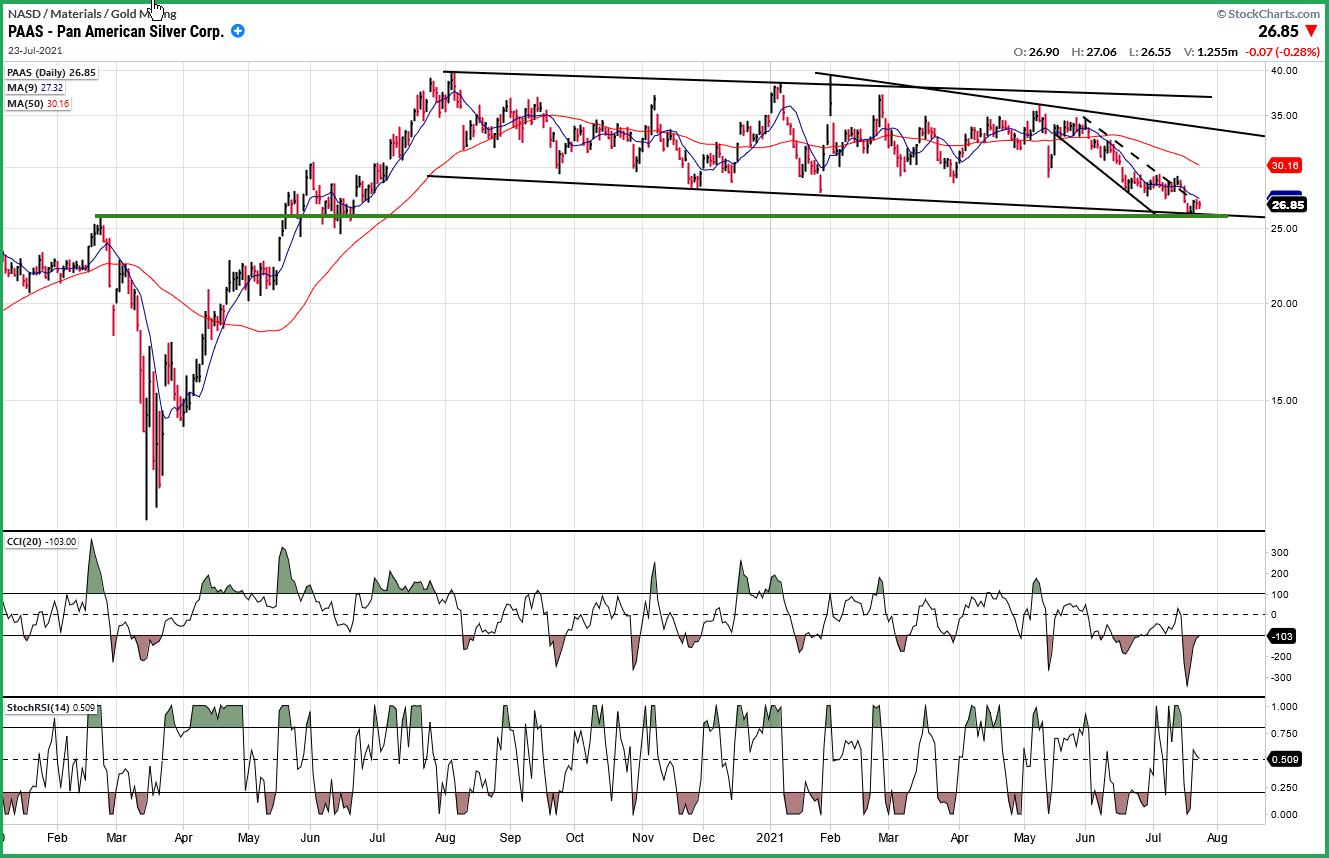
PAAS (dly)
PAAS has retraced to the bottom of its consolidation channel where it must find enough support to retrace its corrective trend. It is also finding support from a previous intermediate high, which makes it all the more important that it hold this level. Finally, the reason it should hold this support is because the entire corrective wave represents nearly a 50% retracement of the move from the March low. The action of the next few days and weeks will be important. If it can hold in this general area, it should start reversing its trend to the upside.
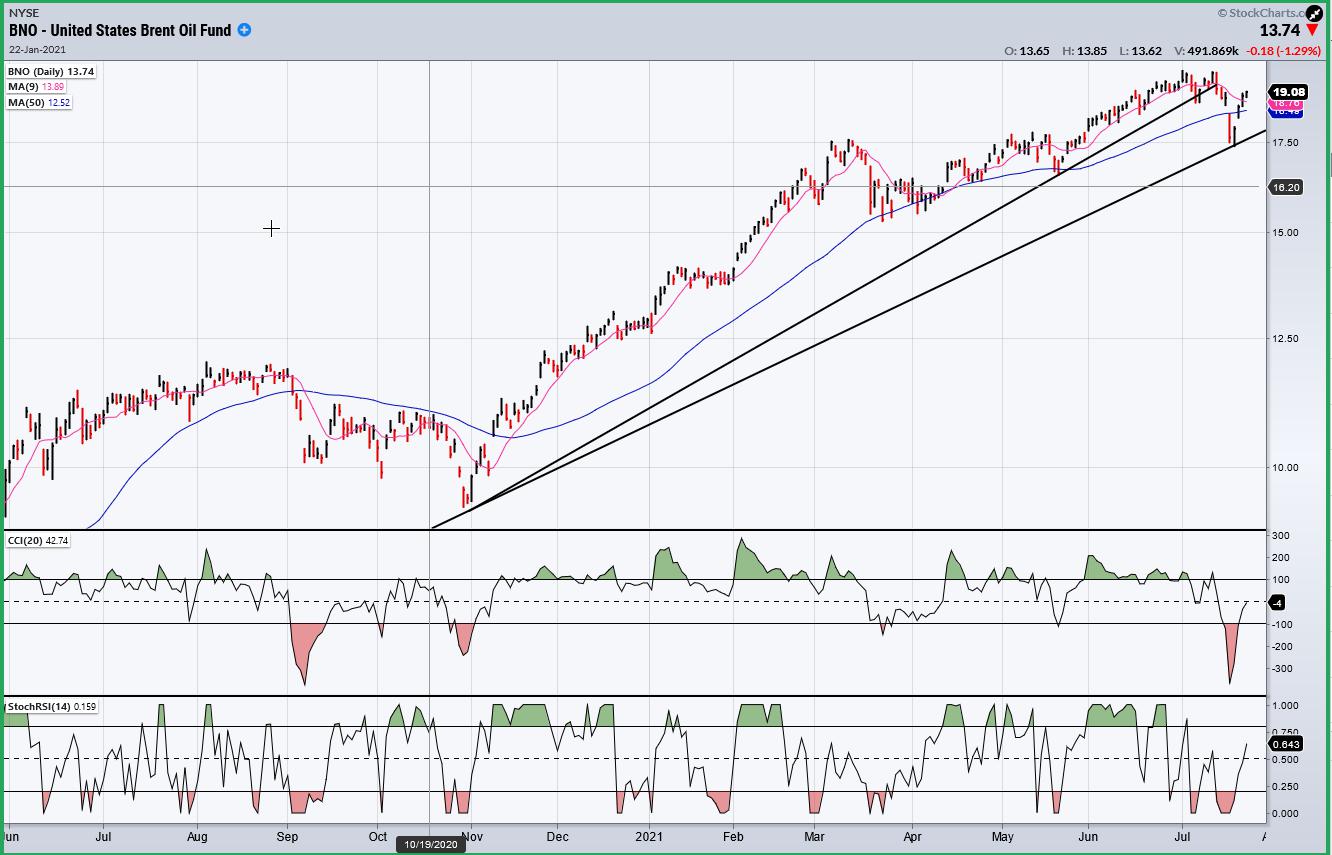
BNO (Brent oil fund) dly
BNO broke a secondary trend line and found support on its primary line, which created a bounce. If it cannot make a new high right away and closes below its 50-dma, it could retrace down to about 15.00
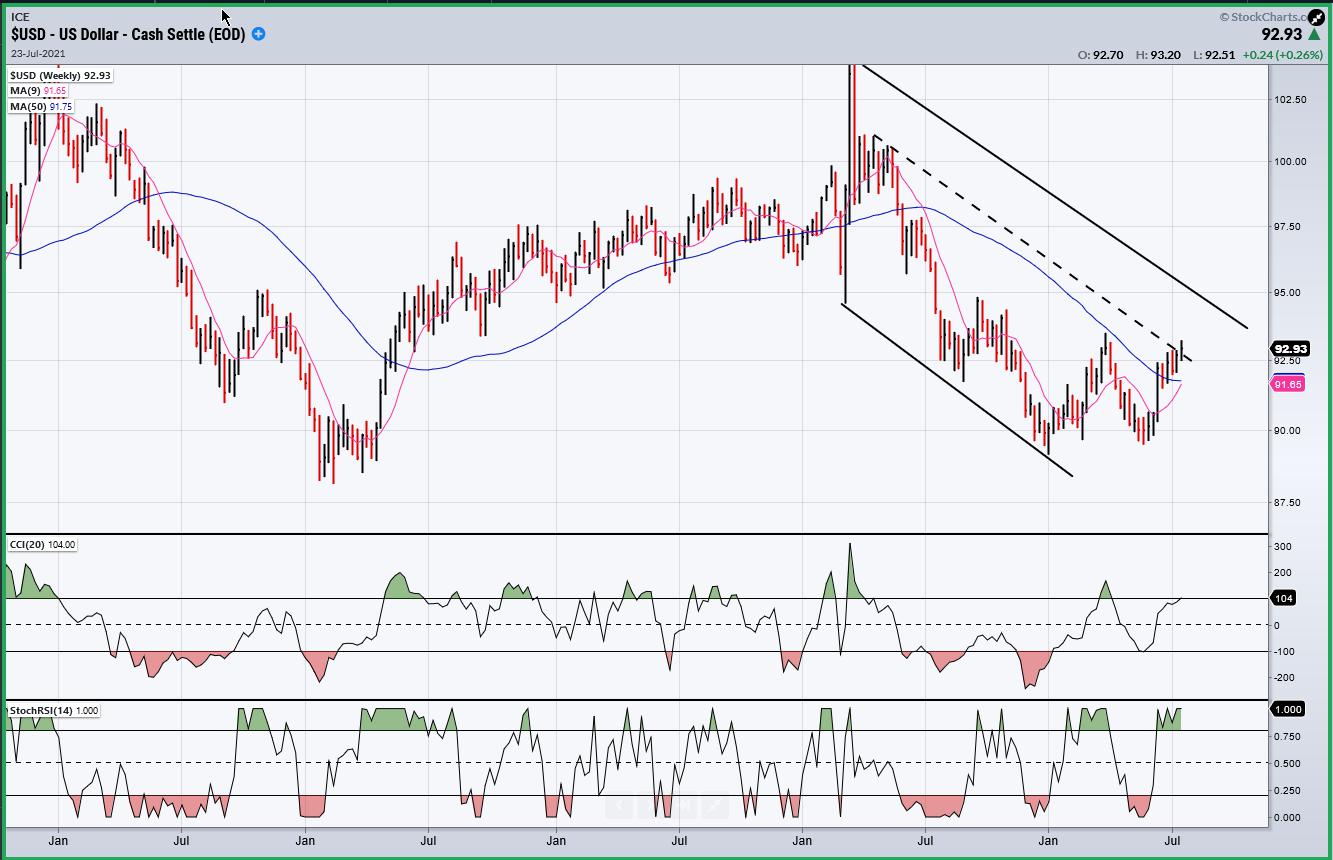
USD (dollar) dly
USD has strong overhead resistance between 94 and 95. A move back to 95 would be a .382 retracement of the decline from its March 20 high, as well as the top of its corrective channel from that high. Failing to go beyond that level and turning down would likely continue its intermediate correction.
SUMMARY
SPX rallied sharply from its short-term cycle low and immediately made a new high. As long as the cycle holds out, it could push to 4440+ before finding the next short-term top.
Free trial subscription
With a trial subscription, you will have access to the same information that is given to paid subscribers, but for a limited time-period. Over the years, I have developed an expertise in P&F charting (price projection), cycles (timing), EWT (structure), and general technical analysis which enables me to warn subscribers of pending reversals in market trends, and how far that trend can potentially carry. For a FREE 2-week trial, subscription options, and payment plans I encourage you to visit my website at www.marketurningpoints.com.
The above comments and those made in the daily updates and the Market Summary about the financial markets are based purely on what I consider to be sound technical analysis principles. They represent my own opinion and are not meant to be construed as trading or investment advice but are offered as an analytical point of view which might be of interest to those who follow stock market cycles and technical analysis.
********
share
share
share
share
share

When Andre Gratian was a stock broker years ago, a friend introduced him to technical analysis of the market. Consequently, it is not an exaggeration to say that Andre fell in love with this approach! Ever since then, it has become an increasingly important part of his professional life. Gratian has studied the works of Wyckoff, Edwards & Magee, Edward J. Dewey (cycles) and many others. However, one of my most profitable undertaking has probably been to study Point & Figure charting, which he finds invaluable in analyzing stocks and indices. If he were restricted to one methodology, this is the one that he would choose. This well-rounded background has given him what he feels to be a special insight into the stock market, facilitating the recognition of meaningful patterns and the ‘turning points’ in all trends, whether they be short or long term. Andre feels very comfortable discussing the stock market and passing on meaningful information to others. His subscribers include individuals and money managers throughout the world. Moreover, his Newsletters are currently published on several financial sites, here and abroad.


