Technical Analysis Of The Markets


Current Position of the Market
SPX Long-term trend: There is some evidence that we are still in the bull market which started in 2009 and which could continue into 2021 until major cycles take over, and it ends. A move up to ~4500 is possible before the current bull market makes a final top and SPX corrects into its next major cycle low due in 2023.
SPX Intermediate trend: SPX correction underway.
Analysis of the short-term trend is done daily with the help of hourly charts. They are important adjuncts to the analysis of daily and weekly charts which determine longer market trends.
Correction Underway –How much?
Cycles: Looking ahead!
7-yr cycle – Last lows: 2009-2016. Next low: ~2023
Market Analysis (Charts, courtesy of StockCharts)
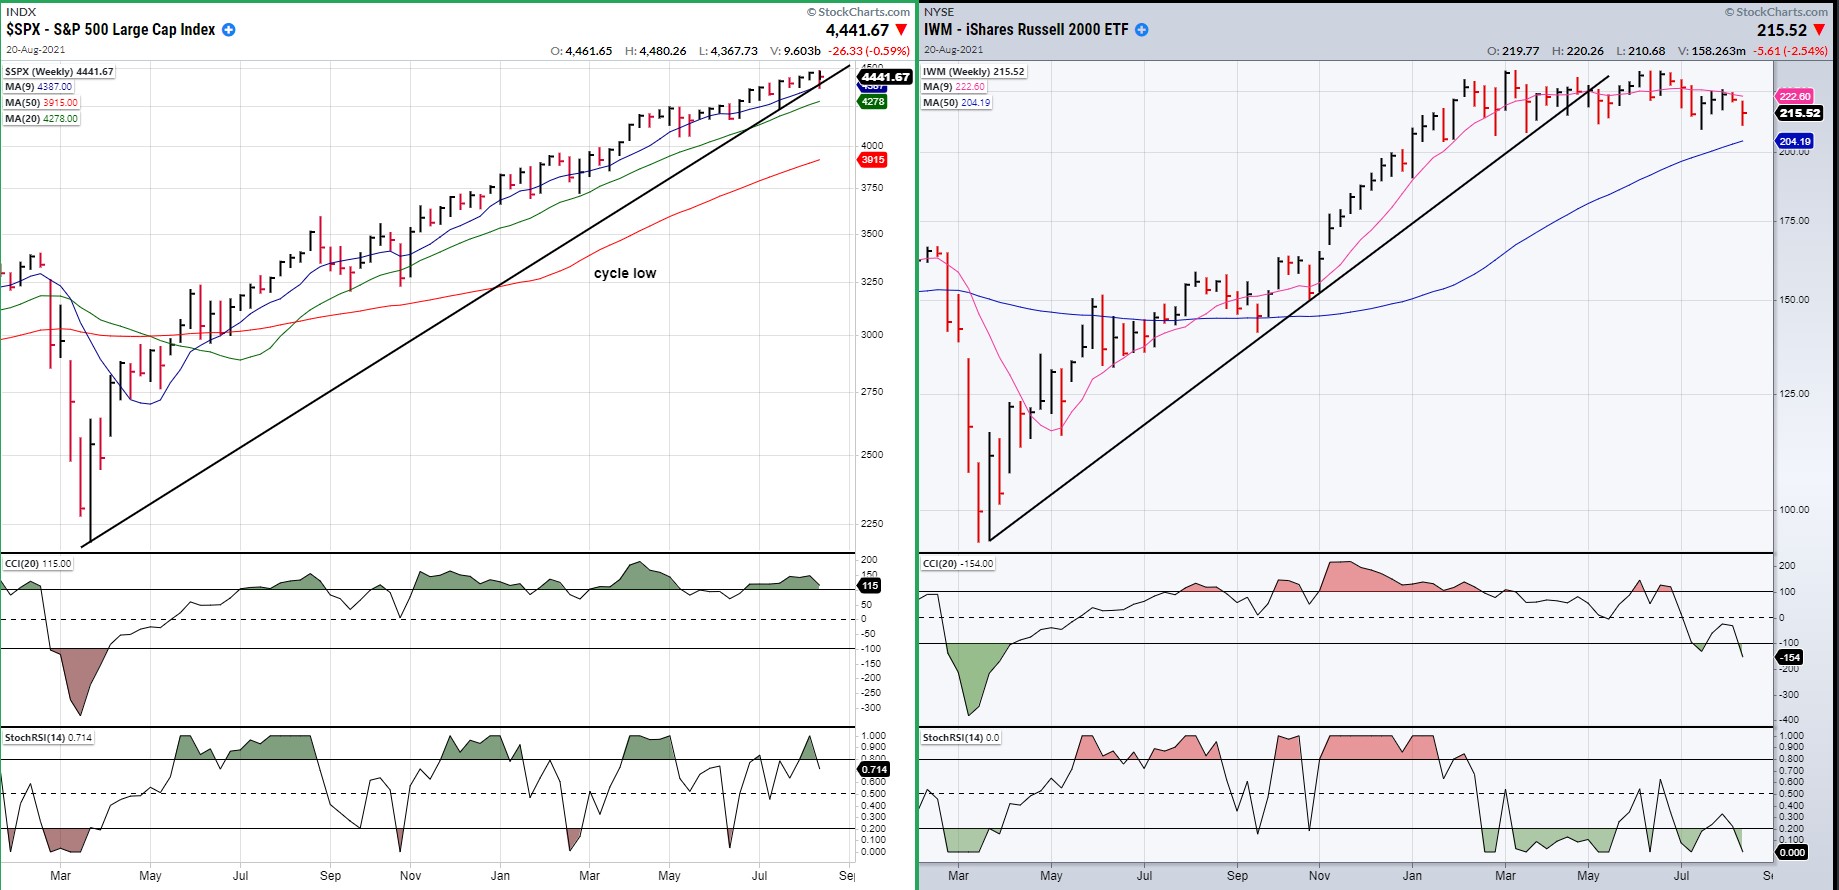
SPX vs. IWM (comparison and warning)
Last week I compared the weekly charts of the SPX and IWM and concluded that SPX was due for a correction especially since it had reached a P&F phase projection to 4440 which received a last-minute review to 4480. Last Monday (8/16), after touching 4480, SPX quicky underwent a 112-point correction down to 4368 before retracing about .618 of its decline to 4444 by Friday. On the weekly chart, last week’s price action does not look very impressive, but judging by the disparity which exists between the two weekly charts, we can probably conclude that the correction is most likely not over. Other factors which will be explored later also suggest this, but for now, our concern is focused on what kind of a longer-term correction we can expect in this very overbought market. And is that what the action in IWM is warning us about? Probably! There are two good reasons – besides what we see when we compare these charts – to expect more than a short-term correction. The first is that we are fast approaching the long-term P&F projection of 4550 that was created by the March 2020 low, and second, that we have a 7-year cycle low which is scheduled for (ideally) early 2023. But what can we expect of the near-term?
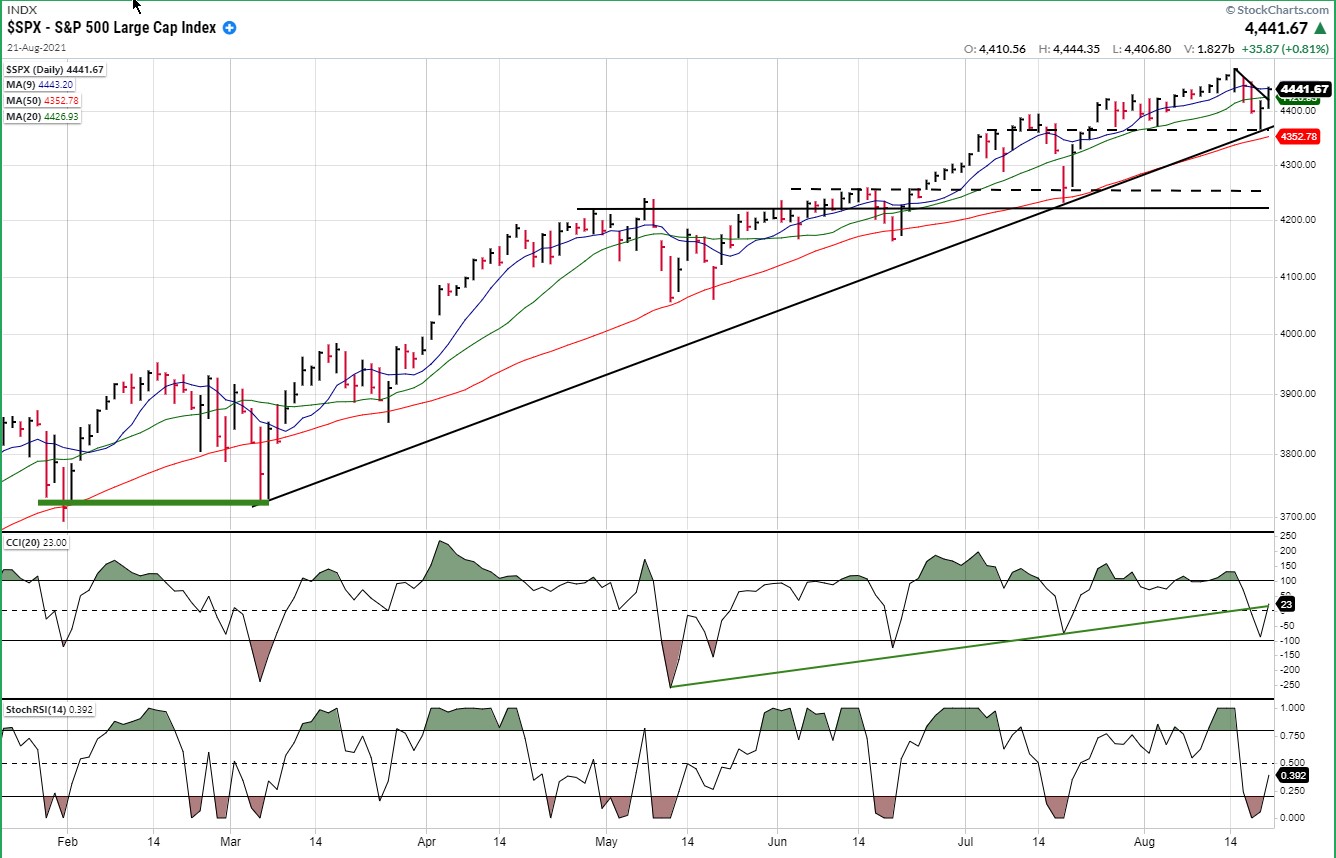
SPX daily chart
The first phase of the decline found combined support of the trend line from the bottom of the phase that we deem to be presently correcting, and also from the previous short-term peaks which normally provide support as, in this case, they already had on previous occasions.
The reason for drawing the uptrend line from 3753 on this chart is because this is where the next market phase started after creating enough accumulation on the P&F chart to take us to the 4440-4480 area, which is where the SPX went before running into the current selling spell. So, how much of a retracement can we expect at this time before the next rally? That will depend on a couple of things! The first, is whether the short-term cycle which has been producing short-term corrections in the market on a regular basis has already failed, or if it has simply extended. If it has already failed, then the current correction should extend until about the middle of next month. If it has simply extended, then the correction may already be over, and we could already be going to fetch the 4550-target.
Besides the fact there were technical reasons for the latest market correction, it also coincided with the release of the latest FOMC meeting minutes which probably spooked the market. Next Wednesday the Jackson Wyoming annual Economic Symposium will start, and you can bet that the markets will be waiting with bated breath on what is discussed during that meeting. We should therefore not have long to wait for the direction of the next short-term market move.
From a technical standpoint, the chart shows that price congestion has formed above the top dashed line. If prices break below it, that congestion will show up on the P&F chart as a level of distribution which should give us a downside projection for the next phase of the decline. Concerning the timing for the next low, if the short-term cycle has simply failed the next low could be expected to come around the middle of next month or a little later.
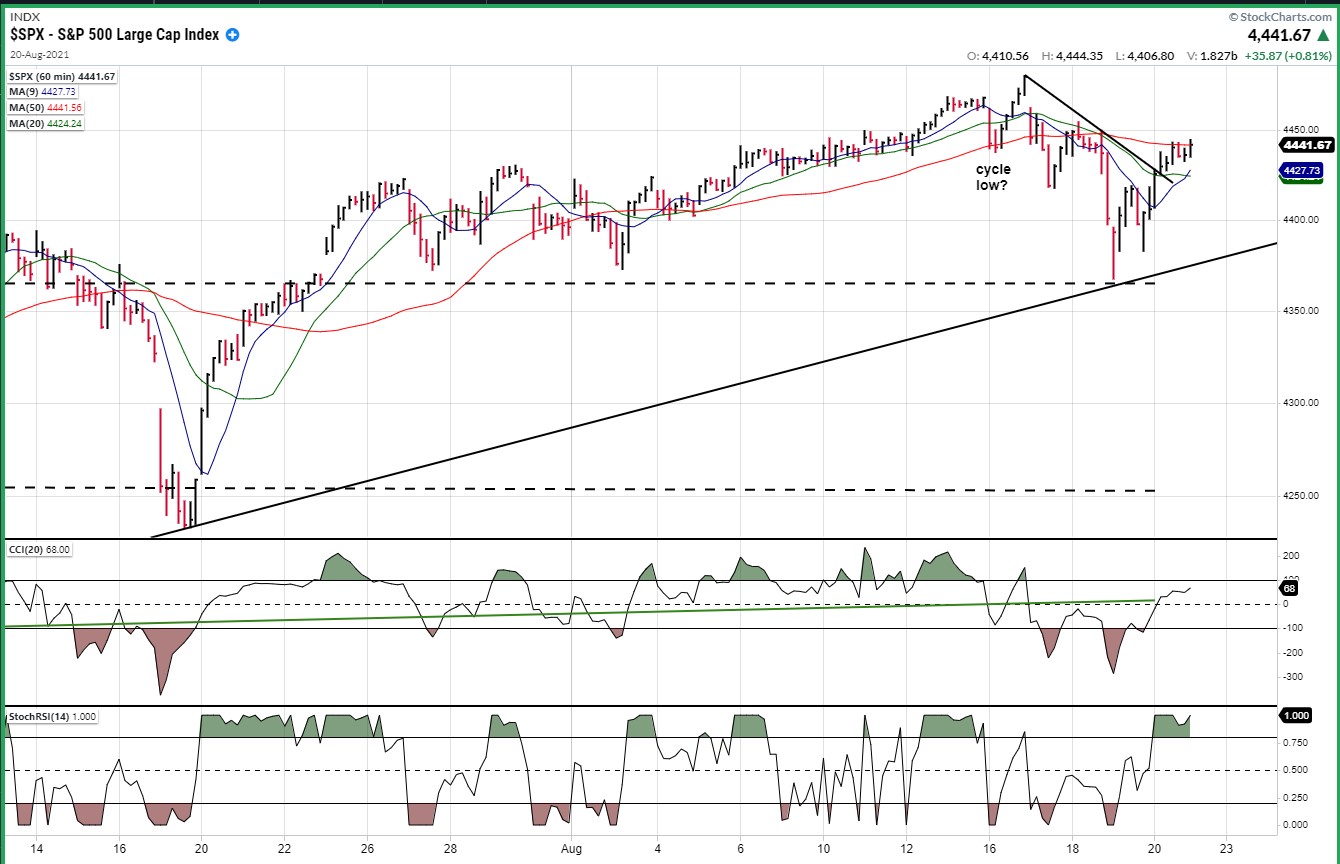
SPX hourly chart
The 60m chart of SPX below represents one phase of the short-term cycle which has been beating regularly in the market for the past many months. The question we need to answer is whether it made its low on time, where noted, or late. My inclination is that it made it on time and immediately failed. The reasoning is that at the time of the normal low, there was a little dip followed by renewed buying, creating a new uptrend which immediately reversed into a price decline bringing about a cycle failure. Another possibility is that a slightly longer cycle has taken over which could prolong the correction beyond the middle of September.
The rebound in prices after the initial decline has probably already reached most if not all of its recovery phase and the index may spend the next couple of days waiting for news of the Jackson Hole meeting, during which additional accumulation or distribution should take place in anticipation of what comes next. Should we move lower, there is already enough distribution in place to take prices down to the next support level in the vicinity of 4250.
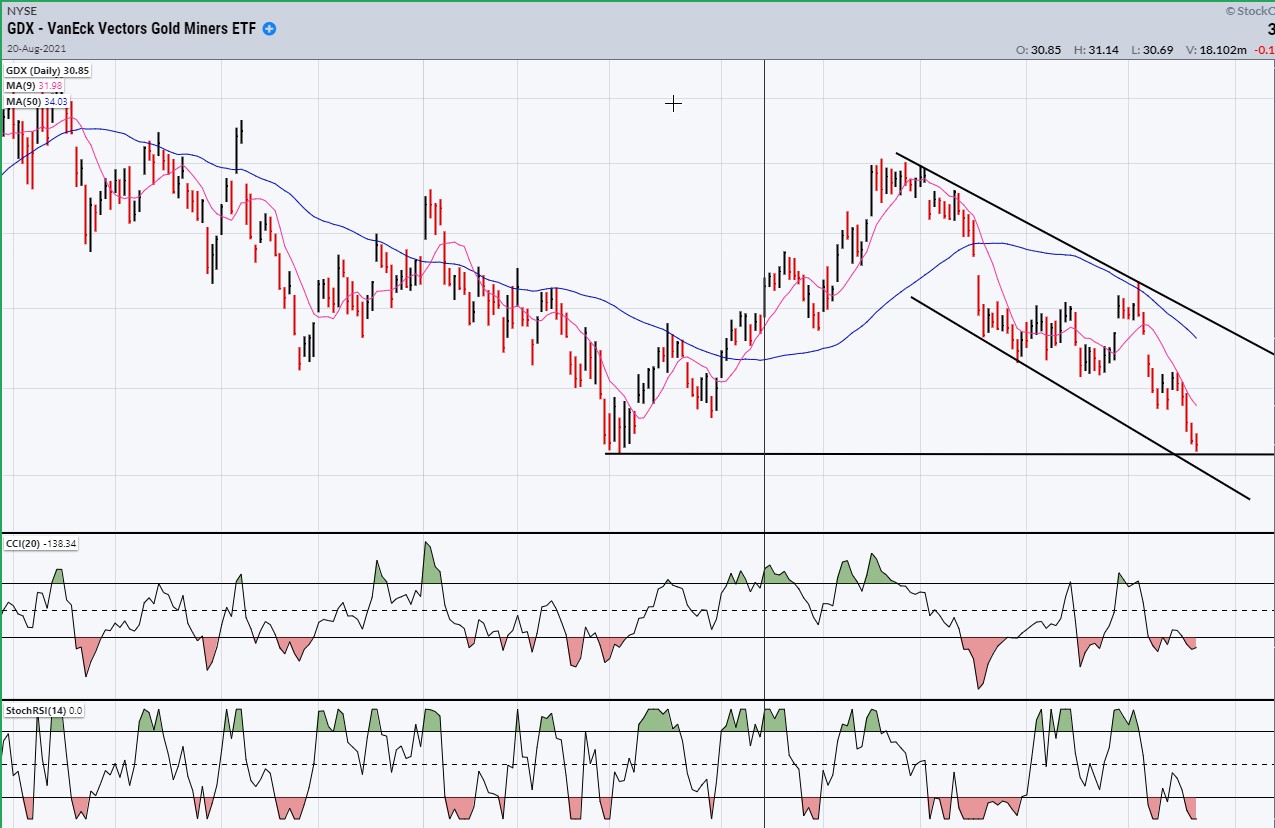
GDX (gold miners) (dly)
GDX has continued to decline down to its former correction low where it could find support, judging by the positive divergence which has formed in the CCI -- although this does not guarantee that it will stop the decline immediately. The next week or so will tell.
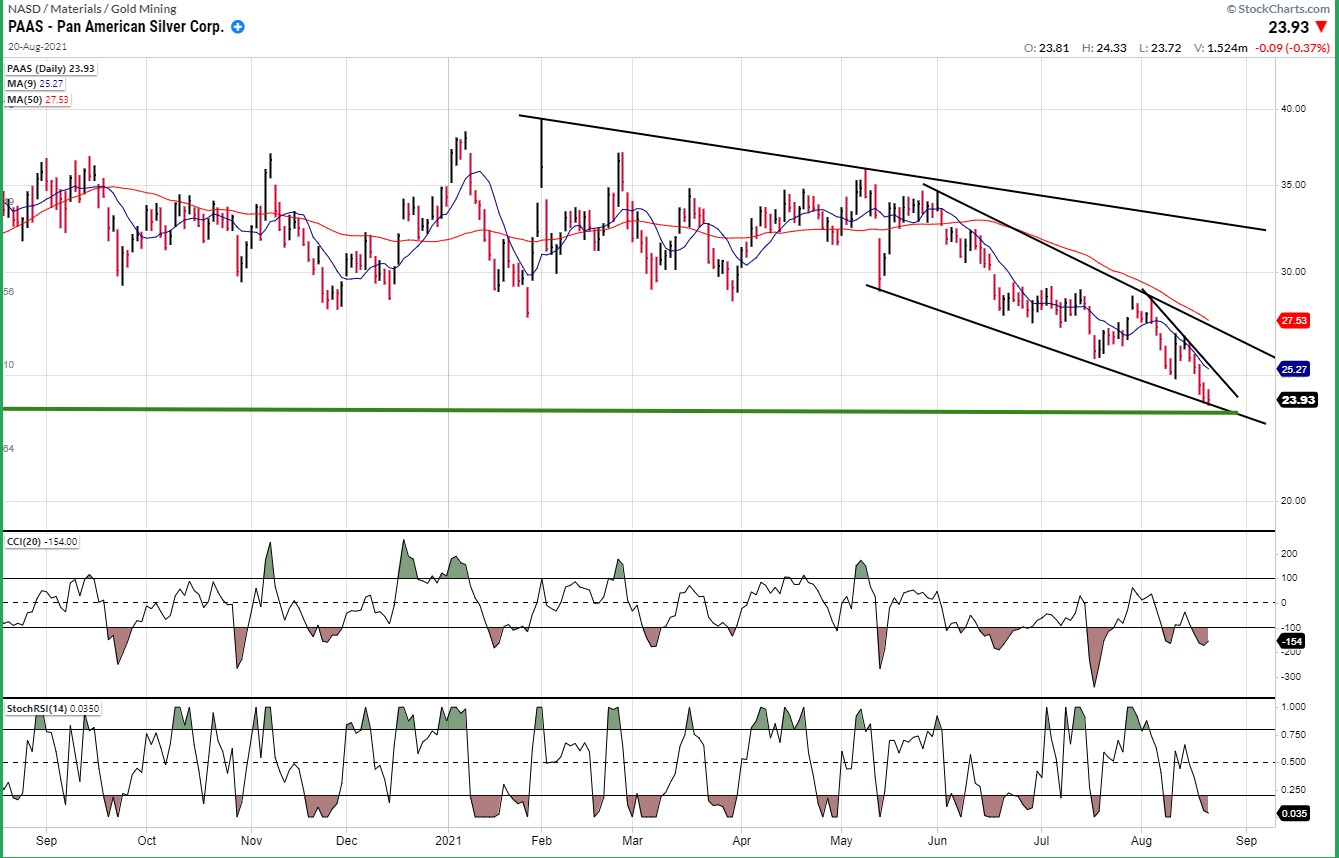
PAAS (dly)
PAAS has followed the same course as GDX and retraced to what should be a good support level after retracing a little over 50% of its rise from the March 2020 low. It too is showing positive divergence in its indicators which could denote some intention to reverse. It would find even better support if it retraced a full .618 of its advance.
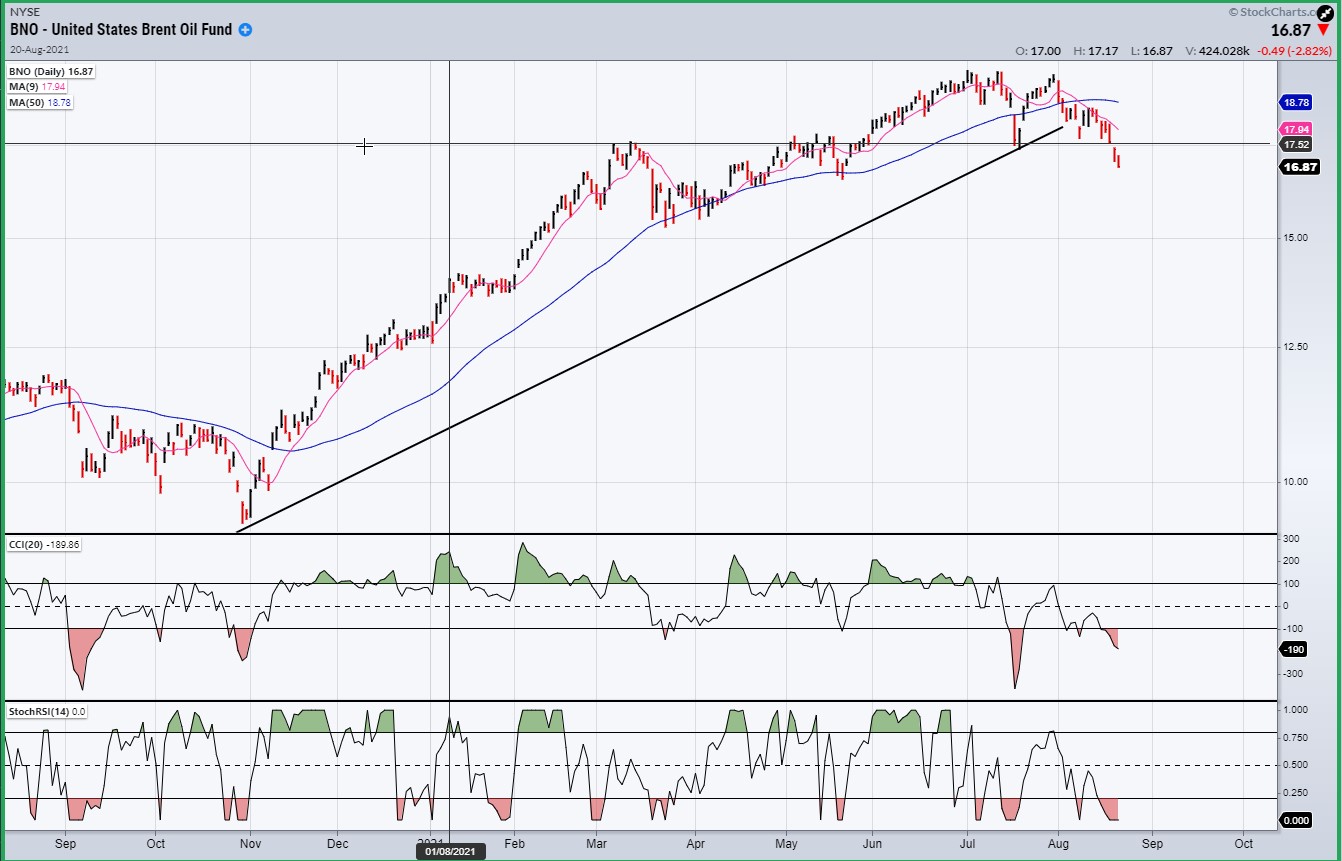
BNO (Brent oil fund) dly
As anticipated, BNO has started a correction which was presaged by a second daily close below its 50-dma. This should carry to at least 15 before it finds support.
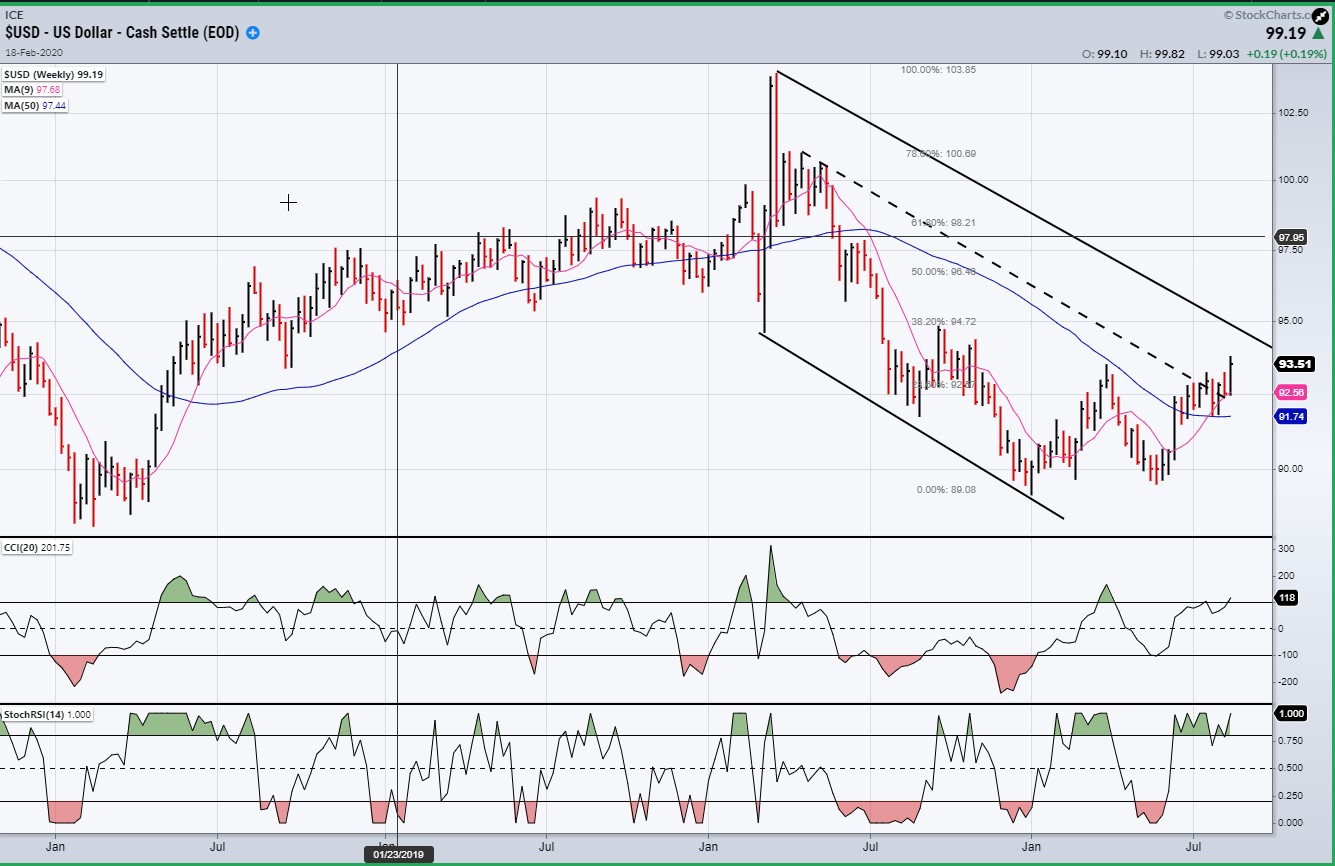
USD (dollar) dly
The $USD is also doing what was expected, pushing above its recent short-term resistance to challenge its corrective channel top. This should bring it to the 95-96 level before it finds resistance.
SUMMARY
SPX may have completed the b-wave of an a-b-c correction, the extent of which will be determined by whether or not it can hold above its initial short-term correction low of 4368.
“This is the strongest warning yet issued by IWM since the beginning of the March 2009 bull market. It should be heeded!”
Free trial subscription
With a trial subscription, you will have access to the same information that is given to paid subscribers, but for a limited time-period. Over the years, I have developed an expertise in P&F charting (price projection), cycles (timing), EWT (structure), and general technical analysis which enables me to warn subscribers of pending reversals in market trends, and how far that trend can potentially carry. For a FREE 2-week trial, subscription options, and payment plans I encourage you to visit my website at www.marketurningpoints.com.
The above comments and those made in the daily updates and the Market Summary about the financial markets are based purely on what I consider to be sound technical analysis principles. They represent my own opinion and are not meant to be construed as trading or investment advice but are offered as an analytical point of view which might be of interest to those who follow stock market cycles and technical analysis.
********

When Andre Gratian was a stock broker years ago, a friend introduced him to technical analysis of the market. Consequently, it is not an exaggeration to say that Andre fell in love with this approach! Ever since then, it has become an increasingly important part of his professional life. Gratian has studied the works of Wyckoff, Edwards & Magee, Edward J. Dewey (cycles) and many others. However, one of my most profitable undertaking has probably been to study Point & Figure charting, which he finds invaluable in analyzing stocks and indices. If he were restricted to one methodology, this is the one that he would choose. This well-rounded background has given him what he feels to be a special insight into the stock market, facilitating the recognition of meaningful patterns and the ‘turning points’ in all trends, whether they be short or long term. Andre feels very comfortable discussing the stock market and passing on meaningful information to others. His subscribers include individuals and money managers throughout the world. Moreover, his Newsletters are currently published on several financial sites, here and abroad.


