Is There A Bear Market In Progress?


The SPX topped out one year ago, on May 20th, 2015 at 2134.72. One year has gone by…and the SPX has still not made a new high. Moreover, it could be many years before we reach that high!
The SPX chart below indicates why it is not making any new highs and why a trend change is due any day, now!
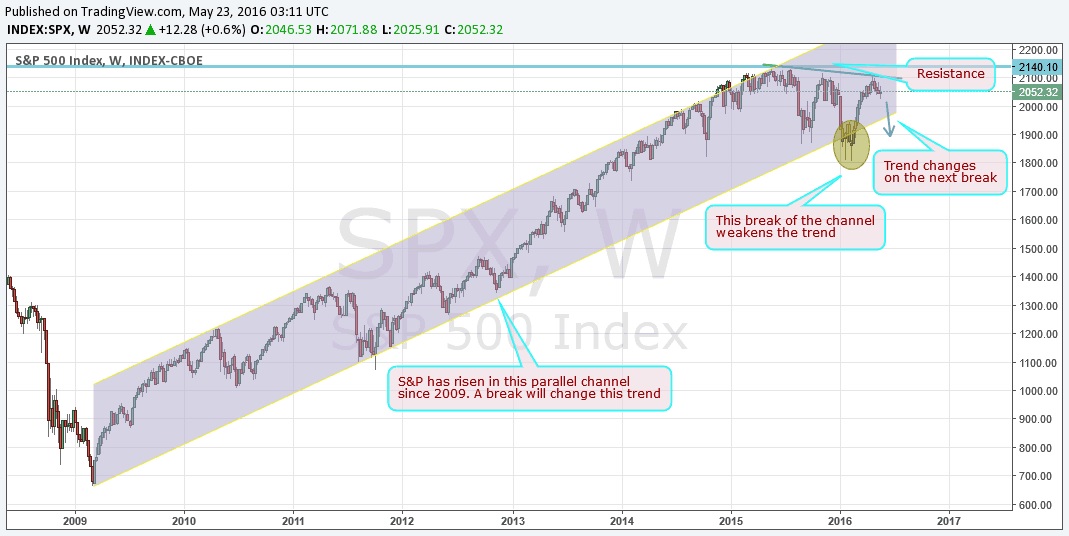
From the lows of 2009, the SPX has risen in a parallel channel while never breaking/closing below it with the exception of the beginning of this year at which time it broke down the channel and then closed below it. However, it has since recovered, as indicated in the chart below, however, it is facing significant overhead resistance in the 2110 levels.
There is a lower high formation during all of the pullbacks, after the corrections as can be viewed, in the chart below.
Whenever a long trending channel is broken, it weakens and the odds of a breakdown increases. The next move is the break of the channel which will change the uptrend into a downtrend.
Allow me to analyze what the targets of the long-term break of the uptrend are.
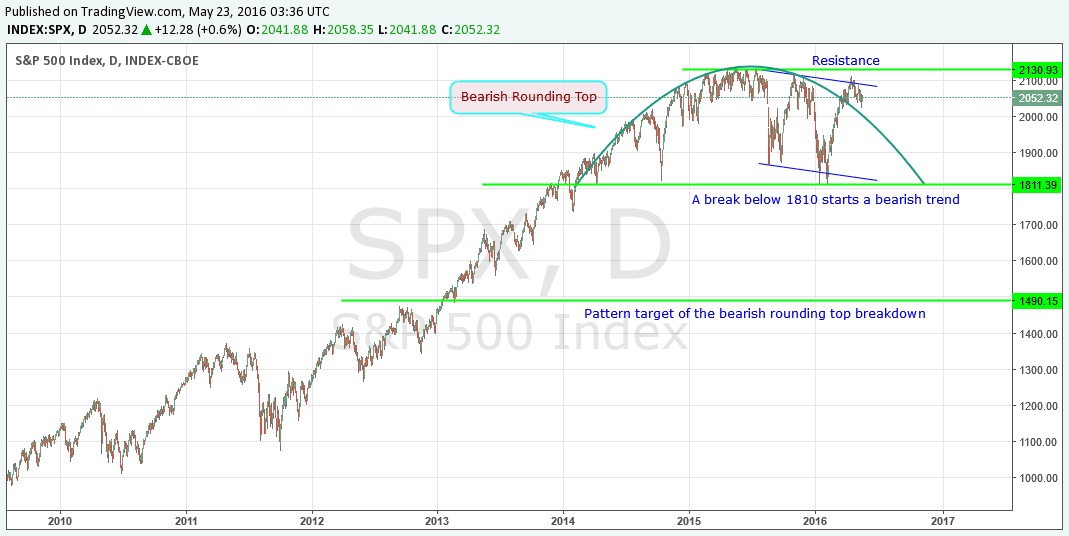
The pattern breakdown becomes confirmed below the 1810 levels. The break will form a pattern target of 1490 on the SPX. The targets usually overshoot in a bearish market, therefore, 1490 is merely a ballpark figure that the markets can go much lower while falling.
Along with a breakdown of the channel, the SPX is also making a long-term bearish rounding pattern as indicated, in the chart below.
The long-term chart patterns are negative, however, unless the shorter time- frame also becomes negative, a buy or a sell signal is not triggered.
Let's see what the short-term time frame chart patterns are suggesting!
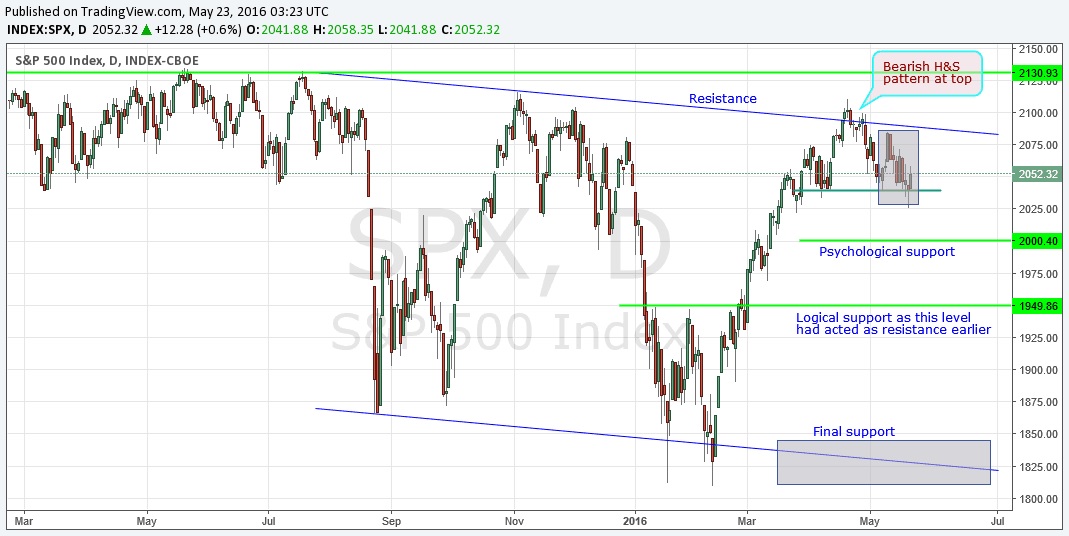
The short-term pattern shows a classic 'textbook' example of a bearish head and shoulder pattern as depicted in the next chart below.
The pattern will be confirmed when the SPX breaks and closes below the neckline at 2040.
Below the 2040 level, the next support level comes in at the psychological 2000 level. Most traders who have been buying the dips will buy close to this level, and I expect to see a bounce.
The professional traders will use any bounce off these levels to short the market to take advantage of its long-awaited downtrend.
The bearish head and shoulder pattern target, on the lower end, is located at the 1970 levels. However, these targets are only a rough levels for reference. The markets can easily overshoot these levels.
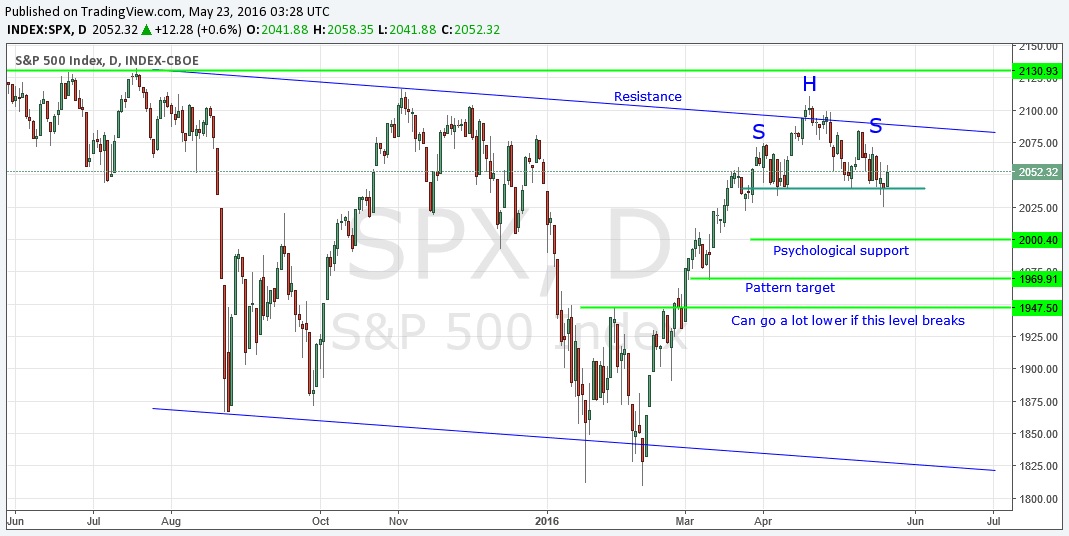
On the shorter time frame, there are various levels which can offer support during the next major decline.
As explained above, the 2000 level is a 'psychological support area' and 1970 is the pattern target. However, upon studying the charts, I can see that 1950 levels, which had earlier acted as a resistance, will now offer support.
If the markets break below the 1950 levels, then there is no support until it drops to the lows of 1810. Once the SPX breaks below the 1810 levels, it will enter into its' multi-year bearish trend decline. The markets do not honor any support levels once it enters a confirmed bearish trend! Hence, although 1490 is the target, markets can go much lower as long as the bearish trend continues.
I have provided all of the important levels which you should watch out for.
However, no pattern plays out exactly the way we expect it should, hence, it is important that you keep watching my daily morning video forecasts, as I will keep updating new breaking market trade set-ups, to subscribers.
This way you will see the latest changes on the charts and the accompanying action to be taken. Continue watching and be prepared to engage in this market, at the right time via my ETF trade alerts.
My cutting edge analysis will reveal all of the new twists and turns in all of the markets in which all of the big investment houses trade.
Get My Daily Video Forecasts & Alerts: www.TheGoldAndOilGuy.com

Chris Vermeulen has been involved in the markets since 1997 and is the founder of Technical Traders Ltd. He is an internationally recognized technical analyst, trader, and is the author of the book: 7 Steps to Win With Logic
Through years of research, trading and helping individual traders around the world. He learned that many traders have great trading ideas, but they lack one thing, they struggle to execute trades in a systematic way for consistent results. Chris helps educate traders with a three-hour video course that can change your trading results for the better.
His mission is to help his clients boost their trading performance while reducing market exposure and portfolio volatility.
He is a regular speaker on HoweStreet.com, and the FinancialSurvivorNetwork radio shows. Chris was also featured on the cover of AmalgaTrader Magazine, and contributes articles to several financial hubs like MoneyShow.com.


