Timing Gold Bottoms


The articles we wrote last week called for a critical week in Gold and that either a bottom would form or a capitulation phase might begin. Our service uses a combination of Technical and Cycle Analysis to time and call markets. Over the years we’ve found that precious metals rather consistently adheres to three dominate Cycles. Each Cycle has certain criteria that need to be met in order to qualify as Confirmed. My intent is not to bore you with all the facts and figures about the different timing methods but to rather illustrate how Cycle Analysis can help trader’s better time their market entries. I jokingly say that trading metals without using cycles is like being a carpenter without having a hammer.
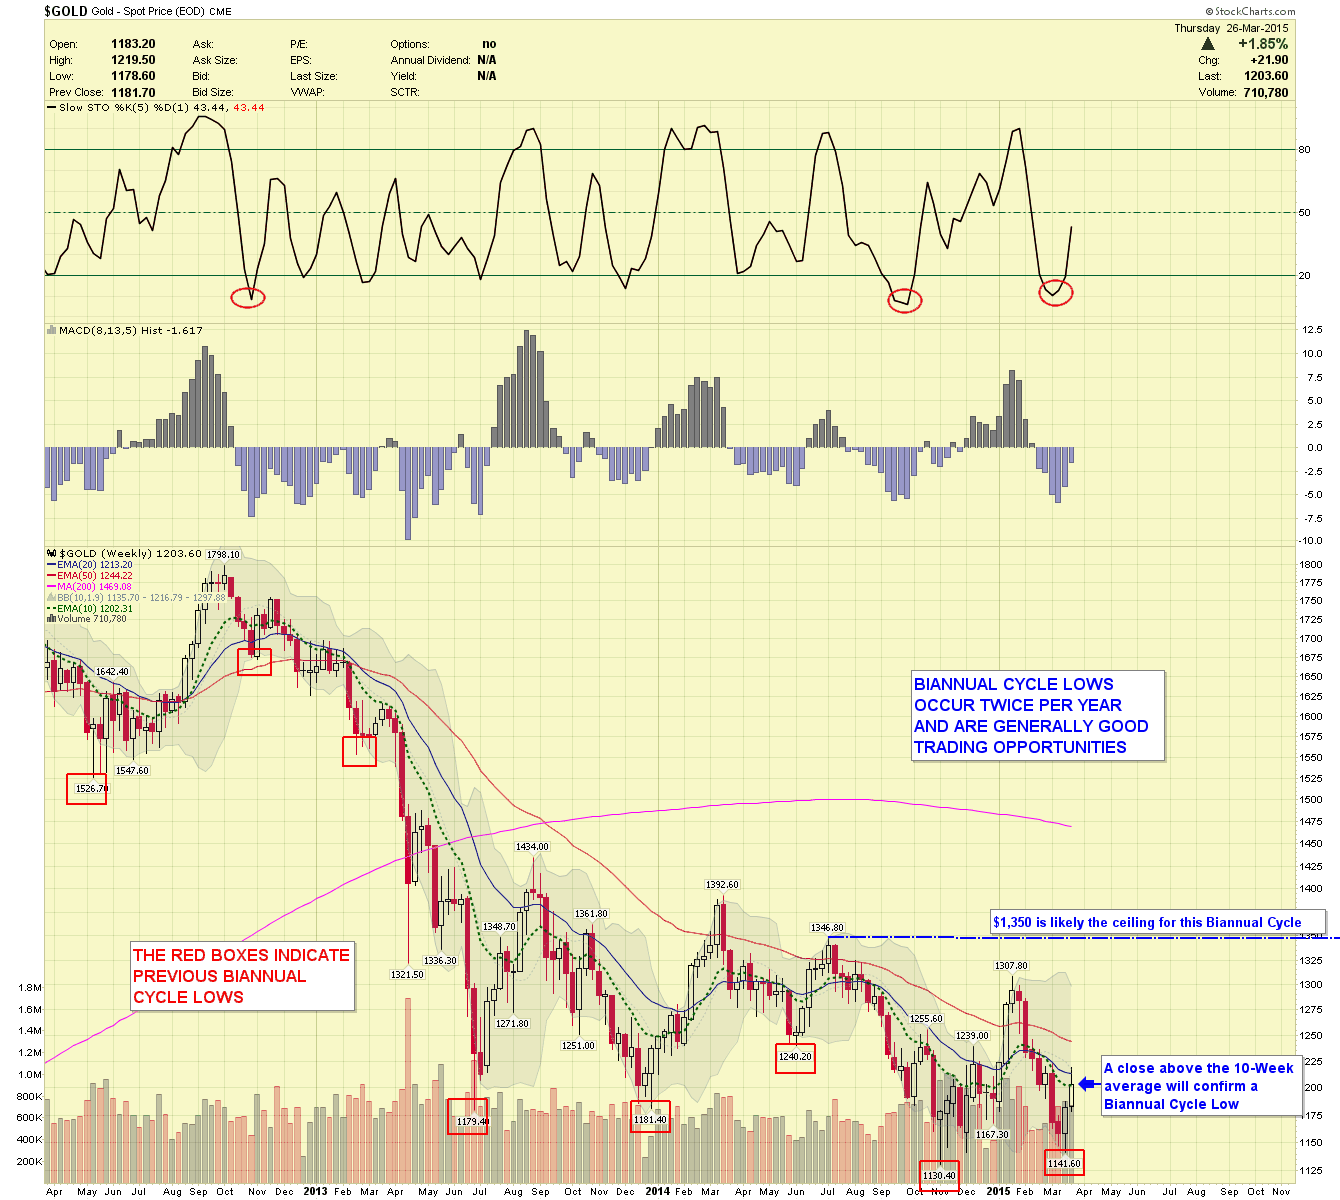
Biannual Cycle Lows occur twice per year and often prove to be decent trading opportunities, especially while in a Bull Markets. To find Cycle these Lows we use a timing model that focuses on a particular timeframe, when arrived we use benchmarks to confirm each low. Below we have attached some charts as a teaching and educational aids.
Gold Weekly Chart
In the weekly chart I pointed out several Biannual Cycle Lows over the past three years. As you can see, many were excellent trading opportunities. In order for the current Cycle to become confirmed low price needs to close solidly above the 10-Week moving average. Once confirmed we can give more accurate targets, but $1,350 will probably not be exceeded during this Biannual Cycle up.
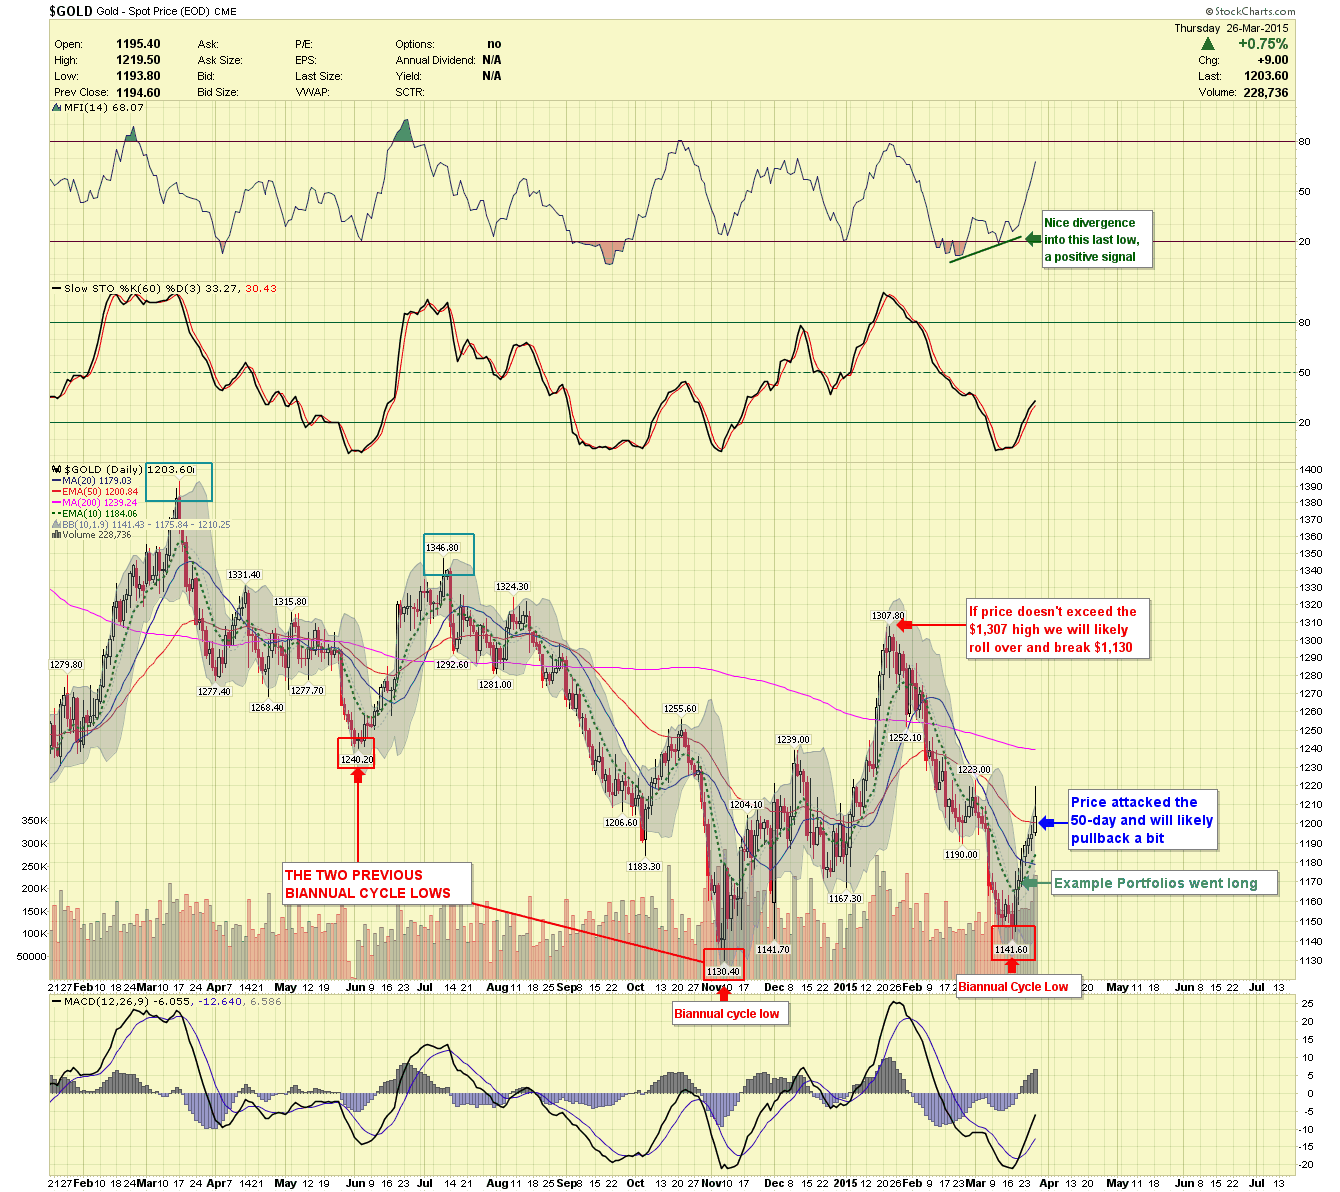
Gold Daily Chart
The Daily charts show price making an assault on the 50-day moving average recently, it’s not usually successful on the first attempt. We are likely headed for a pullback to digest the recent gains.
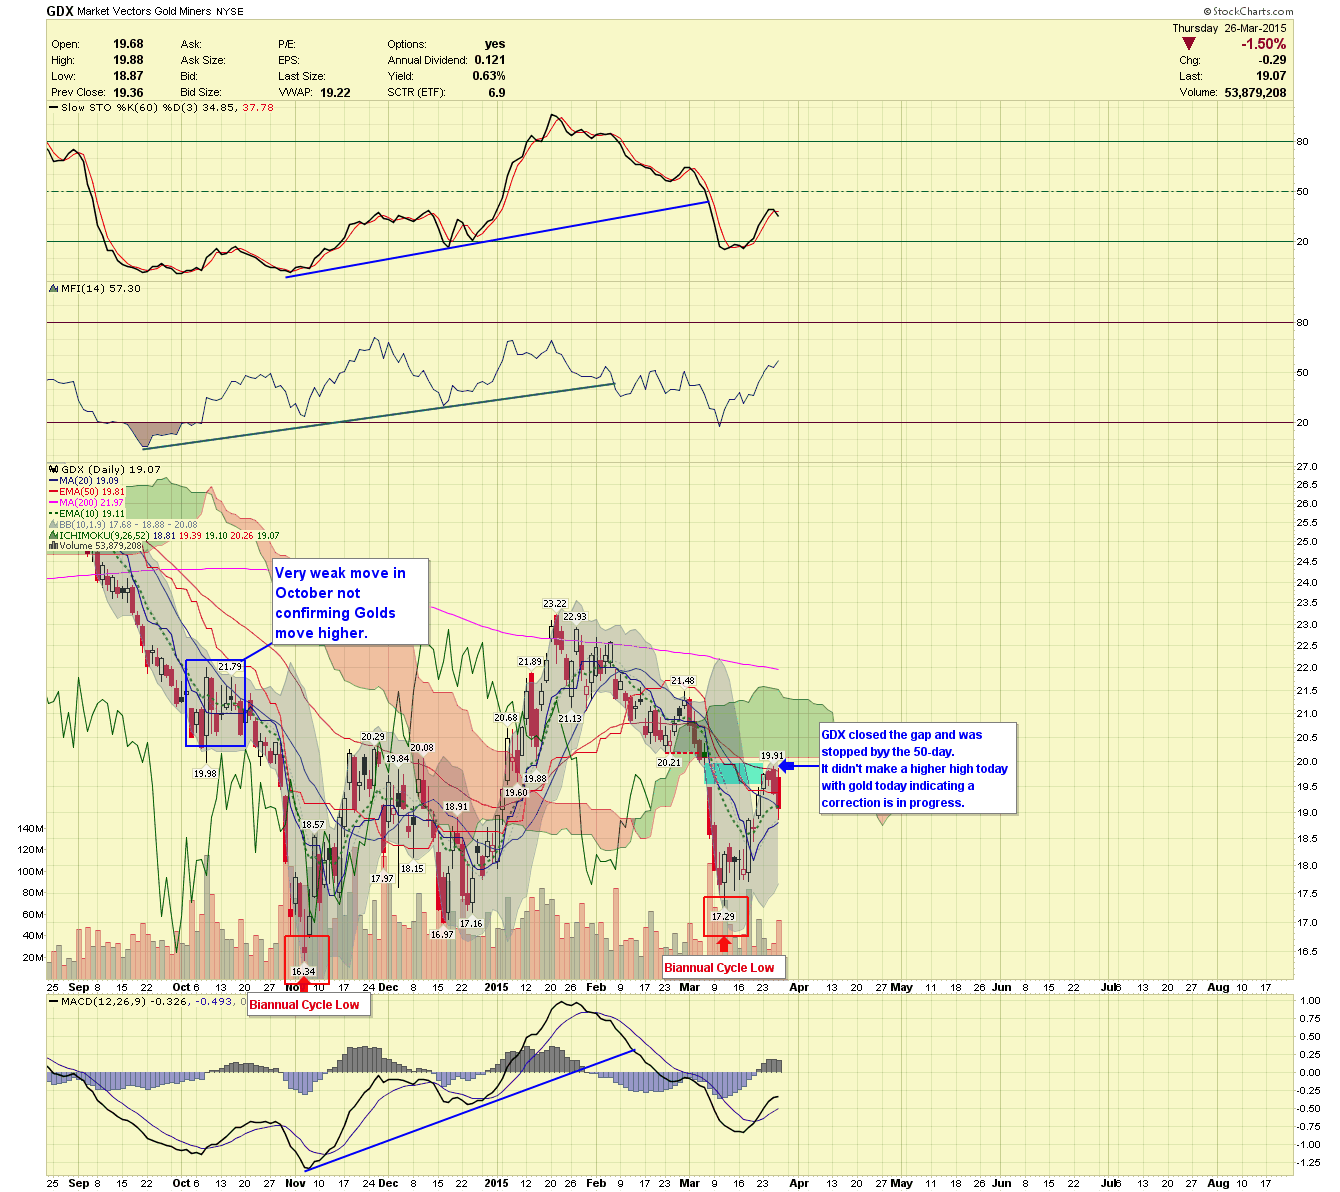
GDX Daily Chart
Price had a good run higher and stopped right where we expected. There was a confluence of resistance at the 50-day average and an unfilled gap. Price almost to the penny filled the gap and began its move lower. Even though Gold was higher, the miners refused to make a higher high and because of that we took out protective put options for our GLD holdings in the Example Portfolios today.
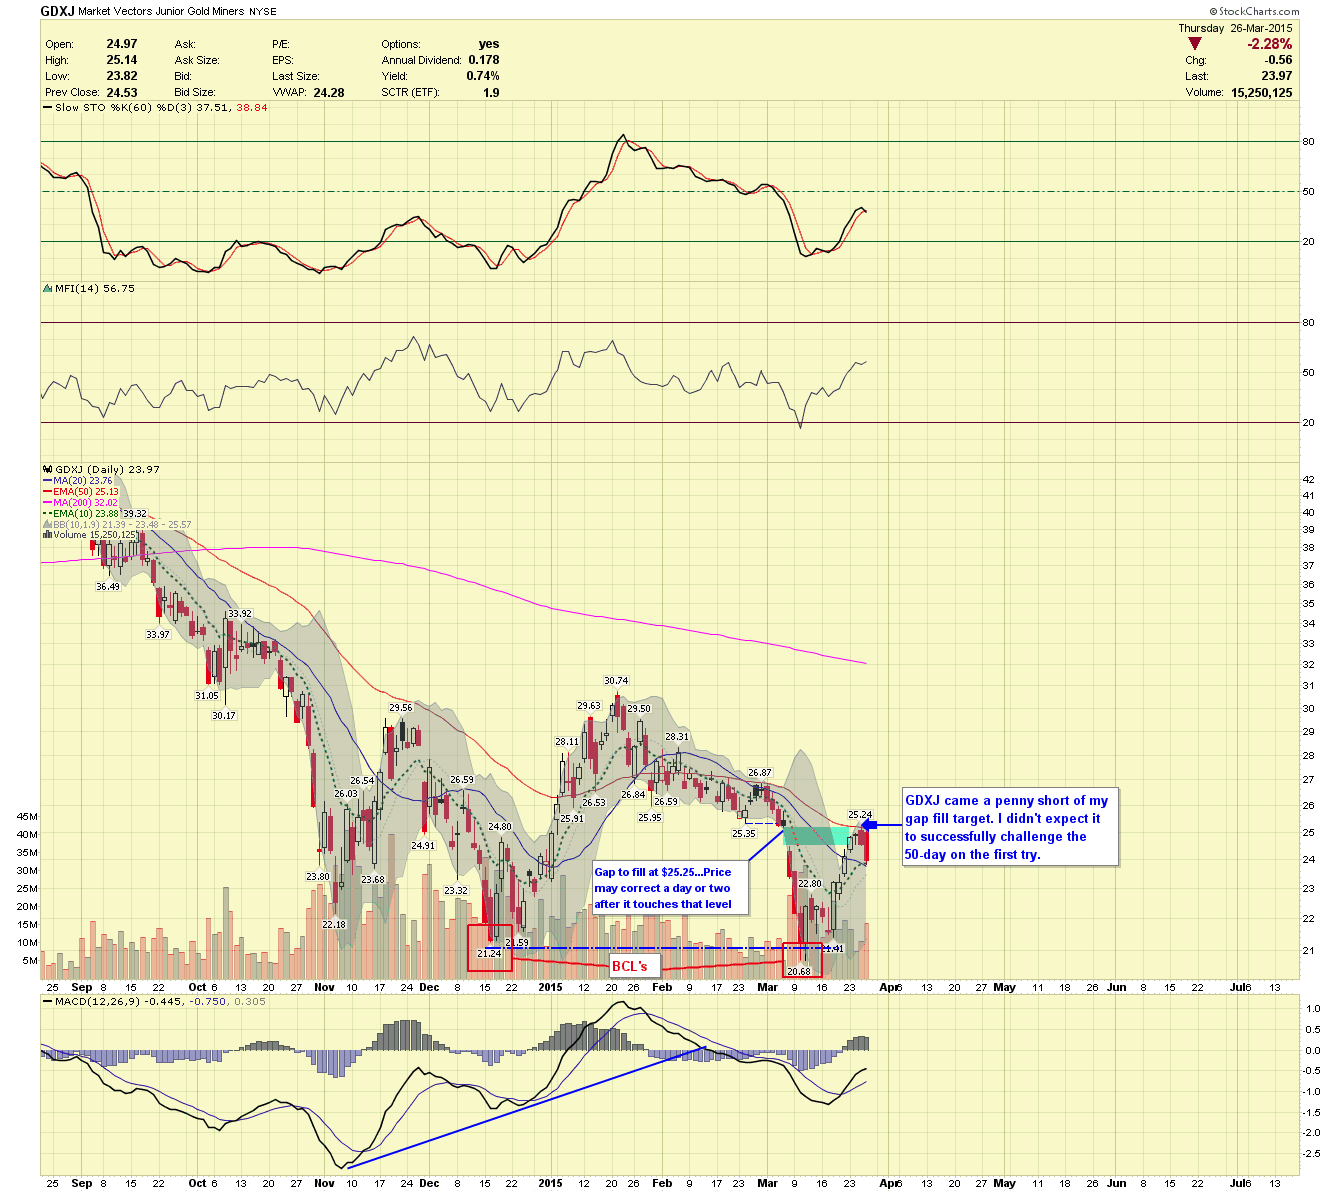
GDXJ Daily Chart
Near identical to GDX touching the 50-day and just missing the gap fill by one penny. Once the correction subsides we will have better ideas for targets.
The Example Portfolios will sell the put insurance and add to longs when it looks like the corrections have ended. Please visit us for a 14-Day Free Trail to our Basic Plus Newsletter service.
We are offering a 14 Day Free Trial to our Basic Plus Newsletter, released every Sunday, Tuesday and Thursday.


