Two Flies In The Ointment: EP & Barron’s CI


Barron’s has published U.S. electrical power consumption (EP) since their 05 Aug 1929 issue, just weeks before the stock market crash of October 1929. Regrettably this means EP’s 52Wk moving average, a vital series in my work, doesn’t begin until August 1930; almost a year into the Great Depression. So, EP’s decline during the Great Depression seen in my charts is based on incomplete data – its decline during the early 1930s was even deeper than the -17.32% seen a few charts down. To understand just how profound an economic contraction the United States experienced in the early 1930s, the 2008-09 credit crisis economic contraction resulted in a reduction in EP of only 4.73%; and everybody felt the fear of it.
Tracking EP provides an excellent instrument with which to measure the economy’s expansions and contractions, as all changes in commercial and industrial activity impacts the electrical grid. Importantly, EP is measured in kilo-watts (an engineering unit of measurement), not the dollar; an undefined unit of accounting with which much mischief is done in economic reporting for inflation, GDP and even prices in the financial markets.
Below is a chart of Barron’s 4,426 weekly published values of EP; the blue plot displays the actual published values while the green plot is their 52 Wk M/A. I use a 52 Wk M/A to filter out EP’s seasonal factors, which from 1929 to 1950 were almost nonexistent. Beginning in the 1950s, EP began developing seasonal spikes as air-conditioning became fact of life; first in theaters, offices spaces and shopping centers. These spikes became more pronounced in later decades when residential air-conditioning became almost universal.
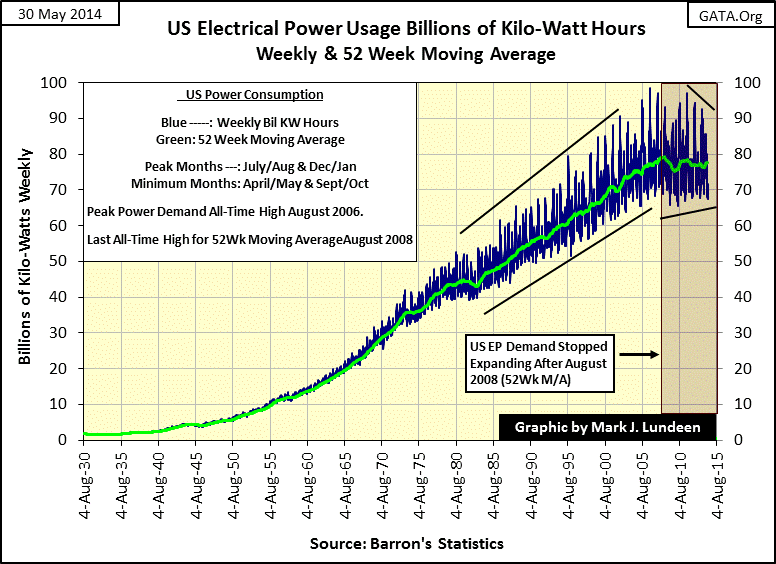
This makes EP seen above a darn good measurement of “global warming” for North America. Eight years ago in August 2006, U.S. EP saw its last all-time high peak; the summer of 2006 must have been a hot one. Since then seasonal demand for electrical power during the summer has declined, most likely for reasons of “global cooling” in North America. I have a trend line over the past three summer’s peaks in the chart; 2011 was less than 2006, and 2012 & 2013 continued the trend. So far in 2014, the Upper Midwest is three weeks behind the season if you can believe my local meteorologist, which I do as I have only turned on my AC this week which is unusual this late into summer.
The growth in EP over the past nine decades is an American success story of free market enterprise in the face of growing government interference in the economy. Today, there is an alphabet soup assortment of government bureaucracies that monitor business, usually begun with the best of intensions to achieve a purpose that you and I may even agree with, such as the Environmental Protection Agency (EPA). But after a few decades, government bureaucracies always grow larger and more intrusive in the lives of people and businesses. That is certainly true for the Federal Reserve, a giant banking monopoly created by congress in 1913 that should have been legislated out of existence in the 1930s for causing the Great Depression.
The chart below plots the indexed values of growth for EP and Currency in Circulation (CinC) since 1930. In the past eighty-four years EP has grown by a factor of 44 while CinC has increased by a factor of 341. Ask any central banker if inflation is good and they will absolutely say no; but here it is – since the US negated the dollar’s Bretton Woods $35 gold peg in 1971, inflationary increases in the volume of US dollars in circulation has far outstripped any economic justification for the increase in the money supply seen below.
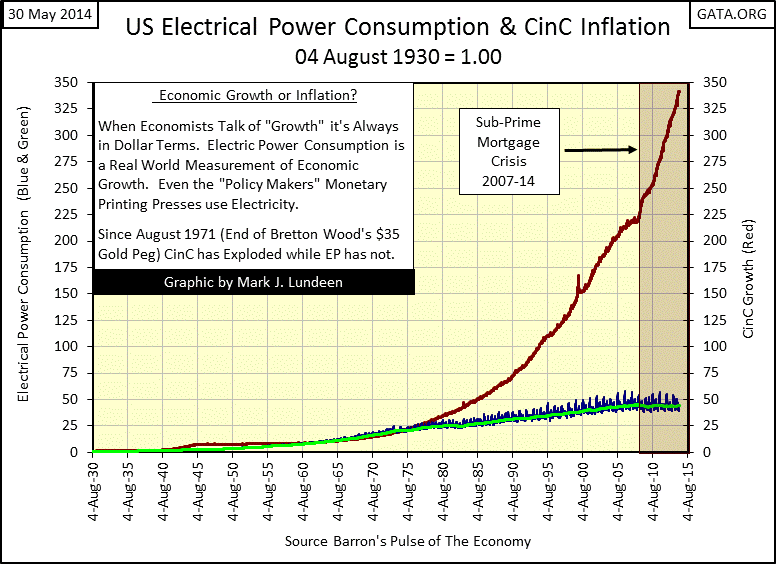
Why do they do this? Well politicians in Washington, the people who created and maintain the Federal Reserve, like to spend money and bankers like to create credit in excess of what a dollar pegged to gold could provide, so the Federal Reserve provides them with all the money they desire. The flip side of this is that citizens have to service the debts created by Washington with their taxes as well as service their own bank debt with their wages. And everyone everywhere have been forced to support the actions taken by the Federal Reserve by paying higher retail and energy prices as a result of the monetary inflation seen above.
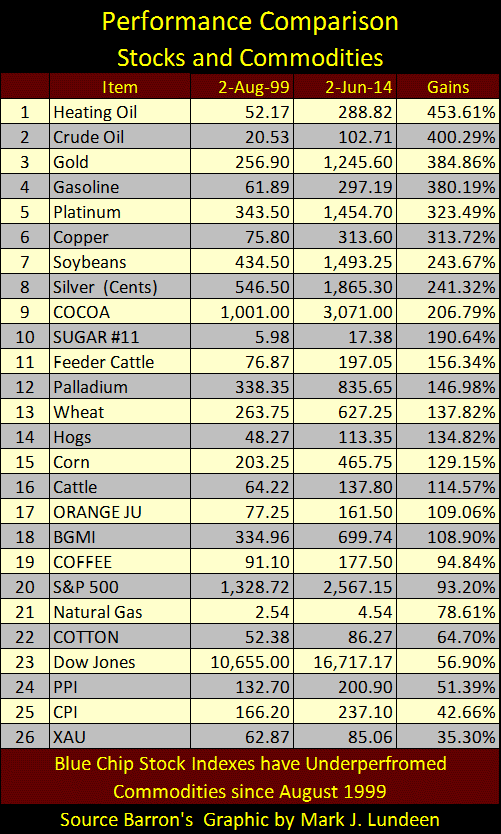
Here’s a table listing percentage gain since 1999 of key commodity and stock indexes. The best performing stock index is #18; the Barron’s Gold Mining Index (BGMI). The Dow Jones (#23) has only exceeded CPI (#25) and PPI (#24) because the government publishes bogus inflation statistics as well as supporting stock market valuations with massive-inflationary stimulation. But look at what is going up in price; energy, precious and base metals, as well as basic agricultural items. The increase in basic commodity prices is now a long established trend that will continue for the foreseeable future. You have to be stuck on stupid to believe in the U.S. Department of Labor’s CPI & PPI statistics.
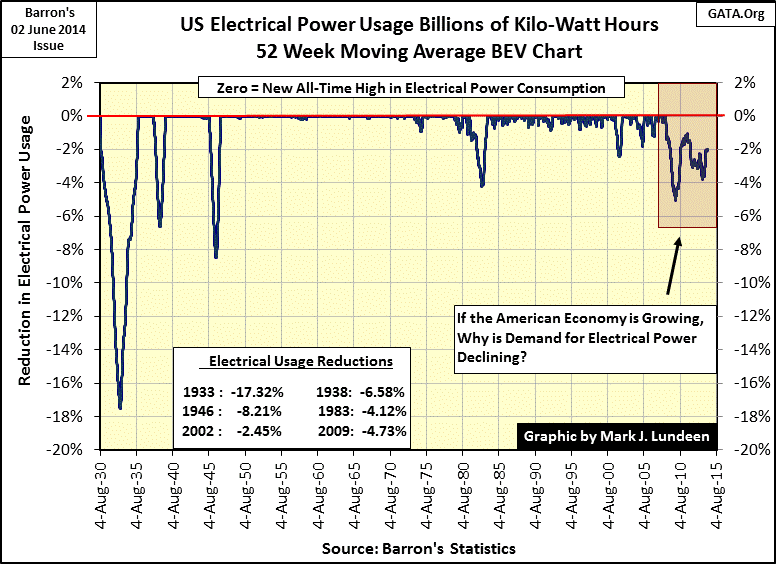
The one thing the Federal Reserve has proven it can’t do by inflating the money supply is to actually “stimulate” the economy. Since the High-Tech Bubble popped in January 2000, CinC has more than doubled while EP’s 52 Wk M/A has increased only 16.64%, and since August 2008 EP has actually declined by 2.04% in the face of the Federal Reserve’s massive QE program (Red Boxes in charts above & below).
The current decline in corporate-bond yields is fascinating and worrisome. The world’s economy has become bloated with debt provided by central banks. American corporations have taken full advantage of the current low interest-rate environment and ample credit provided by the Federal Reserve to trash their balance sheets by issuing ever more bonds to raise cash to fund their share buyback programs. S&P’s Capital IQ data reported that in the first quarter of 2014 the largest purchasers of shares were the companies themselves. Decades ago the financial markets would have never rewarded such reckless behavior with record high share prices and near decade low bond yields, but in 2014 that’s how the world works – at least for now.
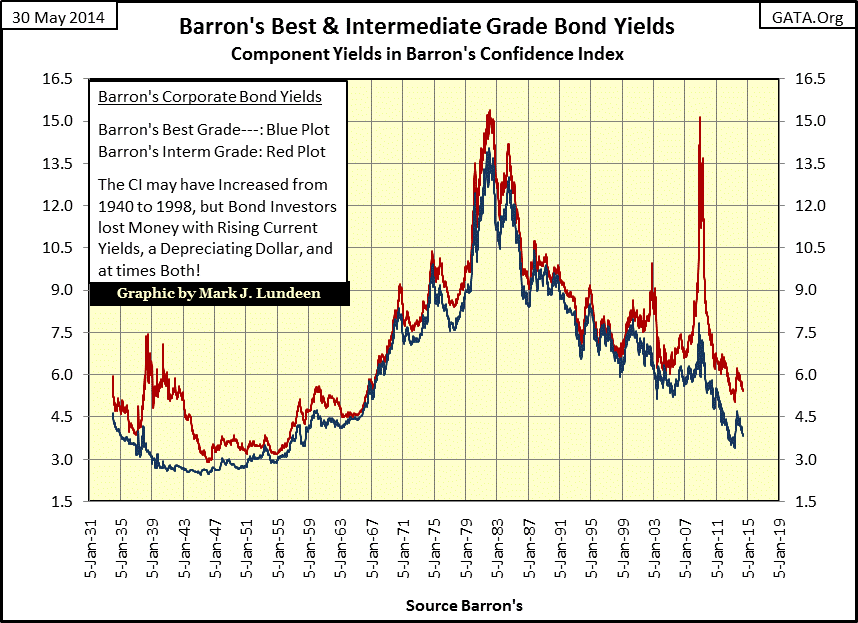
However, Barron’s Confidence Index (CI) below is flashing a warning of impending corporate debt default. It’s impossible to predict when the crisis will strike, but CI has been declining since June of last year and this week it broke below 70 (69.9). This trend is no one’s friend.
I began compiling CI data in the early 1990s, one of Barron’s antique data series popular many decades ago with pre-Vietnam War era investors that had lost its appeal to the baby-boomers, a generation with no personal memory of the Great Depression. During the Greenspan-bubble market, serious concerns of repeating the monetary mistakes of the Roaring 1920s that resulted in the Great Depression were the last thing on anybody’s mind, and you can see this complacency in the CI below (2nd Red Box).
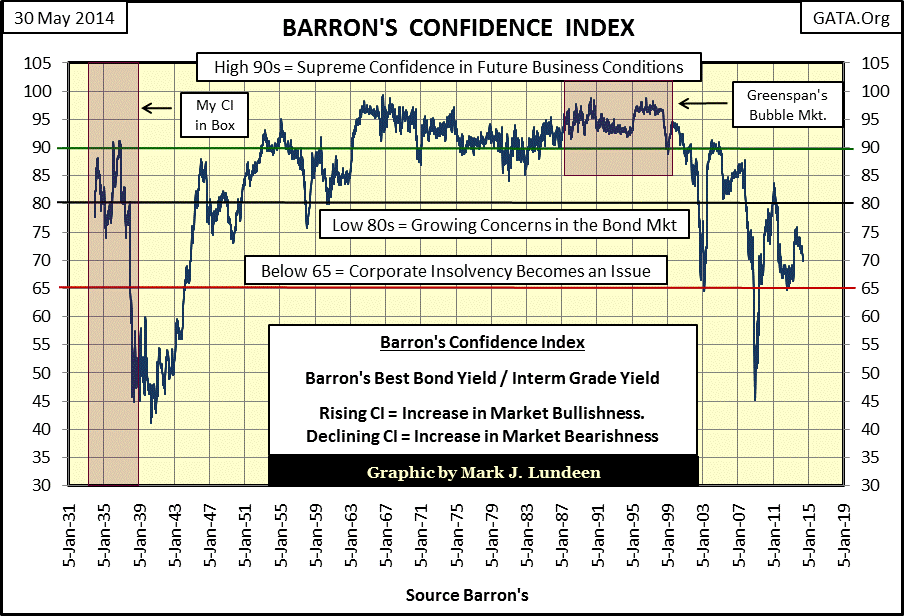
Since the market bubble popped in January 2000, CI’s market narrative has changed from one of unbridled euphoria to increasing concerns in the bond market of a repeat of the depressing 1930s. I take the CI’s post 2000 decline very seriously, as the bubbles inflated in the financial markets, and the horrendous levels of unpayable debt borne by all levels of society, are byproducts of the Greenspan and Bernanke Feds’ reckless inflationary monetary policies. Our world isn’t a place in the galaxy that allows fools to party hardy without having to pay the fiddler when the liquor runs out.
Today, there are few people around who have personal memories of the Great Depression. Those centenarians that do still have seared into their memories how humbling the Great Depression was with its liquidation of the credit excesses the Roaring 1920s generation confused for wealth. Eighty-five years ago, Mr Bear put the FEAR-of-God into arrogant politicians, bankers and academics that stayed with them to the day they died. Sadly for us, these people are now all gone. Corporate management today is staffed with a highly educated class of executives, people who have no fear of burdening their companies’ balance sheets with massive debts to purchase their company’s shares in the open market to drive share prices up. This is true too of government regulators, who also have no personal experience of the Roaring 1920s, or the depressing 1930s. Armed with impenetrable ignorance, the SEC and CFTC regulators stand by and do nothing as people in positions of trust abuse their offices for reasons of personal gain.
We’d be coming out of another Great Depression right now with an economy freed from the shackles of decades of ill-considered debt creation, had the “policy makers” not bailed out Wall Street in 2009. The “best and the brightest” instead chose to reflate the bubbles in the financial markets with massive “injections of liquidity.” To most people, the government’s response to the mortgage crisis was completely reasonable. But this belief is only possible by ignoring the fact that the mortgage crisis was the inevitable conclusion of decades of government interference in the housing market using their Federal Reserve to finance the mortgage market with inflation.
“The Housing Act of 1954 will turn out to be one of the worst pieces of inflationary legislation ever placed on the statute-books. For the first time, non- veterans will be able to buy a $10,000 house with a down payment of $500, the Federal Housing Administration insuring a 30-year mortgage of $9,500 on such a house. This is a triumph of the Nation’s Home Builder’s Association and a defeat of commonsense. Unfortunately, there is no reason to hope that mortgage money lenders will resist the practical consequences of this legislative monstrosity. Throughout the’ first half of’ 1954, most of them have been eager to make VA mortgage loans to home-buyers at no down payment at all.”
- Barron’s The World at Work, 05 July 1954, Page 7
Many homes that sold for $10,000 in 1954 saw their valuations inflated to well over $250,000 during the mortgage debacle, and now the dudes at the Federal Reserve’s Open Market Committee are having some success in getting home valuations trending upwards again. But the failure of EP’s 52Wk M/A to reach a new all-time high since 2008 (six years) and Barron’s CI continued decline towards an unthinkable sub-65, suggests that the “policy makers” are coming up short in achieving true economic stability, let alone actual “economic growth.” In a world pregnant with counterparty risk, investing in gold and silver at todays subsidized low prices seems the prudent thing to do.


