Unlocking Gold’s True Value: The Economic Code – Finally Revealed


The true value of gold is much higher than the spot price quoted in the market. This is due to several factors, but the most important reason is misunderstood by just about every economist and monetary scientist in the world today. Those who are able to understand the information in this article, will finally be able see the value of gold (money) in a totally different way.
It has taken me years of research and reflection to understand GOLD’s TRUE VALUE. Unfortunately, the majority of economists and precious metal analysts look at gold in a very specialized way. While precious metals analysts see gold as real money versus the Keynesian view of a Fiat Dollar System, both fail to grasp gold’s true value.
Gold is more than a precious metal based on supply and demand. Furthermore, the Austrian School of Economics looks at gold as a foundation of money in the procurement of goods and services. However, gold’s real value comes from energy in all forms and in all stages in its production
I am going to repeat it one more time…. gold’s real values comes from ENERGY in ALL FORMS and IN ALL STAGES in its production.
I have been saying this in interviews and writing about it for years, but I still believe a lot of people just don’t get it. So, now I am going to break it down in a simple chronological way.
The Foundation Of Gold Money: ENERGY = GOLD = MONEY
To understand this principle, I have decided to use one of the largest gold producers in the world as an example, Newmont Mining.
According to Newmont’s 2013 All-In-Sustaining-Cost for producing gold, they provided the following chart:
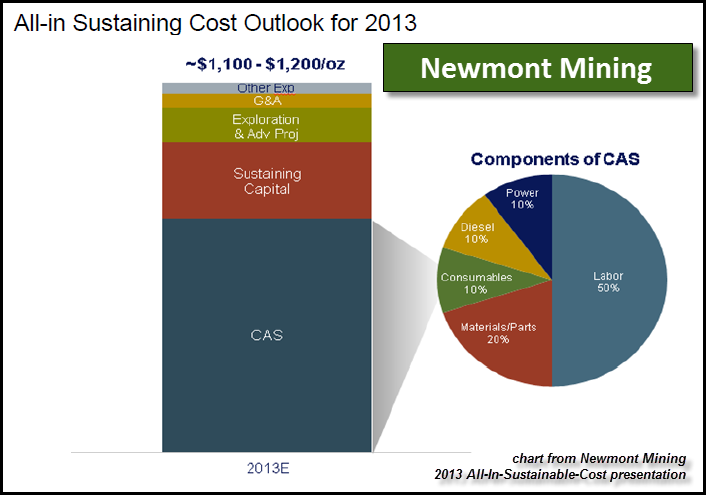
Now, this was a few years ago when the price of oil (energy) was higher, so with lower energy prices, costs have come down since then. Regardless, this still provides us with a list of costs. The main part of Newmont’s sustaining costs are shown as CAS – Cost Of Sales. That’s the blue part of the bar chart, which is broken down on the right, in the circle pie-chart.
If we look at the pie-chart by itself, we see that energy comprises 20% of the total costs. Of course, the knee-jerk reaction from a typical precious metals analyst is that energy is only 20% of Newmont’s cost to produce gold. The analyst only sees 20% energy cost because his mind has been trained to look in a superficial and specialized way. We are going to change that limited viewpoint HERE & NOW.
Here is a breakdown of the CAS -Cost Of Sales pie-chart:
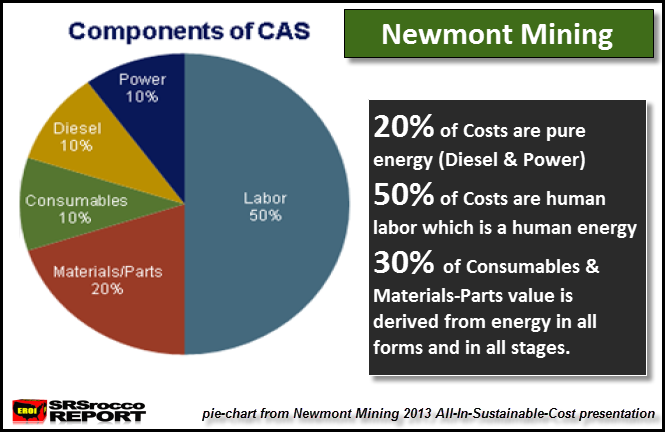
As we can see, diesel at 10% and power (electricity) at 10% comprises 20% of pure energy for Newmont’s gold cost. However, we must realize that labor at 50%, is also a form of energy…. it’s HUMAN ENERGY. People need to understand that science breaks down labor into work or energy. The term Horsepower was developed from the energy of horses performing work. Thus, human labor is a form of work, and is also a form of energy.
Now, some of the labor force gets paid more because their labor contains more experience and specialization. For example, an experienced mechanic working on the huge earth moving machines gets paid more than another working doing regular manual labor because of the TIME & ENERGY invested in the mechanic’s trade. The mechanic spent years doing work and education which consumed one hell of a lot of energy in different forms to have 20 years experience. Thus, the energy in labor for years of work has provided him that experience. Which means, the amount of work-energy the mechanic has done for 20 years allows him to be paid a higher rate.
So, if we add human labor (work-energy) of 50% of the CAS cost with the 20% of diesel and power, the total is now 70%. So, if we were going by scientific terms of doing work-energy, pure energy and labor energy comprises 70% of Newmont’s cost to produce gold in its CAS- Cost Of Sales breakdown.
Okay, let’s look at the remaining two categories:
-
Consumables = 10%
-
Materials & Parts = 20%
Newmont’s uses a lot of consumables to produce gold. Here is a list of some of Newmont’s consumables provided in their 2015 Sustainability Report:
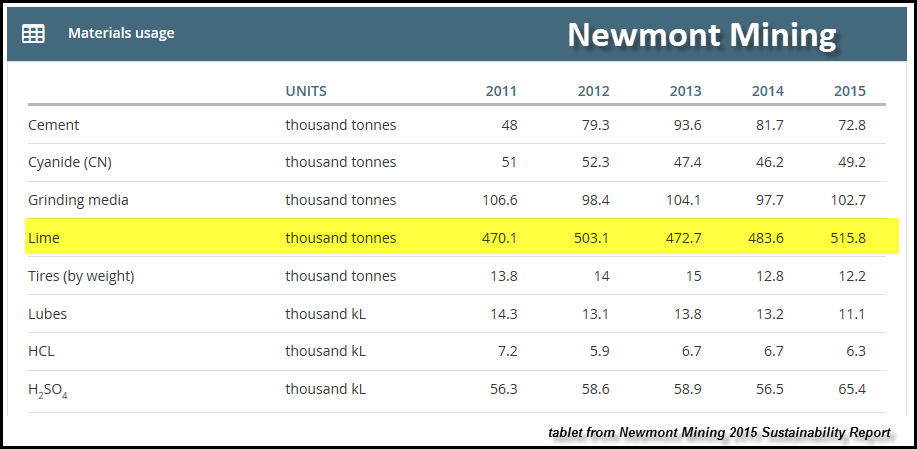
I decided to use lime as perfect example, because the production and transportation of lime is very energy intensive. Again, according to a typical gold mining analyst, he places lime as a “consumable cost” and not an energy cost. Once we look at the total process of producing and transporting lime, we will realize the overwhelming value or cost of lime is from the ENERGY in ALL FORMS and in ALL STAGES.
Here is simple diagram of the production of lime, which Newmont consumed 515,800 tonnes in 2015 to produce gold:
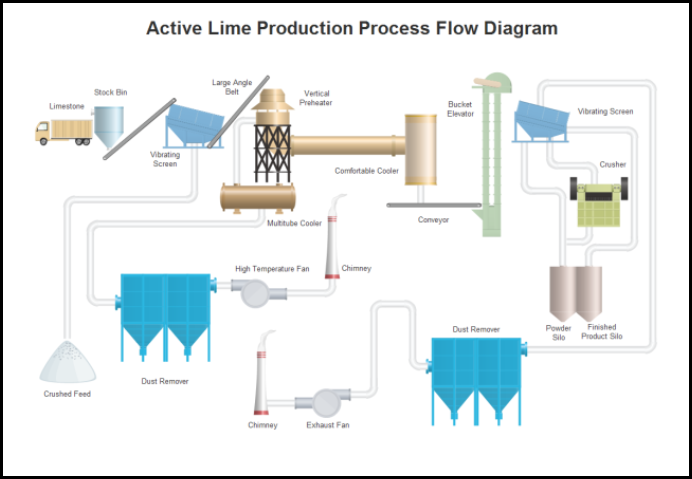
The lime is first mined from the ground and transported to the production plant. This costs a lot of energy from the diesel in the truck as well as the labor-energy of the truck driver. As the lime moves through the producing plant, it consumes a great deal of energy as electricity is needed to power the plant as well as the high-temperature Kilns that process the lime.
Here is a small section of an EPA Report on the Economic Production of Lime in the United States:
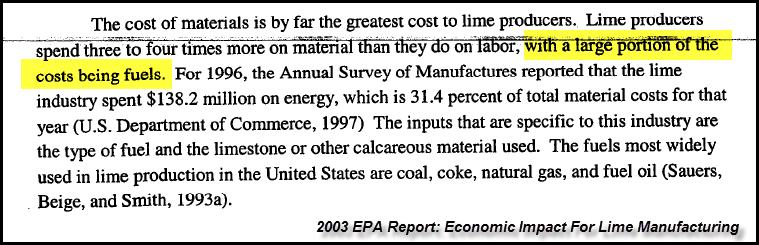
As the report states, the cost of materials for producing lime is much greater than the labor… three to four times greater. If we go back to Newmont’s CAS – Cost of Sales, labor was 50%, which is half the cost, while the other half was from energy, materials and consumables.
Regardless, the largest percentage of materials used to produce lime is liquid fuels. Furthermore, the lime industry spent $138.2 million on energy in 1996, which was 31.4% of its material cost. I would imagine that energy cost is much higher now and accounts for an even higher percentage of total costs.
In addition, we must add the percentage of human labor to the total energy cost in producing lime. Moreover, all the other materials used to make lime also must be viewed the same way in their production. Even though the lime industry purchased materials to produce lime, the overwhelming value of those materials came from the energy consumed in ALL FORMS and in ALL STAGES.
Once the lime is produced, it has to be transported to Newmont’s gold mines. Lime is very heavy, so it takes a lot of energy to transport lime via ship, railroad or by truck. Either way, the energy burned in the ship, locomotive and truck as well as the labor by the ship captain and crew, locomotive engineer or truck driver also must be added to the total cost as ENERGY.
If we break down the total cost in producing lime, I would assure you the overwhelming majority of its value comes from the ENERGY in ALL FORMS and in ALL STAGES.
Using lime as an example, we can see that other consumables such as cyanide, grinding materials and cement also get their value from the ENERGY in ALL FORMS and in ALL STAGES in their production. This is also true for the other category of “Materials & Parts.”
If Newmont has to replace a large part of a system in one of their ore processing facilities, the value of that part comes from the energy consumed in ALL FORMS and in ALL STAGES along the way.
Additional Newmont Mining Full Cycle Energy Costs Explained
Let’s take a look at Newmont’s All-In-Sustaining-Cost chart once more:
Okay, I just explained the first category on the bottom of the bar chart in blue, the CAS – Cost Of Sales. Let’s discuss the next category called “Sustaining Capital (in red).”
Newmont Mining spends a lot of money on sustaining capital to be able to produce gold on a continual basis. According to their Q2 2016 financial report, they will spend between $650 and $700 million on sustaining capital in 2016. One part of sustaining capital is “stripping costs.” This is a tremendously energy intensive activity of stripping (removing) overburden and poor quality ore.
Many of you are aware of this huge cost if you watch the show, GOLD RUSH. If my memory serves me correctly, the team under Parker Schnabel spent something close to $500,000 to remove the overburden and move their wash plant on one of their biggest gold cuts last year in Alaska. The majority of that cost was the diesel to power the huge earth moving machines to remove that overburden.
Basically, the stripping cost listed as “Sustainable Capital” is from the liquid energy burned and human labor. Another energy cost found in sustainable capital is the making of new haul roads to get to the new ore cut. This takes a huge amount of energy as loaders, haul trucks and other earth moving machines transport the rock and gravel to make these new haul roads.
If I went down the entire list of sustaining capital, the overwhelming expenditure of the $650-$700 million Newmont will spend this year will be from the ENERGY in ALL FORMS and in ALL STAGES.
Another category not included here is regular “Capital Expenditures.” This would include purchasing a new one of these babies below:

This is the Caterpillar 797F that costs $5 million. If we went on the same journey as we did when I explained the cost to produce lime, we would find out that the overwhelming value of that massive CAT 797F comes from all the ENERGY in ALL FORMS and in ALL STAGES.
Hell, the huge tires for the CAT 797F, that cost $40,000 a piece, each contain nearly 2,000 pounds of steel, enough to build two small cars and enough rubber to make 600 tires to put on them.
Again, according to the gold mining analysts, they list the Caterpillar 797F as a capital expenditure. However, if we look through the entire ENERGY MATRIX, we now see that what Newmont purchased as a CAT 797F haul truck, is all the ENERGY in ALL FORMS and in ALL STAGES in its production.
If we consider the last few categories in Newmont’s All-In-Sustaining-Cost bar chart of Exploration-Advanced Projects, General & Administration and Other, we can apply the same energy logic. It takes a lot of energy to explore for gold as well as advancing new gold mining projects. Not only does it take the burning of a lot of energy to explore and advance projects for gold mining, there is also a lot of human labor (manual & experienced), materials and parts to consider in the total process.
Unfortunately, most people have been programmed to compartmentalize everything today. They see most things separately and are not able to understand how energy gives value to the majority of goods and services in the world today. They just aren’t able to see the entire process of ENERGY in ALL FORMS and in ALL STAGES.
They just see the end result and believe that it magically appeared on the storeroom shelf. I would assure you that the value of most goods sitting on the shelves in the thousands of Walmarts across the country were derived from ENERGY, in all forms and in all stages.
There are several other items that Newmont has to dish out money to be in the business of producing gold, such as interest expense and taxes to name a few. I would imagine someone reading this article would be quick to blurt out that interest expenses and taxes are not energy. Well, that might be true if we look at them in a superficial way, but most taxes go to pay the governments to maintain roads, infrastructure, public buildings and government employees that function as a necessary part of our highly complex society.
Thus, the government spends a lot of money on energy as well as human labor to maintain roads and infrastructure. So, if we really expand our ENERGY MATRIX horizons, we would see that ENERGY is the main driver that comprises the value of most goods and services in the world today… including GOLD.
The Strategic Importance Of ENERGY = GOLD = MONEY
Hundreds of years ago, the prize by empires was obtaining gold and silver. This was especially true for the Spanish Empire and its leading role in the world at the time due to its ability to swindle massive amounts of gold and silver from South America and Mexico.
During the 1500’s when the Spaniards were using Aztecs as slaves to loot gold and silver from their lands, the energy source at the time was mainly human and animal labor. To build the massive Spanish Armada that was destroyed or sunk in huge storm in 1588, it took a great deal of human and animal labor.
(courtesy of Wikipedia)
Furthermore, according to this source, On May 28th 1588, the Armada, with around 130 ships, 8,000 sailors and 18,000 soldiers, 1,500 brass guns and 1,000 iron guns, set sail from Lisbon, Portugal, headed for the English Channel. The Spanish were able to amass such a large fleet of ships, crew and armaments due to massive amount of gold and (especially) silver they plundered from South America and Mexico.
According to the Historical World Silver Production 1492-1927, the Spaniards produced over 90 million oz of silver from 1521-1600 in Mexico alone. They started mining silver in Zacatecas, Mexico in 1540, the region where the largest primary silver miner in the world, Fresnillo is currently producing silver.
Furthermore, the Spanish opened large-scale mines in Peru, in the land of the Incas. From 1533 to 1600, over 94 million oz of silver were produced. As we can see, the Spanish became the leading empire on the globe due to their ability to amass the largest hoard of silver on the planet at the time.
Well, this all changed in the early 1900’s when the top oil barons realized the value of money would come from oil and no longer from just human and animal labor. This is why the top oil companies decided to carve up the globe in the early 1900’s and work with each other to control, extract, and sell the most important energy source to world.
Oil was also the main reason why Hitler decided to attack Russia in World War 2. He needed the oil to continue with his plans of Nazi expansion. Instead of using gold or silver, Hitler needed oil.. and badly.
According to this source on Germany & Oil:
At the outbreak of the war, Germany’s stockpiles of fuel consisted of a total of 15 million barrels. The campaigns in Norway, Holland, Belgium, and France added another 5 million barrels in booty, and imports from the Soviet Union accounted for 4 million barrels in 1940 and 1.6 million barrels in the first half of 1941. Yet a High Command study in May of 1941 noted that with monthly military requirements for 7.25 million barrels and imports and home production of only 5.35 million barrels, German stocks would be exhausted by August 1941.
The 26 percent shortfall could only be made up with petroleum from Russia. The need to provide the lacking 1.9 million barrels per month and the urgency to gain possession of the Russian oil fields in the Caucasus mountains, together with Ukrainian grain and Donets coal, were thus prime elements in the German decision to invade the Soviet Union in June 1941
Here we can see that Hitler gained five million barrels of much-needed oil from Norway, Holland, Belgium and France to be able to attack Russia. I have read some accounts that Russia was the REAL PRIZE for Hitler and the Nazi’s. Which is why they used their lightning-speed Blitzkrieg Warfare on the Western European countries to consume as little fuel as necessary while acquiring the necessary petrol to attack Russia.
When the United States entered into World War 2, it was just a matter of time before the Germans were beaten. The U.S. was the Saudi Arabia at the time and was providing most of the oil to the allies. It was the huge reserves of oil and natural resources that propelled the United States to become the leading empire in the world.
Unfortunately, the United States peaked in cheap oil production in 1970. One year later, Nixon dropped the Dollar-Gold peg. How ironic… aye? Then of course we had the Arab oil embargo in 1973 and Iranian oil crisis of 1978 which pushed the price of oil from $1.80 a barrel in 1970 to $31 by 1979. This had a profound impact on the price of gold and silver as they skyrocketed during that decade.
However, over the next 45 years, clever bankers on Wall Street, London and etc, have hoodwinked investors into putting their surplus funds into paper assets which have become the GREATEST PONZI SCHEME in history.
This paper ponzi scheme can only work on RISING OIL PRODUCTION. Again, the greatest ponzi scheme in history can only work on rising oil production. Furthermore, it can only work on rising CHEAP oil production. Unfortunately, the world has peaked in cheap oil production a decade ago. We are filling in the gaps with very expensive oil production that the world cannot afford without the massive increase of debt.
According to the work by the Hills Group and Louis Arnoux, they believe an OIL PEARL HARBOR will take place by the end of the decade:
They don’t see a rising oil price in the future, rather they believe it will fall as the available net energy to the market will continue to decline. They also believe the economic principle of supply and demand will no longer function as a “Thermodynamic Collapse” of oil will take place.
With rapidly falling oil production, the $250 trillion in total world assets of Stocks, Bonds, Real Estate and Insurance Funds will be in big trouble. Thus, investor fleeing rapidly falling paper assets and Real Estate will move into gold (and silver) to protect wealth.
Energy has been the key driver for the value of gold and silver for thousands of years. For the majority of our history, the energy has come from human and animal labor. However, as coal, then oil came in the picture, this changed the dynamics considerably. With the peak of inexpensive global oil production, the world is about to experience one hell of a FINANCIAL CALAMITY. Very few people are prepared for what is coming.
With the understanding that most goods and services in the world are based upon all the ENERGY in ALL FORMS and in ALL STAGES, things are about to get very interesting. Some believe falling energy production will depress the price of gold. This is an incorrect assumption
Due to the massive funneling of the world’s funds into paper assets over the past 45 years, this has artificially lowered the value of gold (and silver). Once the world wakes up to the fact that they are invested in ENERGY IOU’s, investors will move into physical gold to protect wealth as oil production declines in earnest.
I will be writing more articles detailing this in the future.
Check back for new articles and updates at the SRSrocco Report.

Independent researcher Steve St. Angelo (SRSrocco) started to invest in precious metals in 2002. Later on in 2008, he began researching areas of the gold and silver market that, curiously, the majority of the precious metal analyst community have left unexplored. These areas include how energy and the falling EROI – Energy Returned On Invested – stand to impact the mining industry, precious metals, paper assets, and the overall economy. He has written scholarly articles in some of the top precious metals and financial websites. Visit his website SRSrocco Report.


