The U.S. Stock Market Crash Of 2022: An Analysis


The stock market has declined sharply between November and March in ten of the past fourteen years (71 percent of the years). This happened again from November 2021, into early 2022.
In this article we examine the characteristic of this recent plunge, and if there is going to be another one in 2022, and if so, how deep stocks will fall.
Here is what we know:
- The stock market just crashed. It happened.
- This stock market crash was predictable.
- It was orderly.
- It was relatively mild.
- It will not be the only stock market crash of 2022 or 2023.
Let’s begin with the first point. A U.S. stock market crash just happened. It was not just a correction. Corrections are 10 percent. This was much worse. It was a crash. Crashes are defined as plunges that shave 20 percent or more off the stock market. Some consider a crash a 15 percent decline.
Below is a rundown on the crashes and plunges that just occurred in the major U.S. stock indices.
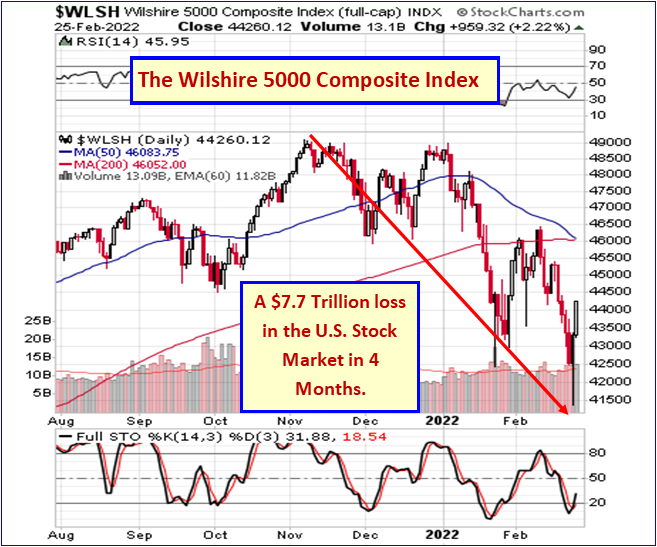
The Wilshire 5000, essentially a composite that measures the entire stock market, plunged 7,714, 15.7 percent, from its all-time high at 49,089.39, on November 5th, 2021 through its 41,374.95 bottom on February 24th, 2022. $7.7 Trillion of wealth was wiped out in just four months. This cancelled out most of the Quantitative Easing Monetary Dollar printing the Fed pushed into the economy over the past two years -- in just four months.
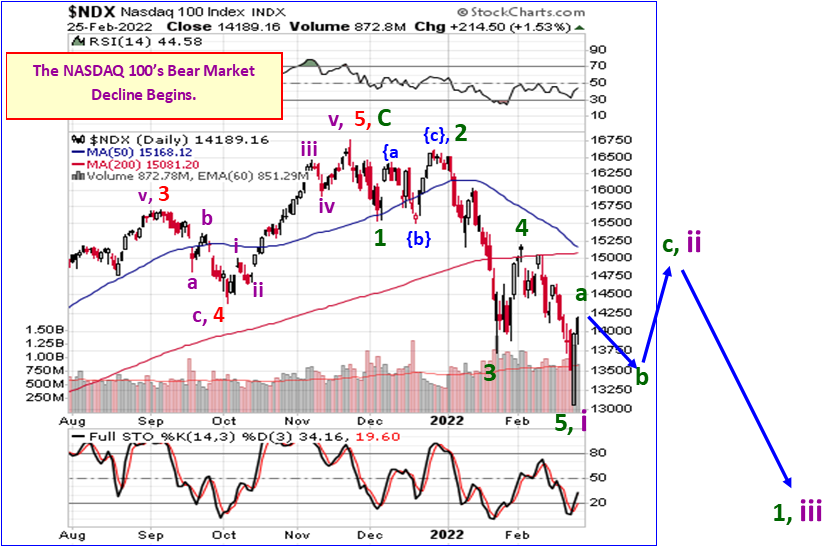
The NASDAQ 100 topped November 22nd, 2021, at 16,764.86, the final wave 5-up top. From there it crashed 3,699.42 points, 22.06% to a low of 13,065.44 on February 24th. The Bear market in Techs is now underway.
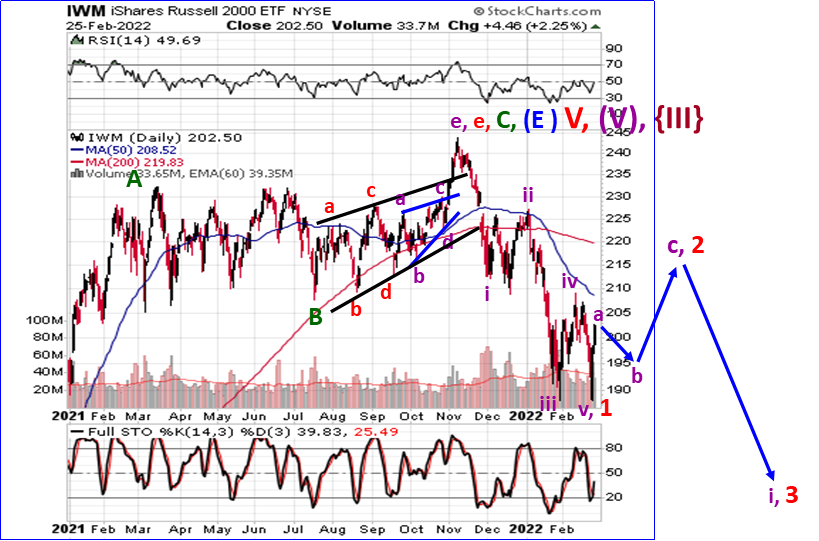
IWM (ETF for the Russell 2000) crashed 22.9 percent in a five subwave Minor degree plunge to kick off the new Bear market. Minor degree wave 1-down started on November 8th, 2021 at 243.72, dropped 55.8 points, and completed on February 24th at 187.92.
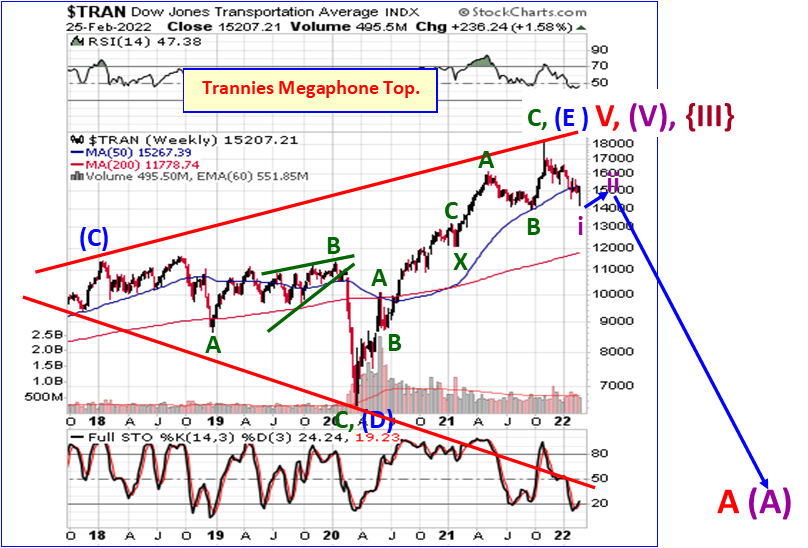
After the November 2nd, 2021 top at 18,246, Trannies have CRASHED 22.5%, 4,113 points to their February 24th, 2022 low at 14,133.
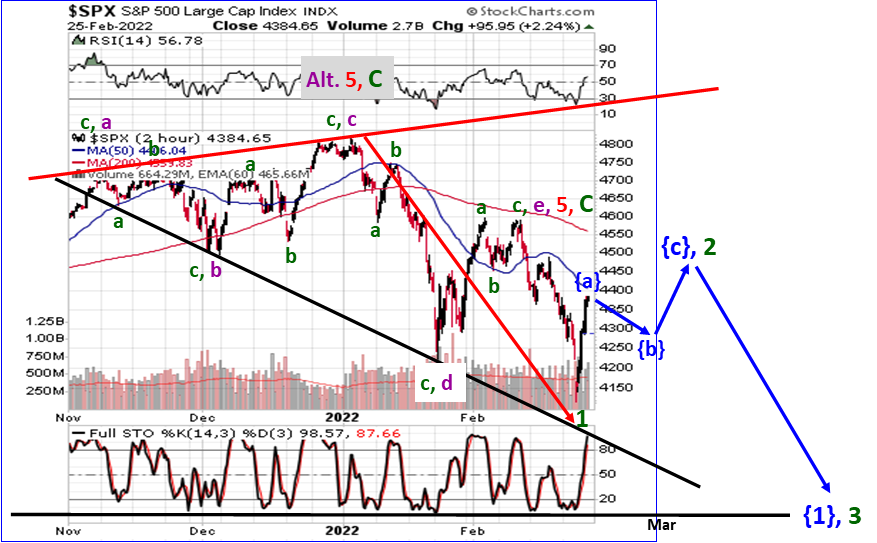
The S&P 500 plunged 704 points, 14.6 percent, from its all-time high at 4,818.67, on January 4th, 2022 through its 4,114.65 bottom on February 24th, 2022.
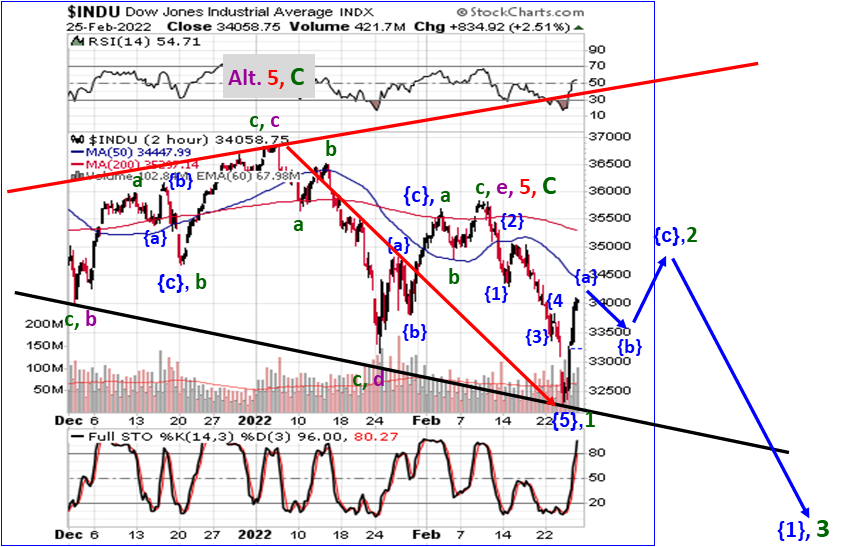
The Dow Industrials plunged 4,680 points, 12.7 percent, from its all-time high at 36,952.65, on January 5th, 2022 through its 32,272.64 bottom on February 24th, 2022.
When we study the above charts, we see that this massive loss of stock valuation was surprisingly orderly. We see five wave declines, three progressive declining waves wrapped around two corrective bounces that worked off oversold conditions along the way to lower prices. Some crashes are orderly as we just experienced, however many are waterfall shocks to the system.
This recent crash was also somewhat moderate, stealing only between 12 percent and 22 percent of the value of stocks.
These drops occurred with three Hindenburg Omen potential stock market crash signals on the clock simultaneously. It is a rare and dangerous situation when there are three official H.O.s on the clock at the same time. Usually there are only one, maybe two at the same time.
Are More Stock Market Crashes Coming in 2022?
To answer this, first we need to see if this stock market crash was predictable? Yes, it was. Take a look at this next chart:
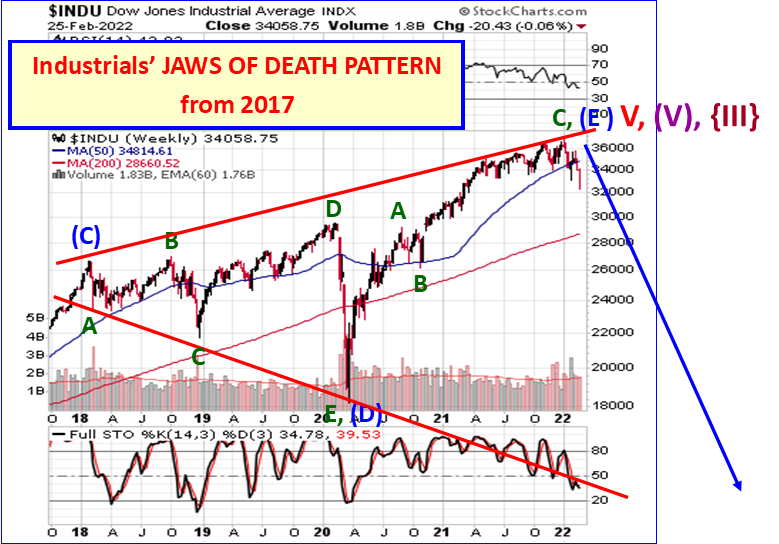
At the beginning of 2022, the Industrials had just completed a textbook perfect Megaphone topping pattern, which we have dubbed the Jaws of Death pattern, as it looks like a shark’s jaws about to devour its prey. Stocks always decline from these patterns, and they decline hard. Further, their downside price target is usually the bottom of the declining boundary line. The Megaphone pattern finished, and then stocks crashed, right on schedule.
However, what needs to be taken seriously is that the Industrials did not come close to reaching the downside target for this pattern. Not even close. The downside price target is 12,000, not the 32,000 it reached. This suggests more downside is coming.
The initial five-wave decline from their all-time highs was just the first larger degree wave of five more waves to come. This means there will be at least two more stock market crashes, wave 3-down and wave 5-down inside this developing Bear market.
Stocks have started short-term corrective wave 2’s on February 24th, 2022. This corrective rally is fast moving, so could finish within weeks. If so, it means a second stock market crash, wave 3-down, is not far off, and could be an early to mid-2022 event. Since wave 3’s are typically larger than wave 1’s, often significantly larger, this next stock market crash will make what we just saw seem comparatively gentle. Because it will come as wave 3-down, it will likely not be orderly. We could see a waterfall drop.
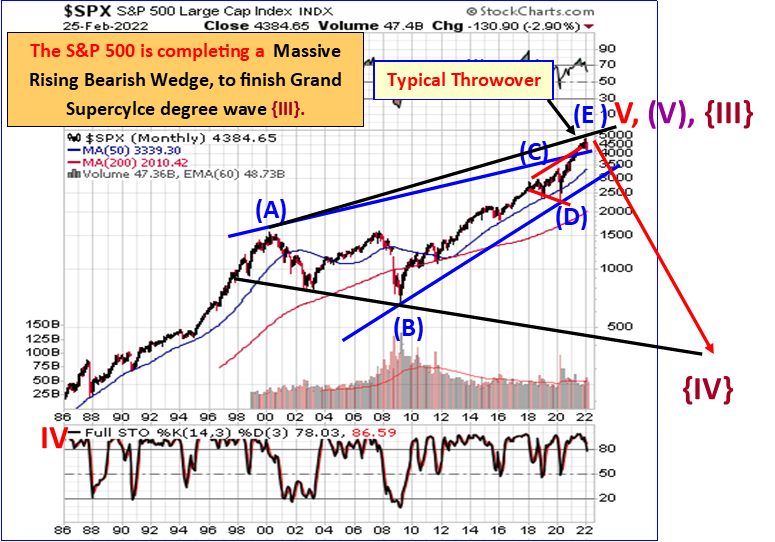
But let’s look at an even larger degree chart. This next chart shows the S&P 500 has formed a Jaws of Death mega topping pattern from 1986, which also overlaps a Rising Bearish Wedge pattern from 1986. These patterns covered the entirety of Cycle degree wave V-up Bull market. They also completed Supercycle degree wave V, and also completed the multi-century Grand Supercycle degree wave {III} Bull market. It is the end of a short-term, Intermediate term, and also long-term Bull markets. It is telling us the crash we just experienced is the tip of the iceberg for the commencing Grand Supercycle degree wave {IV} Bear market. The downside price targets predicted by this next chart are breathtakingly low, an S&P 500 level below 1,000.
In conclusion, this stock market is set up for a Bear market for the ages, one that will include multiple plunges and crashes along the way. This set-up of finished Bearish patterns, completed Elliott Wave mappings, overbought conditions, overextended rallies, extreme positive sentiment, negative turn cycle occurrences (there are an extraordinarily high number, 18, of phi mate and Bradley model turn dates coming in 2022), advance/decline line Bearish divergences, and Hindenburg Omens is one of the most ominous that I can recall in the 30 years I have been doing Technical Analysis stock market forecasting. This gets back to what Technical Analysis of Markets is all about. The stock market has a language of its own, and is telling us where it is headed next. Markets are the accumulation of all knowledge known on planet earth, which is built into pricing. That pricing forms patterns, and creates a language that we can study to understand what the market is telling us about its future.
At Dr. McHugh’s www.technicalindicatorindex.com we track the patterns and waves that make up large and short-term degree trends, and chart them in our forecast newsletters. We have developed several proprietary Buy/Sell indicators that help us identify when the next significant move is starting for the major Stock Indices, as well as for Gold, Silver and Mining stocks, in which direction the move will develop, with likely price targets. We publish these indicators in every Newsletter to subscribers. We offer education and real time trading to identify opportunities, and demonstrate how to trade markets up or down, based upon these indicators, patterns, and overbought / oversold conditions. Subscriptions are available at the home page at our website.
*******


