Valuing Gold - USD FMQ Update


 There is only one way to value gold, and that is to quantify the expansion of the fiat currency in which it is priced. That is the sole purpose of the Fiat Money Quantity (FMQ), which since I last wrote about it five months ago has increased by $375bn to $13.7 trillion. This is despite the end of quantitative easing, which had been tapered down before being abandoned altogether. The long-term chart of FMQ is shown below.
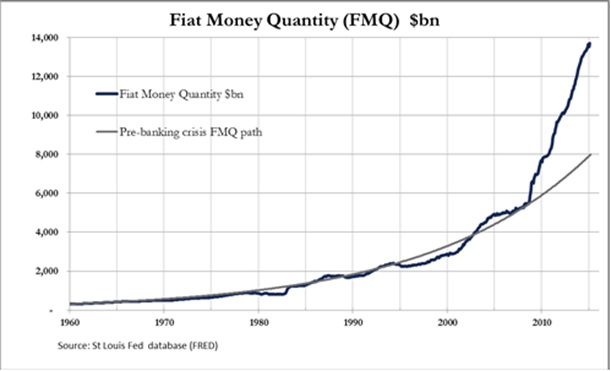
FMQ is the total instant-access cash and deposits in the commercial banks plus their reserves at the Fed and the temporary means by which those reserves are changed. Its purpose is to quantify the difference between sound money and fiat currency by including the steps by which gold has been progressively absorbed into the banking system from private ownership and into government vaults via the commercial banks and the Fed. A fuller description can be found here.
The pace of FMQ creation from 2008 continues well above the pre-Lehman crisis trend, and it is now $8,259bn higher than at that time, an increase of 152% in 78 months. Who would have thought that a temporary provision of money and credit to stabilise the financial system in the wake of the Lehman crisis would have developed such permanency?
As a measure of monetary inflation, FMQ differs from more conventional metrics by including liquid bank assets held on the Fed's balance sheet. By including money parked out of sight in this way a truer position is obtained. Critics of this approach say it is double-counting, because bank reserves recorded at the Fed are also recorded at the commercial banks as customer deposits. This is undoubtedly true, but the whole fractional reserve system involves multiple counting of the same underlying money, so it is hardly disqualified on these grounds.
The next chart shows how FMQ has deflated the price of gold, measured in constant 1934 dollars. This was the year that President Roosevelt devalued the dollar from $20.67 to $35 per ounce of gold.
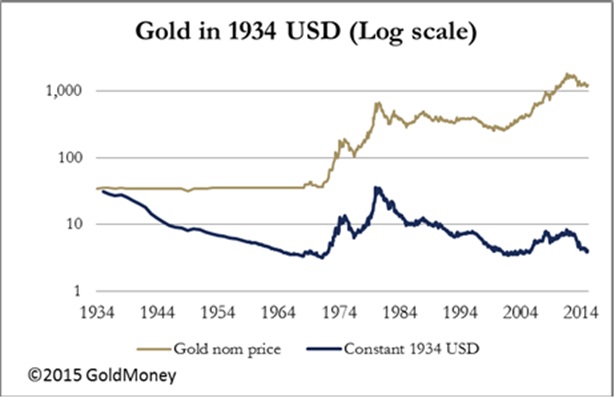
The gold price is shown in nominal US dollars and also in constant 1934 dollars adjusted for the increase in FMQ; the disparity between these two prices has widened over the years to $1,211 and $3.91 respectively. The two previous times the adjusted gold price hit these low levels were in April 1971 at $3.31, four months before President Nixon was forced to suspend the Bretton Woods Agreement, and in October 2001 at the start of the last bull market when it got down to $3.45. This time, the higher rate of increase in FMQ suggests the price today is more undervalued than the two previous times on a forward-looking basis[1].
The last chart is of the gold price since the Lehman crisis and in July 2008 constant dollars, when FMQ accelerated above the long-term trend as shown in the first chart.
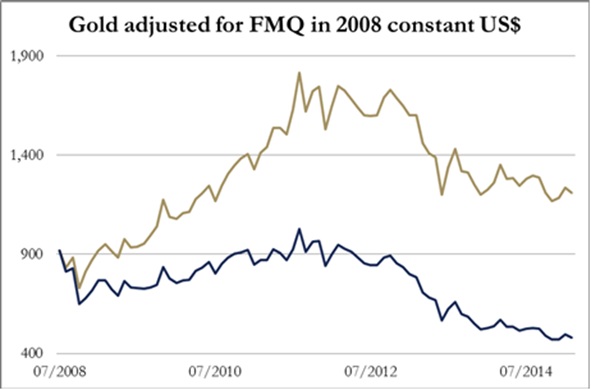
While the nominal price taken in February 2015 was $1211, the adjusted price was $480, representing a 45% fall from the $918 price in July 2008.
In summary, FMQ shows that gold is substantially under-priced in dollars on a long-term value basis. In the past this level of under-pricing has been followed by major price shocks to the upside on both occasions.
[1] Note: previously I deflated the gold price by the increase in above-ground stocks. I am persuaded this is not necessary because the growth in mined gold is approximately the same as global population growth.
********
More from Gold-Eagle


