As Volatility Spikes, Here’s What Could Be Ahead For Gold Price And Silver Price


The shift from low to high volatility in the markets is on. And almost by default, that’ll include gold and silver, since they’re inversely correlated to stock markets most of the time.
We’ve already seen this at work. The S&P 500 fell 2.2% on April 2, and in response, gold rose 1.2% and silver 1.6%.
It’s more than just a daily phenomenon, though; any prolonged wave of uncertainty that hits the markets will push investors into gold. What’s happening on a small scale now will play out on a much bigger scale when sentiment shifts, especially in regard to our monetary system.
And when gold and silver volatility really ratchet up, it’ll be a lot of fun, as you’re about to see.
First, here’s a snapshot of the daily price movements in gold and silver since the year the last bull market peaked:
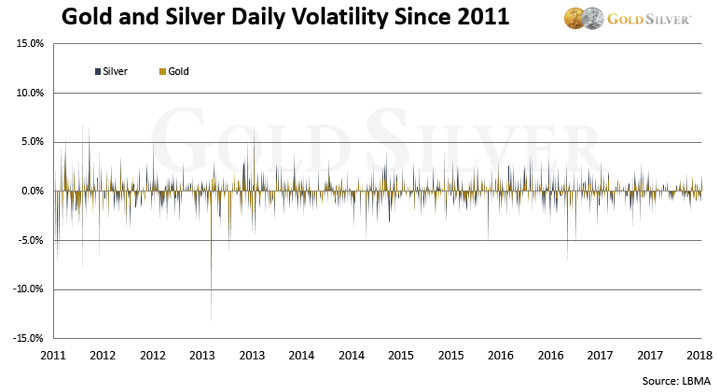
A few things stick out. You’ll first notice that gold and silver have rarely had a daily move greater than 5% over this time period. Further, volatility has decreased. Prior to 2018, gold’s average daily movement was 0.5%, and silver’s 0.8%. For the first three months of this year, however, those averages were almost halved.
You also see confirmation of what most of us already know: Silver’s volatility is usually greater than gold’s. Here’s a couple of the more dramatic examples: On May 13, 2011, gold rose 1.1%, but silver soared 11.4%. And on April 15, 2013, gold fell 9.2%, while silver dropped 14.1%.
But silver is not always more volatile than gold. In the chart above, silver's price movements were bigger 71.5% of the time—meaning gold’s were bigger 28.5% of the time. And the two metals don’t always go the same direction; gold rose 0.26% on December 2, 2008 (not shown), while silver declined 5.05%.
Exceptions aside, silver will continue to be more volatile than gold, especially on days when developments impact the markets unexpectedly.
So, if volatility really starts to ratchet up, what kind of levels might we see?
What High Volatility in Gold & Silver Look Like
The best example comes from what has been, so far, the greatest precious metals bull market in modern history.
The following chart shows the daily price movements of gold and silver from January 1971 through December 1980. Check it out.
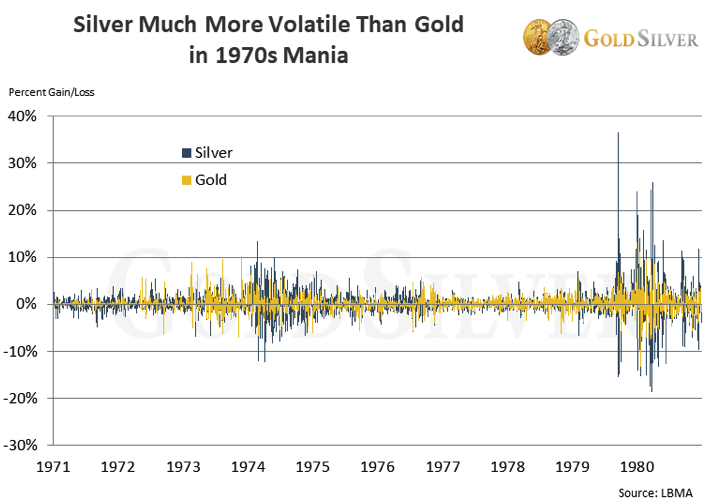
The chart is a tad crowded, but you can see that volatility spiked in 1974 and 1979/80. These were periods when investors piled into precious metals, the historical message being that another rush in the future would lead to similar volatility.
And yes, silver was more volatile than gold. The most fun example occurred on September 18, 1979, when gold rose 6.8%—but silver skyrocketed 36.5% higher. The price was $13.40 on September 17, and closed at $18.303 the next day.
-
Can you imagine your silver holdings rising by 36.5% in one day? If Mike is even half right about what’s coming, odds are high we’ll see one or more days like that again.
On average, silver moved 1.4 percentage points more than gold during the decade. What’s interesting, though, is that silver logged bigger one-day movements only 63.5% of the time. So gold moved more sharply than silver roughly one-third of the time.
Here’s another compelling fact. When the market entered the mania, silver's volatility increased at a more rapid pace than gold’s. From 1979 through the end of 1980, silver outperformed gold by an average of 2.4 percentage points, almost double what it did before the mania set in.
There’s no doubt in our mind that this level of volatility—and silver’s dramatic outperformance over gold—will repeat in the next big run-up in precious metals.
Investment Implications
Based on the historical record, there are clear investment conclusions we can draw:
-
Higher volatility is ahead. Current volatility readings are half of what they were a few years ago, and a third or a quarter of the levels during the mania. They won’t stay this subdued for long, and once precious metals get rocking, so will their volatility.
-
Investors must be emotionally prepared to handle high volatility, regardless of the direction. The days the metals soar will be fun, but you can’t get let yourself get shaken out on the down days. Not until Mike says he’s starting to sell.
-
Once prices start to run again, we’ll see some breathtaking performances from silver. It’s coming; markets are cyclical, and a change in sentiment is all it’ll take.
The future will indeed be very fun for those of us that have meaningful exposure to gold and silver. In preparation, Mike and I continue to accumulate. Here’s what I just bought.
*********


