Wake Up And Smell The Bull Trap!
 share
share
 share
share
 share
share
 share
share
 share
share

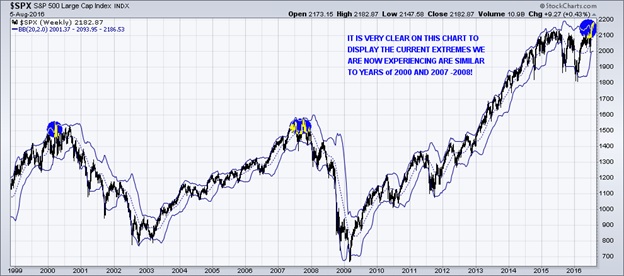
We are currently experiencing a “Kondratiev Winter” stage in this stock market, which is at its’ “tipping” point. This is where nominal to incremental highs on the SPX can be exceeded by 2%, but by no more than 4%. I am observing a MARKET FAILURE right here and now. This is a BULL TRAP!
Last Friday’s, August 5th, 2016 rally in the SPX big price move (on low volume), resulted in no trend change to the larger BEARISH patterns. It does not change the Bearish pattern, but it probably does mean that the current rally will last for at least a few more days. There are multiple times in which rallies are reversed during the early part of the following week after a strong jobs report.
Both investors and traders continue to throw money at stocks every time there is any hint of “manufactured” good news. The majority of stocks on the NYSE are still in downtrends. Last Friday the Bureau of Labor Statistics released their “bogus” jobs report claiming that 255,000 new jobs were created.
This strong number caused gold to drop sharply, which momentum traders could have profited handsomely…if they knew about the rouge price spikes taking place in gold just hours before the move.
The labor participation rate rose a mere 0.2 percent to 62.8 percent, which is at a 40 year low. This means that potentially over 90 million Americans are still not working.
After adding only 11,000 jobs in May of 2016, the Bureau of Labor Statistics would have the public believe that the US has now added over 550,000 jobs in the sixty-day period, since. I find these numbers still hard to believe. There is no actual evidence of this having occurred:
It is all just a statistical adjustment as well as the "seasonal adjustment" factor as mentioned by Zero Hedge.
Within in a 7-year bull market over the past 120 years, it is during the Fall season of the 7th year when the next major decline commences. The SPX is putting in its final TOP. It will become a well-defined top that usually cannot exceed a 2% to 4% throw over.
We are currently witnessing an extremely aged and overvalued bull market. Despite the exuberance of “record highs,” the SPX Index is just 2% above its May 2015 peak. The SPX has been pushed to its most extreme overvalued, overbought and over bullish syndrome in an environment where momentum is slowly rolling over. Whether one is bullish or bearish, one needs to recognize that any current extremes are unparalleled.
Statistically speaking, the single most probable outcome is actually a small gain which we have experienced -- and which is then followed by abrupt and severe losses that can have the potential of wiping out weeks or even months of upside gains with an unexpected and rapid decline.
I will have to wait for the market sentiment to shift toward “risk-aversion”, before participating in any long-term bearish ETF trades. Within an increased global systematic world, both investors and traders are making “risky and unparalleled” bets, these days.
I can visualize the financial meltdown. Many financial entities will have lower profits since low interest rates persist. Historically, low yields squeeze the net interest income of banks and make liabilities harder to meet for insurance companies. I would cut their EPS forecasts by 5%-7%. The fall in US Treasury yields explains most of the cut. Their strong headwind is headed our way.
Sell into These Rallies:
If you are still in the stock market, I continue to recommend to sell stock positions into the rallies.
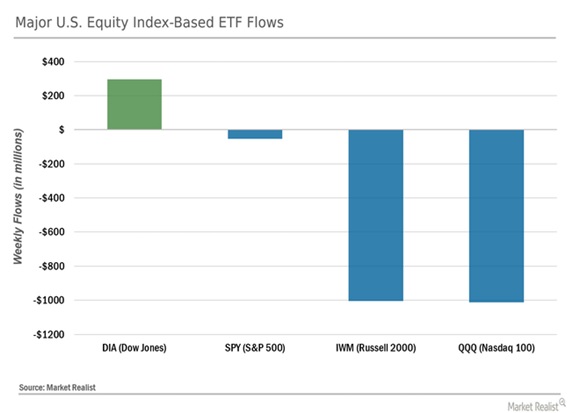
Chart End of July 31st, 2016
Take a look at the stock index outflows in July. This shows money continues to leave the leading indicator stocks (Russell 2000 and the NASDAQ Indices).
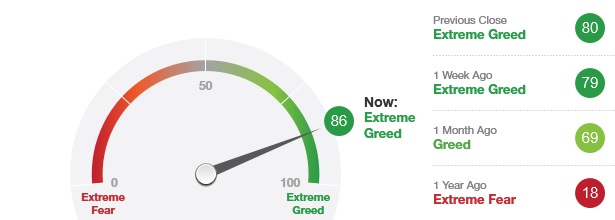
CNN Chart of Fear and Greed August 6th, 2016
Now, take a look at the Fear Index. While I personally use a slightly different mix of indicators to measure market sentiment, this is very close to my calculation and shows it in a simple visual format.
Conclusion:
With all of the “Extreme” complacently and the “Extreme” greed in the stock market, it is the perfect storm for DISASTER!
With that said, nothing happens exactly when it should in the stock market. The market is constantly trying to get the mass of participants on the wrong side of the market. If it doesn’t shake you out, it will wait you out -- and I feel it’s doing the latter method now.
share
share
share
share
share

Chris Vermeulen has been involved in the markets since 1997 and is the founder of Technical Traders Ltd. He is an internationally recognized technical analyst, trader, and is the author of the book: 7 Steps to Win With Logic
Through years of research, trading and helping individual traders around the world. He learned that many traders have great trading ideas, but they lack one thing, they struggle to execute trades in a systematic way for consistent results. Chris helps educate traders with a three-hour video course that can change your trading results for the better.
His mission is to help his clients boost their trading performance while reducing market exposure and portfolio volatility.
He is a regular speaker on HoweStreet.com, and the FinancialSurvivorNetwork radio shows. Chris was also featured on the cover of AmalgaTrader Magazine, and contributes articles to several financial hubs like MoneyShow.com.


